. 2019 Jan 9;132(1):jcs224360.
doi: 10.1242/jcs.224360.

Matrix stiffness mechanically conditions EMT and migratory behavior of oral squamous cell carcinoma

Affiliations

Matrix stiffness mechanically conditions EMT and migratory behavior of oral squamous cell carcinoma

Bibiana F Matte et al. J Cell Sci. .

Abstract

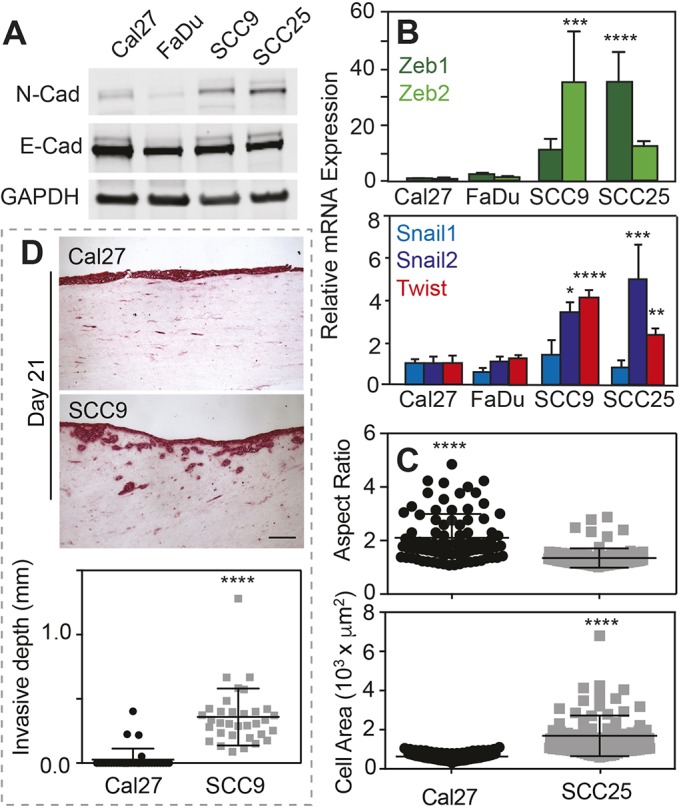
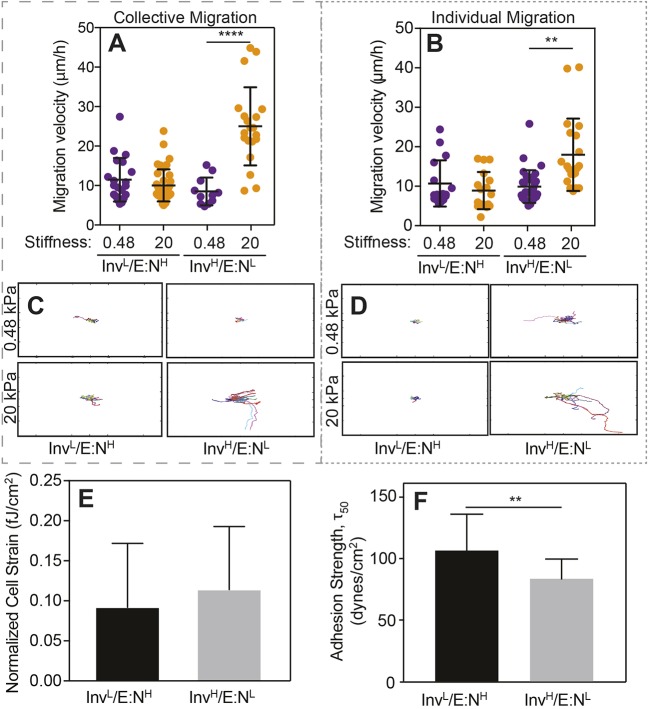
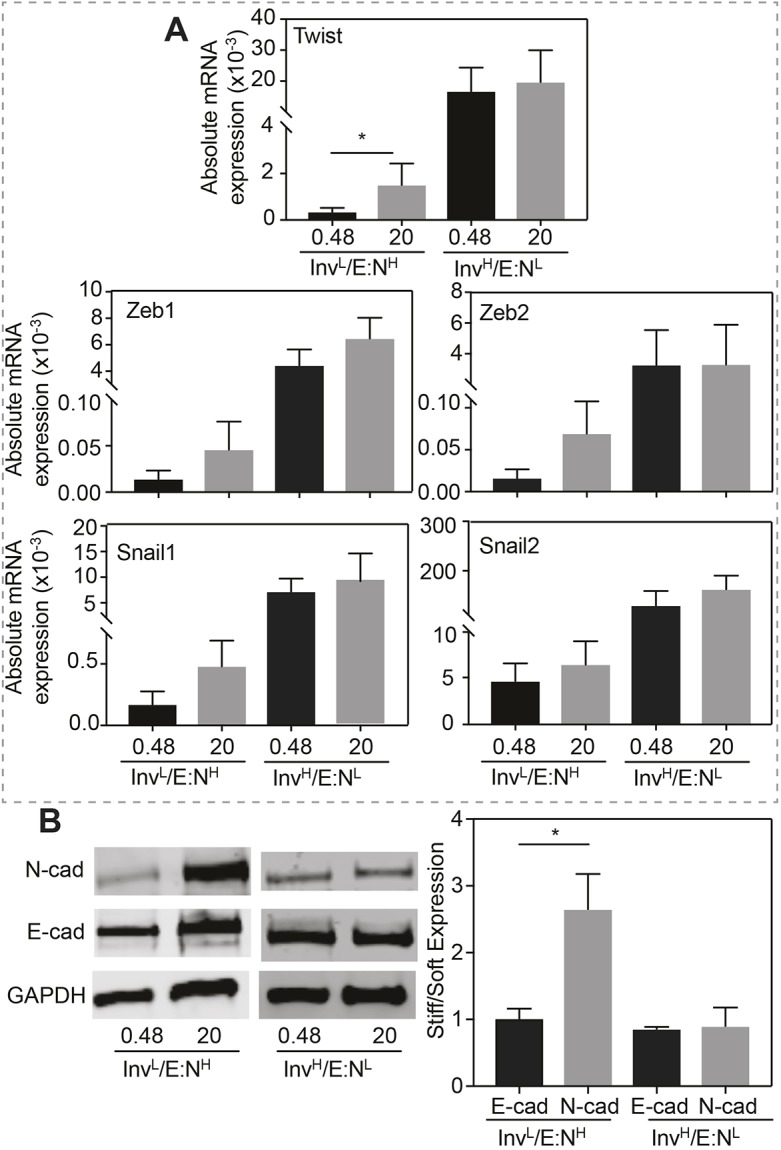
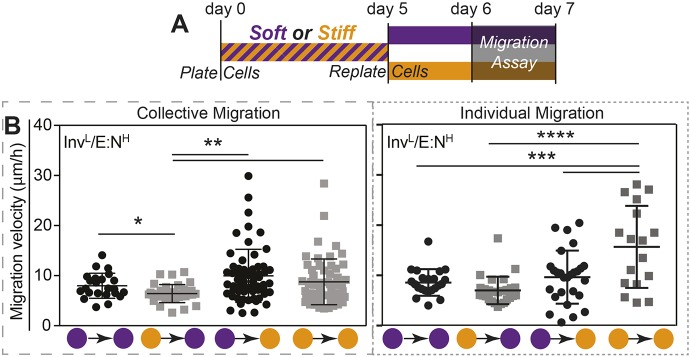
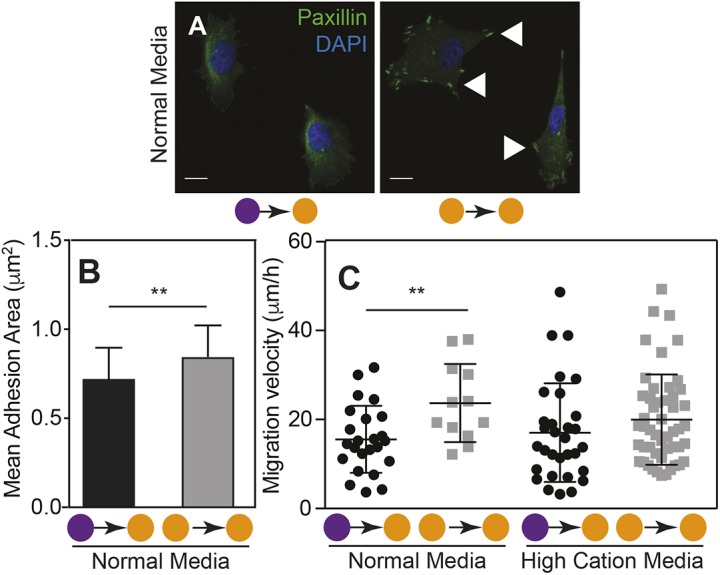
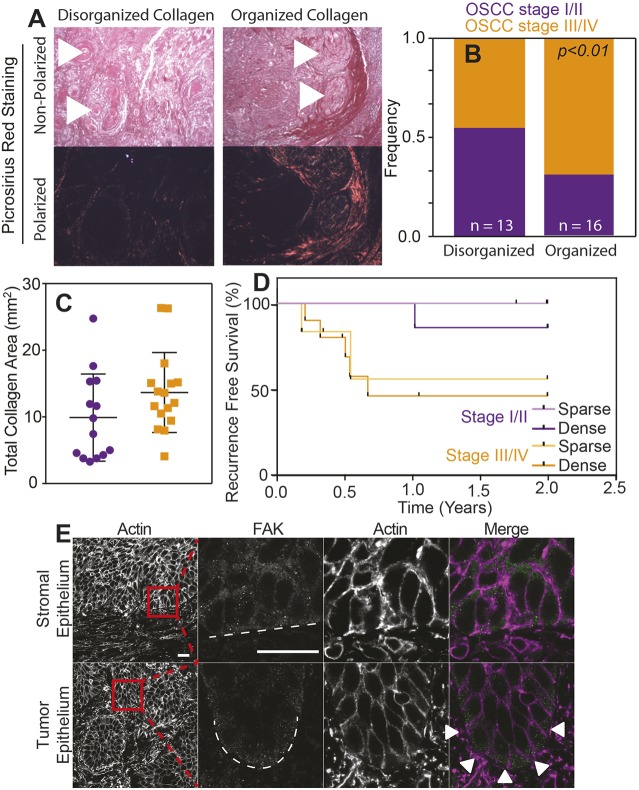
Tumors are composed of heterogeneous phenotypes, each having different sensitivities to the microenvironment. One microenvironment characteristic - matrix stiffness - helps to regulate malignant transformation and invasion in mammary tumors, but its influence on oral squamous cell carcinoma (OSCC) is unclear. We observed that, on stiff matrices, a highly invasive OSCC cell line (SCC25) comprising a low E-cad to N-cad ratio (InvH/E:NL; SCC25) had increased migration velocity and decreased adhesion strength compared to a less invasive OSCC cell line (Cal27) with high E-cad to N-cad ratio (InvL/E:NH; Cal27). However, InvL/E:NH cells acquire a mesenchymal signature and begin to migrate faster when exposed to prolonged time on a stiff niche, suggesting that cells can be mechanically conditioned. Owing to increased focal adhesion assembly, InvL/E:NH cells migrated faster, which could be reduced when increasing integrin affinity with high divalent cation concentrations. Mirroring these data in human patients, we observed that collagen organization, an indicator of matrix stiffness, was increased with advanced disease and correlated with early recurrence. Consistent with epithelial tumors, our data suggest that OSCC cells are mechanically sensitive and that their contribution to tumor progression is mediated in part by this sensitivity.This article has an associated First Person interview with the first author of the paper.

Keywords: Cancer; Collagen; Elasticity; Extracellular matrix; Hydrogel.


Conflict of interest statement

Competing interestsThe authors declare no competing or financial interests.

Figures

Fig. 1.
Fig. 1.
Invasive oral squamous cell carcinoma cell lines have increased N-cadherin and EMT marker expression. (A) Western blot of indicated cell lines (Cal27, FaDu, SCC9, SCC25) and proteins (N-Cad, E-cad, GADPH). (B) Relative mRNA expression of the indicated EMT transcription factors for the indicated cell lines. n=4 samples for each plot. *, **, *** and **** represent P<0.05, 0.01, 0.001 and 0.0001, respectively, for one-way ANOVA and Tukey's multiple comparison test. (C) Plot of aspect ratio (major to minor cell axes) and cell area for the indicated cell lines. ****P<0.001 for two-tailed Welch's t-test. n=86 and 87 for Cal27 and SCC25, respectively, from triplicate experiments. (D) Histological sections (top) of a collagen gel invasion assay stained using PicroSirius Red, of cells cultured at an air-liquid interface. The indicated cell lines were cultured on the collagen gels for 21 days prior to staining. Plot showing the invasion depth (bottom). n=3 samples and ****P<0.001 for two-tailed Welch's t-test. Scale bar is 50 μm.
Fig. 2.
Fig. 2.
InvL/E:NH cell migration is stiffness insensitive. (A,B) Collective (A) and individual (B) cell migration for the indicated cell lines on soft (purple) and stiff (orange) substrates. Each point represents the average velocity of an individual cell. For panel A, n=20, 40, 20 and 20 cells for the groups from triplicate experiments. For panel B, n=16, 17, 31, and 20 cells for the groups from triplicate experiments. **P<0.01 and ****P<0.0001 for Welch's t-test comparisons of velocities as a function of stiffness for each cell line. (C,D) Rose plots of collective (C) and individual (D) cell migration pathways for the indicated cell lines on soft (top) and stiff (bottom) substrates over a 24 h period. n=4 for each plot. Plot size is 1 mm2. (E) Average cell strain normalized to cell area for the indicated cell line. n=42 (InvL/E:NH) or 17 (InvH/E:NL) cells from triplicate experiments. fJ, femtojoules. (F) Average adhesion strength for the indicated cell lines exposed to shear stress that caused 50% of the population to detach, i.e. τ50. n=9 for both groups. **P<0.01 for Welch's t-test.
Fig. 3.
Fig. 3.
Prolonged exposure to stiff substrates induces InvL/E:NH cells to express EMT markers. (A) Absolute mRNA expression for the indicated transcription factors, normalized to GAPDH, is plotted for the indicated cells cultured on soft or stiff substrates. n=5, 5, 9 and 8 samples for each condition from triplicate experiments. *P<0.05 for Welch's t-test. (B) Western blots (left panel) and average expression ratio (in kPa, right panel) of N-cadherin, E-cadherin and GAPDH for the indicated cell lines. For each protein, the average expression ratio on stiff to soft substrate is plotted. n=4 for each protein. *P<0.05 for Welch's t-test relative to the other stiffness or cadherin.
Fig. 4.
Fig. 4.
InvL/E:NH cells exhibit ‘memory’ after prolonged exposure to a stiff niche. (A) Schematic of experimental design for cell commitment and migration assay. (B) Collective (left) and individual (right) migration was monitored for InvL/E:NH cells on soft–stiff substrate combinations as indicated (soft=purple; stiff=orange). All data were analyzed using one-way ANOVA with Tukey's multiple comparisons test with *P<0.05, **P<0.01. n=23, 35, 61 and 58 cells for collective migration, and n=22, 27, 27 and 17 cells for individual migration from triplicate experiments.
Fig. 5.
Fig. 5.
Long-term conditioning in a stiff niche increases the adhesion area in InvL/E:NH cells. (A) Images of InvL/E:NH cells on soft-to-stiff substrate (left) and stiff-to-stiff substrate (right) stained for paxillin (green) and nuclei (blue). Arrowheads indicate assembled focal adhesions. Scale bars: 10 μm. (B) Plot of the mean adhesive area of InvL/E:NH cells cultured in normal medium on soft-to-stiff or stiff-to-stiff substrate (n=39 or 51, respectively). **P<0.01 for Welch's t-test comparisons. (C) Individual cell migration velocity is plotted for cells as outlined in Fig. 4A. Each point represents the average velocity of an individual cell. Cells were cultured on soft-to-stiff or stiff-to-stiff substrate in normal or high-cation medium as indicated. n=24, 12, 31 and 50 cells for each condition. **P<0.01 for Welch's t-test comparisons of velocities as a function of stiffness for each line. Soft=purple; stiff=orange.
Fig. 6.
Fig. 6.
Higher collagen organization of tumor correlates with poorer outcome for OSCC patients. (A) PicroSirius Red staining of histological sections of tumors with the indicated collagen organization. The same image was taken under polarized and non-polarized (brightfield) light (bottom and top images, respectively). Arrowheads indicate the location of selected keratin pearls. (B) Frequency of clinical TN stages I/II (purple) vs III/IV (orange) for OSCC relative to collagen organization within the tumor. Number of patients in each group were n=13 and n=16. P<0.05 for Welch's t-test comparing collagen organization and tumor stages. (C) Plotted collagen area of PicroSirius Red-stained tumor tissue of clinical TN stages I/II (purple) vs III/IV (orange) observed under polarized light. (D) Survival rate without tumor recurrence in percent of OSCC patients. Data of patients with tumors of the same TN stage but with above (dense) or below (sparse) average total collagen area were pooled. Kaplan–Meier plot of recurrence of recurrence-free survival for patients in the indicated categories on the basis of histological assessment. By using a log-rank (Mantel–Cox) test, P<0.05 was assessed and compared between dense stage III/IV and sparse stage I/II tumor tissue. n=6, 7, 6 and 10 for sparse stage I/II, dense stage I/II, sparse stage III/IV and dense stage III/IV tumor tissue, respectively. (E) Histological staining for actin and focal adhesion kinase (FAK) of representative stomal and OSCC tumor epithelium. The last three panels in each row show the magnification of the boxed area in the first panel. Dashed lines indicate the edge of each indicated feature; arrowheads indicate FAK polarization to the tumor edge. Scale bars: 20 μm.

References

    1. Acerbi I., Cassereau L., Dean I., Shi Q., Au A., Park C., Chen Y. Y., Liphardt J., Hwang E. S. and Weaver V. M. (2015). Human breast cancer invasion and aggression correlates with ECM stiffening and immune cell infiltration. Integr. Biol. 7, 1120-1134. 10.1039/C5IB00040H - DOI - PMC - PubMed
    1. Angadi P. V., Patil P. V., Angadi V., Mane D., Shekar S., Hallikerimath S., Kale A. D. and Kardesai S. G. (2016). Immunoexpression of epithelial mesenchymal transition proteins E-cadherin, β-catenin, and N-cadherin in oral squamous cell carcinoma. Int. J. Surg. Pathol. 24, 696-703. 10.1177/1066896916654763 - DOI - PubMed
    1. Bissell M. J. and Hines W. C. (2011). Why don't we get more cancer? A proposed role of the microenvironment in restraining cancer progression. Nat. Med. 17, 320-329. 10.1038/nm.2328 - DOI - PMC - PubMed
    1. Brown E. C., Cheng S., McKenzie D. K., Butler J. E., Gandevia S. C. and Bilston L. E. (2015). Tongue stiffness is lower in patients with obstructive sleep apnea during wakefulness compared with matched control subjects. Sleep 38, 537-544. 10.5665/sleep.4566 - DOI - PMC - PubMed
    1. Calvo F., Ege N., Grande-Garcia A., Hooper S., Jenkins R. P., Chaudhry S. I., Harrington K., Williamson P., Moeendarbary E., Charras G. et al. (2013). Mechanotransduction and YAP-dependent matrix remodelling is required for the generation and maintenance of cancer-associated fibroblasts. Nat. Cell Biol. 15, 637-646. 10.1038/ncb2756 - DOI - PMC - PubMed

Publication types

MeSH terms