

D-Aspartate treatment attenuates myelin damage and stimulates myelin repair
- PMID: 30559305
- PMCID: PMC6328990
- DOI: 10.15252/emmm.201809278
D-Aspartate treatment attenuates myelin damage and stimulates myelin repair
Abstract
Glutamate signaling may orchestrate oligodendrocyte precursor cell (OPC) development and myelin regeneration through the activation of glutamate receptors at OPC-neuron synapses. D-Aspartate is a D-amino acid exerting modulatory actions at glutamatergic synapses. Chronic administration of D-Aspartate has been proposed as therapeutic treatment in diseases related to myelin dysfunction and NMDA receptors hypofunction, including schizophrenia and cognitive deficits. Here, we show, by using an in vivo remyelination model, that administration of D-Aspartate during remyelination improved motor coordination, accelerated myelin recovery, and significantly increased the number of small-diameter myelinated axons. Chronically administered during demyelination, D-Aspartate also attenuated myelin loss and inflammation. Interestingly, D-Aspartate exposure stimulated OPC maturation and accelerated developmental myelination in organotypic cerebellar slices. D-Aspartate promoting effects on OPC maturation involved the activation of glutamate transporters, AMPA and NMDA receptors, and the Na+/Ca2+ exchanger NCX3. While blocking NMDA or NCX3 significantly prevented D-Aspartate-induced [Ca2+]i oscillations, blocking AMPA and glutamate transporters prevented both the initial and oscillatory [Ca2+]i response as well as D-Aspartate-induced inward currents in OPC Our findings reveal that D-Aspartate treatment may represent a novel strategy for promoting myelin recovery.
Keywords: D‐Aspartate; NCX3; cuprizone; oligodendrocytes; remyelination.
© 2018 The Authors. Published under the terms of the CC BY 4.0 license.
Figures
- A
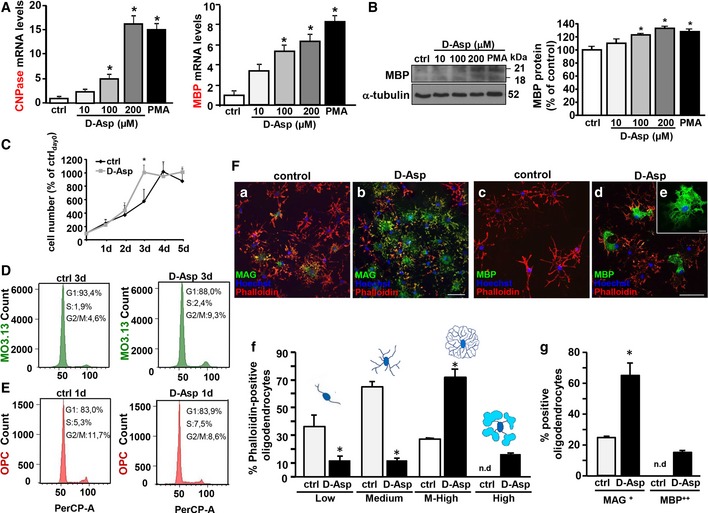
RT–PCR of CNPase (left) and MBP (right) mRNAs expression in MO3.13 precursors under control conditions and following 10–200 μM D‐Asp exposure for 3 days. Graphs show quantification of ratio of CNPase, and MBP to L19.
- B
Western blotting (left) and densitometric analysis (right) of MBP expression in the absence or in the presence of 10–200 μM D‐Asp exposure for 5 days.
- C
Cell growth analysis of human MO3.13 oligodendrocytes in the absence or in the presence of 200 μM D‐Asp for 1–5 days. The density of MO3.13 oligodendrocytes was daily recorded through trypan blue dye exclusion. Mean of daily measurements was recorded. The data of each experimental group were normalized to the density of cells plated at day 0 and expressed as percentage of ctrlday0.
- D
FACS‐based cell cycle distribution analysis after PI incorporation of MO3.13 oligodendrocytes in the absence or in the presence of 200 μM D‐Asp for 3 days. Representative FACS plots of biological replicates are shown (n = 5 independent experimental sessions).
- E
FACS‐based cell cycle distribution analysis after PI incorporation of rat primary OPC in the absence or in the presence of 100 μM D‐Asp for 1 day. Representative FACS plots of biological replicates are shown (n = 3 independent experimental sessions).
- F
Confocal microscopic images displaying the coexpression of MAG or MBP with phalloidin‐594 (a, b and c, d, respectively) in rat primary OPC cultured in the absence or in the presence of 100 μM D‐Asp for 4 days. (e) Single representative MBP++ cell. Scale bars: 50 μm in (a–d); 10 μm in (e). (f, g) Quantitative analysis of Alexa594‐phalloidin‐positive oligodendrocytes (f) or MAG+ and MBP++ oligodendrocytes (g) scored in control and D‐Asp‐exposed cells. Alexa594‐phalloidin‐positive oligodendrocytes were scored in four categories, according to their morphological complexity. In each category, data were normalized on the total number of oligodendrocytes.
- A
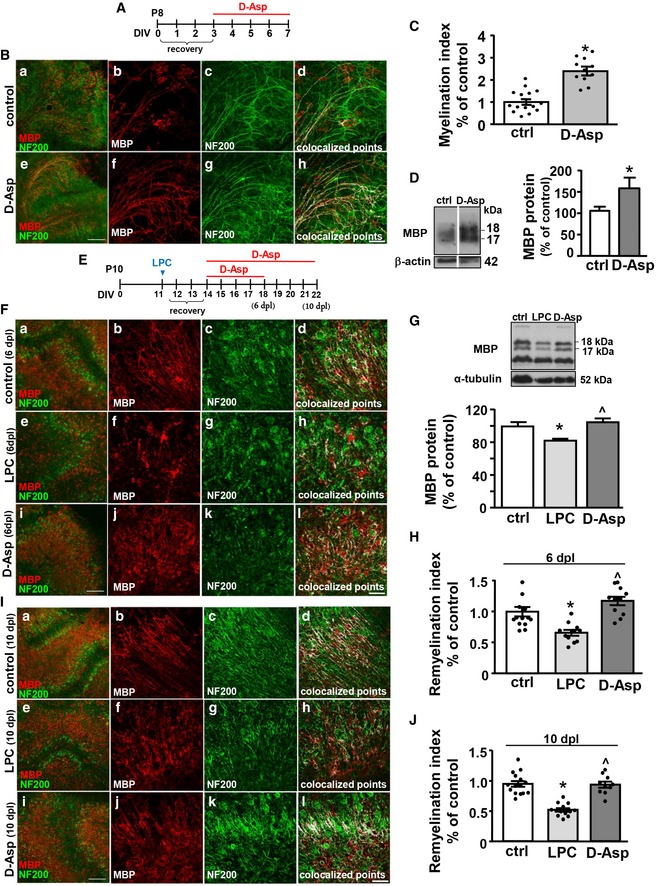
Schematic diagram showing D‐Asp exposure protocol in organotypic slices.
- B
Maximum intensity projection of z‐stack confocal images displaying MBP (red) and NF200 (green) immunoreactivities in seven DIV cerebellar organotypic slices cultured in the absence (b–d) or in the presence of 100 μM D‐Asp (f–h). Panels (d and h) display colocalized points (white). Panels (a and e) show representative low magnification images of seven DIV cerebellar slices cultured cultures in the absence (a) or in the presence of 100 μM D‐Asp (e). Scale bars in (a and e): 200 μm; in (b–d) and (f–h): 50 μm.
- C
Scatter plot histogram analysis of the myelination index in seven DIV cerebellar slices cultured in the absence or in the presence of 100 μM D‐Asp.
- D
Western blotting analysis of MBP protein levels from homogenates of organotypic cerebellar slices cultured in the absence or in the presence of 100 μM D‐Asp. Data were normalized on the basis of β‐actin and expressed as percentage of controls.
- E
Schematic diagram showing D‐Asp exposure protocol in organotypic slices after LPC exposure.
- F
Maximum intensity projection of z‐stack confocal images displaying MBP (red) and NF200 (green) immunoreactivities in control cerebellar organotypic slices (b–d), and in cerebellar slices at 6 days after LPC exposure (dpl) in the absence (f–h) or in the presence 100 μM D‐Asp (j–l). Panels (d, h, and l) display colocalized points (white). Panels (a, e, and i) show representative low magnification images of seven DIV cerebellar slices cultured cultures in the absence (a) or in the presence of 100 μM D‐Asp (e). Scale bars in (a, e, i): 200 μm; in (b–d, f–h, and j–l): 50 μm.
- G
Western blotting and quantitative analysis of MBP protein levels from homogenates of organotypic cerebellar slices at 6 dpl cultured in the absence or in the presence of 100 μM D‐Asp.
- H
Scatter plot histogram analysis of the remyelination index in cerebellar explants at 6 dpl after LPC exposure cultured in the absence or in the presence of 100 μM D‐Asp. Data were normalized to vehicle control.
- I
Maximum intensity projection of z‐stack confocal images displaying MBP (red) and NF200 (green) immunoreactivities in control cerebellar organotypic slices (b–d), and in cerebellar slices at 10 dpl in the absence (f–h) or in the presence of 100 μM D‐Asp (j–l). Panels (d, h, and l) display colocalized points (white). Panels (a, e, and i) show representative low magnification images of seven DIV cerebellar slices cultured cultures in the absence (a) or in the presence of 100 μM D‐Asp (e). Scale bars in (a, e, i): 200 μm; in (b–d, f–h, and j–l): 50 μm.
- J
Scatter plot histogram analysis of the remyelination index in cerebellar explants at 10 dpl cultured in the absence or in the presence of 100 μM D‐Asp. Data were normalized to vehicle control.
- A
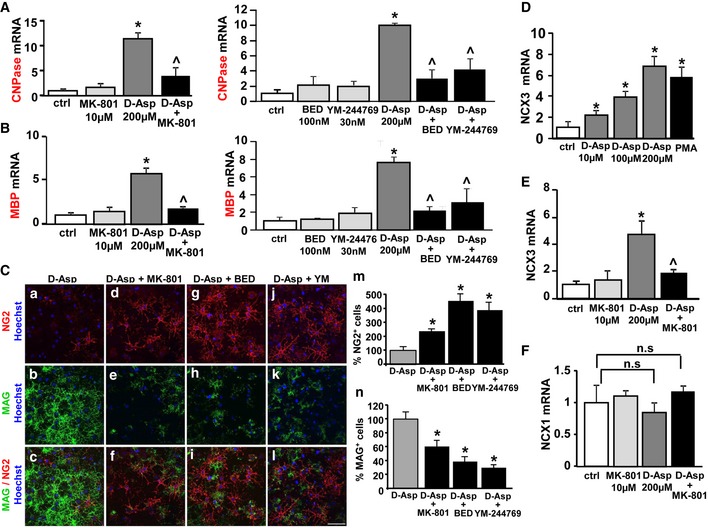
RT–PCR of CNPase mRNA expression in oligodendrocyte MO3.13 progenitors under control conditions and following 200 μM D‐Asp exposure for 3 days, in the absence or in the presence of 10 μM MK‐801 (left panel), or 30 nM YM‐244769 or 100 nM BED (right panel). Graphs show quantification of ratio of CNPase to L19.
- B
RT–PCR of MBP mRNA expression in MO3.13 cells under control conditions and following D‐Asp exposure for 3 days, in the absence or in the presence of 10 μM MK‐801 (left panel), or 30 nM YM‐244769 or 100 nM BED (right panel) Graphs show quantification of ratio of MBP to L19.
- C
(a–l) Confocal images displaying the expression of NG2 and MAG proteins in rat primary OPC cultured in the presence of D‐Asp for 3 days, in the absence (a–c) or in the presence of 10 μM MK‐801 (d–f), or 30 nM YM‐244769 (g–i) or 100 nM BED (j–l). (m, n) Quantitative analysis of NG2+ and MAG+ cells in rat primary OPC cultured in the presence of D‐Asp for 3 days, in the absence or in the presence of 10 μM MK‐801, 30 nM YM‐244769 or 100 nM BED.
- D
RT–PCR of NCX3 mRNA expression under control conditions and following 10–200 μM D‐Asp exposure or 100 nM PMA for 3 days.
- E
RT–PCR of NCX3 mRNA expression following 200 μM D‐Asp exposure, in the absence or in the presence of 10 μM MK‐801.
- F
RT–PCR of NCX1 mRNA expression following 200 μM D‐Asp exposure, in the absence or in the presence of 10 μM MK‐801. Graphs show quantification of ratio of NCX1 and NCX3 to L19.
- A, B
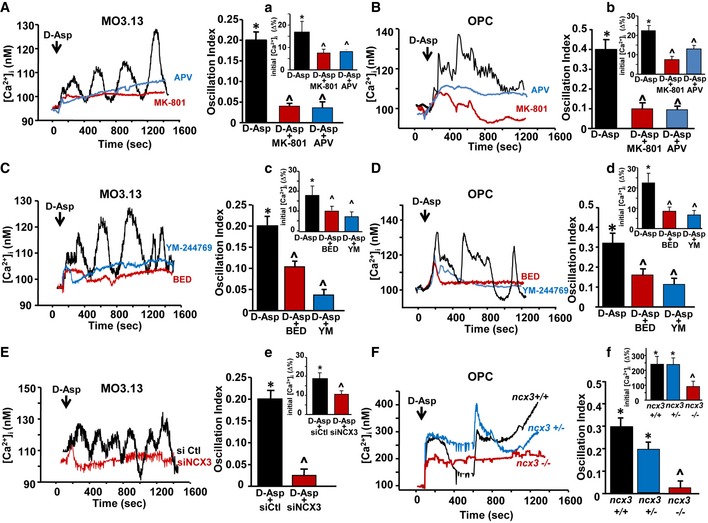
Left panels: Superimposed single‐cell traces representative of the effect of 100 μM D‐Asp on [Ca2+]i detected in MO3.13 cells (A) and primary OPC (B) in the absence or in the presence of 10 μM MK‐801 or 150 μM APV. Right panels: Quantification of the oscillation index in MO3.13 cells (A) and primary OPC (B) in the absence or in the presence of 10 μM MK‐801 or 150 μM APV. (a, b) Quantification of the initial [Ca2+]i increase elicited by D‐Asp measured as Δ% of peak versus basal values in the absence or in the presence of 10 μM MK‐801 or 150 μM APV, both in MO3.13 cells (a) and in primary OPC (b). MK‐801 and APV were preincubated 10 min before registration.
- C, D
Left panels: superimposed single‐cell traces representative of the effect of 100 μM D‐Asp on [Ca2+]i detected in MO3.13 cells (C) and primary OPC (D) in the absence or in the presence of 30 nM YM‐244769 or 100 nM BED. Right panels: quantification of the oscillation index in MO3.13 cells (C) and primary OPC (D) in the absence or in the presence of 30 nM YM‐244769 or 100 nM BED. (c, d) Quantification of the initial [Ca2+]i increase elicited by D‐Asp measured as Δ% of peak versus basal values in the absence or in the presence of 30 nM YM‐244769 or 100 nM BED, both in MO3.13 cells (c) and in primary OPC (d). YM‐244769 or BED was preincubated 10 min before registration.
- E
Left: Superimposed single‐cell traces representative of the effect of 100 μM D‐Asp on [Ca2+]i detected in MO3.13 cells in the presence of siCtl or sincx3 silencing. Right: Quantification of the oscillation index in MO3.13 cells in the absence or in the presence of sincx3. (e) Quantification of the initial [Ca2+]i increase elicited by D‐Asp and measured as Δ% of peak versus basal values in the absence or in the presence of sincx3.
- F
Left: Superimposed single‐cell traces representative of the effect of 100 μM D‐Asp on [Ca2+]i detected in primary OPC obtained from wild‐type ncx3 +/+, heterozygous ncx3 +/− , and knockout ncx3 −/− mice. Right: Quantification of the oscillation index elicited by D‐Asp in primary mouse OPC obtained from ncx3 +/+, ncx3 +/−, and ncx3 −/− mice. (f) Quantification of the initial [Ca2+]i increase measured as Δ% of peak versus basal values.
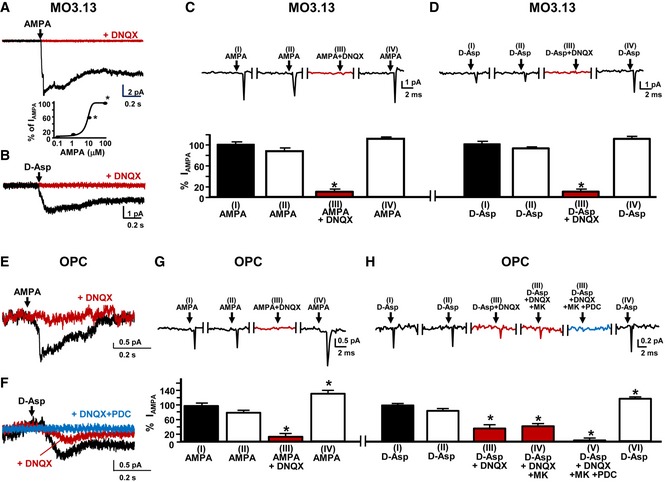
- A
Representative inward current traces elicited by 10 μM AMPA in human oligodendrocyte MO3.13 progenitor cells in the absence or in the presence of 10 μM DNQX. The concentration‐dependent curve of AMPA (1–100 μM) on inward currents is showed at the bottom.
- B
Representative inward current traces elicited by 100 μM D‐Asp application in MO3.13 cells in the absence or in the presence of 10 μM DNQX.
- C
Representative traces of the inward current (upper panel) and the corresponding quantification (bottom panel) observed in human oligodendrocyte MO3.13 progenitors after: (I) the first application of 10 μM AMPA alone; (II) the second application of 10 μM AMPA alone; (III) the third application of 10 μM AMPA in the presence of 10 μM DNQX; and (IV) the fourth application of 10 μM AMPA alone. Data are expressed as percentage of control.
- D
Representative traces of the inward current (upper panel) and the corresponding quantification (bottom panel) observed in human oligodendrocyte MO3.13 progenitors after: (I) the first application of 100 μM D‐Asp alone; (II) the second application of 100 μM D‐Asp alone; (III) the third application of 100 μM D‐Asp in the presence of 10 μM DNQX; and (IV) the fourth application of 100 μM D‐Asp alone. Data are expressed as percentage of control.
- E
Representative inward current traces elicited by 10 μM AMPA in rat primary OPC in the absence or in the presence of 10 μM DNQX.
- F
Representative inward current traces elicited by 100 μM D‐Asp in rat primary OPC in the absence or in the presence of 10 μM DNQX or 10 μM DNQX + 20 μM PDC.
- G
Representative traces of the inward current (upper panel) and the corresponding quantification (lower panel) observed in rat primary OPC after: (I) the first application of 10 μM AMPA alone; (II) the second application of 10 μM AMPA alone; (III) the third application of 10 μM AMPA in the presence of 10 μM DNQX; and (IV) the fourth application of 10 μM AMPA alone. Data are expressed as percentage of control.
- H
Representative traces of the inward current (upper panel) and the corresponding quantification (lower panel) observed in rat primary OPC after: (I) the first application of 100 μM D‐Asp alone; (II) the second application of 100 μM D‐Asp alone; (III) the third application of 100 μM D‐Asp in the presence of 10 μM DNQX; (IV) the fourth application of 100 μM D‐Asp in the presence of 10 μM DNQX + 10 μM MK801; (V) the fifth application of 100 μM D‐Asp in the presence of 10 μM DNQX + 10 μM MK‐801 + 20 μM PDC; and (VI) the sixth application of 100 μM D‐Asp alone. Data are expressed as percentage of control.
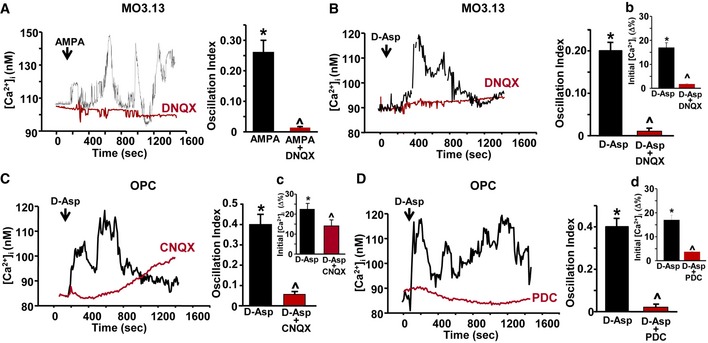
- A
Left: Superimposed single‐cell traces representative of the effect of 10 μM AMPA on [Ca2+]i detected in MO3.13 cells in the absence or in the presence of 10 μM DNQX. Right: Quantification of the oscillation index in MO3.13 cells after 10 μM AMPA exposure in the absence or in the presence of 10 μM DNQX.
- B
Left: Superimposed single‐cell traces representative of the effect of 100 μM D‐Asp on [Ca2+]i detected in MO3.13 cells in the absence or in the presence of 10 μM DNQX. Right: Quantification of the oscillation index in MO3.13 progenitors after 100 μM D‐Asp exposure in the absence or in the presence of 10 μM DNQX. (b) Quantification of the initial [Ca2+]i increase elicited by D‐Asp in M03.13 cells measured as Δ% of peak versus basal values in the absence or in the presence of 10 μM DNQX.
- C
Left: Superimposed single‐cell traces representative of the effect of 100 μM D‐Asp on [Ca2+]i detected in OPC in the absence or in the presence of 25 μM CNQX. CNQX was preincubated 5 min before registration. Right: Quantification of the oscillation index in OPC after 100 μM D‐Asp exposure in the absence or in the presence of 25 μM CNQX. (c) Quantification of the initial [Ca2+]i increase elicited by D‐Asp in OPC measured as Δ% of peak versus basal values in the absence or in the presence of 25 μM CNQX.
- D
Left: Superimposed single‐cell traces representative of the effect of 100 μM D‐Asp on [Ca2+]i detected in OPC in the absence or in the presence of 20 μM L‐trans‐pyrrolidine‐2,4‐dicarboxylic acid (PDC). PDC was preincubated 5 min before registration. Right: Quantification of the oscillation index in OPC after 100 μM D‐Asp exposure in the absence or in the presence of 20 μM PDC. (d) Quantification of the initial [Ca2+]i increase elicited by D‐Asp in OPC measured as Δ% of peak versus basal values in the absence or in the presence of 20 μM PDC.
- A
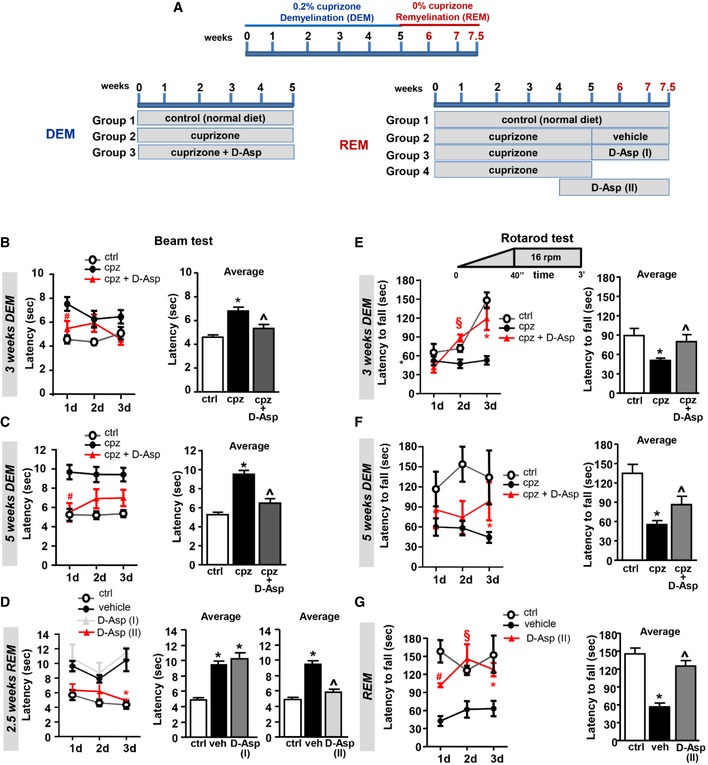
Schematic representation of the administration protocols for D‐Asp treatment in mice. Cuprizone was administered for weeks 1–5 (blue) to induce demyelination (DEM) in the corpus callosum. Then, mice returned to normal diet for weeks 6–7.5 (red), allowing recovery and remyelination (REM). D‐Asp (20 mM in drinking solution) was given to the mice for 5 weeks concomitantly the cuprizone treatment (DEM); D‐Asp treatment was initiated after cuprizone withdrawal and maintained for additional 2.5 weeks (D‐Asp I); D‐Asp treatment was initiated 1 week before cuprizone withdrawal and maintained for additional 2.5 weeks (D‐Asp II).
- B, C
Beam crossing latency during daily training (left panel, averaged across three trials per day) and average latency to cross the beam over 3 consecutive days (right panel), recorded in control (open circles), cuprizone‐ (filled black circles), and cuprizone + D‐Asp‐treated mice (filled red triangles) during 3 weeks (B) and 5 weeks (C) of cuprizone feeding.
- D
Beam crossing latency during daily training (left panel, averaged across three trials per day) and average latency to cross the beam over 3 consecutive days (middle and right panels) recorded after 2.5 weeks of remyelination in control (open circles), vehicle‐ (filled black circles), and D‐Asp‐treated mice. D‐Asp (I) (filled gray triangles) refers to the group of mice which received D‐Asp only for 2.5 weeks after cuprizone withdrawal; D‐Asp (II) (filled red triangles) refers to the group of mice which received D‐Asp during the last week of cuprizone feeding and for 2.5 additional weeks after cuprizone withdrawal.
- E, F
Latency to fall during daily training in accelerating rotarod test (left panel, averaged across three trials per day) and average over 3 consecutive days (right panel) recorded in control (open circles), cuprizone‐ (filled black circles), and D‐Asp‐treated (filled red triangles) mice at 3 weeks (E) and 5 weeks (F) of cuprizone feeding.
- G
Latency to fall during daily training in accelerating rotarod test (left panel, averaged across three trials per day) and average over 3 consecutive days (right panel) recorded after 2.5 weeks of remyelination (REM) in control, vehicle‐, and D‐Asp‐treated mice. D‐Asp (II) refers to the group of mice which received D‐Asp during the last week of cuprizone feeding and 2.5 additional weeks after cuprizone withdrawal.
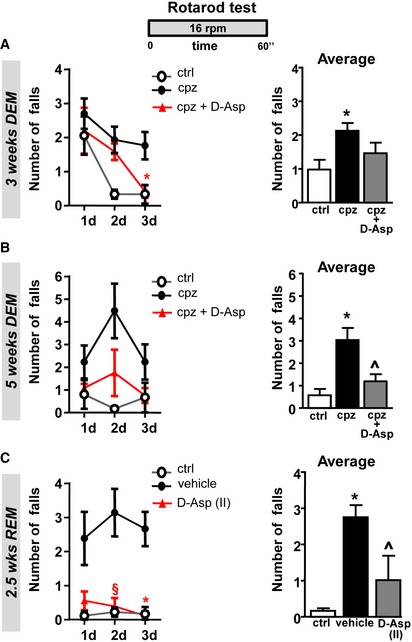
- A, B
Number of falls during daily training in fixed‐speed rotarod test (left panel, averaged across three trials per day) and average of falls over 3 consecutive days (right panel) recorded in control (open circles), cuprizone‐ (filled black circles), and D‐Asp‐treated (filled red triangles) mice at 3 weeks (A) and 5 weeks (B) of cuprizone feeding.
- C
Number of falls during daily training in fixed‐speed rotarod test (left panel, averaged across three trials per day) and average of falls over 3 consecutive days (right panel) recorded after 2.5 weeks of remyelination in control (open circles), cuprizone‐ (filled black circles), and D‐Asp‐treated mice. D‐Asp (II) (filled red triangles) refers to the group of mice which received D‐Asp during the last week of cuprizone feeding and for 2.5 additional weeks after cuprizone withdrawal. DEM, demyelination; REM, remyelination.
- A
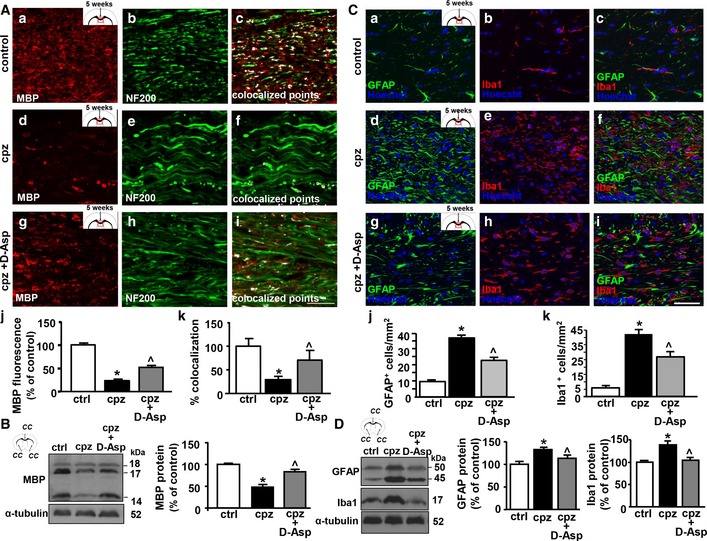
Representative confocal double immunofluorescence images displaying MBP (red) and NF200 (green) distribution and their coexpression (white) in the middle corpus callosum of septostriatal sections of control mice (a–c), and of mice fed with cuprizone for 5 weeks in the absence (d–f) or in the presence of D‐Asp (g–i). Scale bars in (a–i): 20 μm. (j), Densitometric analysis of MBP immunofluorescence signal and (k) quantification of MBP‐NF200 colocalized points in the middle corpus callosum of septostriatal sections from control mice, and from mice fed with cuprizone for 5 weeks in the absence or in the presence of D‐Asp.
- B
Western blot and densitometric analysis of MBP levels in corpus callosum lysates from control and cuprizone‐treated mice for 5 weeks in the absence or in the presence of D‐Asp, respectively. Data were normalized on the basis of α‐tubulin and expressed as percentage of controls.
- C
Representative confocal double immunofluorescence images displaying GFAP (green) and Iba1 (red) distribution in the middle corpus callosum of septostriatal sections of control mice (a–c) and of mice fed with cuprizone for 5 weeks in the absence (d–f) or in the presence of D‐Asp (g–i). Scale bars in (a–i): 50 μm. (j, k) Quantification of GFAP+ and Iba1+ cells in the middle corpus callosum of septostriatal sections of control mice and of mice fed with cuprizone for 5 weeks in the absence or in the presence of D‐Asp. Data were normalized to the total cell number (Hoechst signal) and expressed as percentage of controls.
- D
Western blot (left panel) and densitometric analyses (middle and right panels) of GFAP and Iba1 protein levels in corpus callosum lysates obtained from control or cuprizone‐treated mice for 5 weeks in the absence or in the presence of D‐Asp.
- A
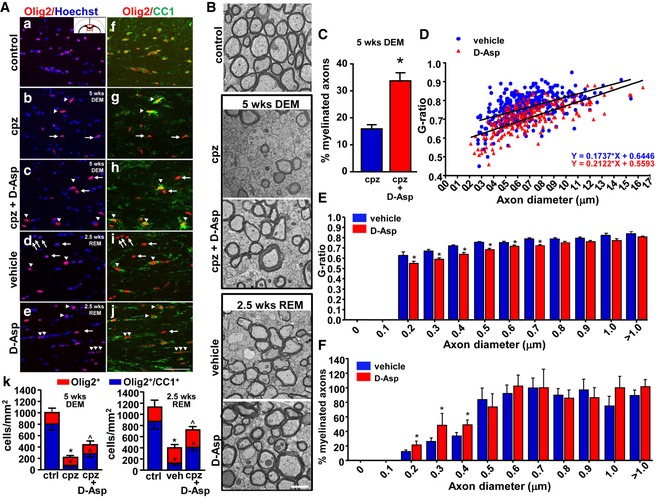
Confocal double immunofluorescence images depicting Olig2+ (a–e) and Olig2+‐CC1+ (f–j) double‐labeled cells in the middle corpus callosum of control, cuprizone‐treated mice at 5 weeks, in the absence (cpz) or in the presence of D‐Asp (cpz + D‐Asp), and 2.5 weeks after cuprizone withdrawal, in the absence (vehicle) or in the presence of D‐Asp (D‐Asp). (k, left panel), Quantitative analysis of Olig2+ cells (red) and Olig2+‐CC1+ (blue) double‐labeled cells in the middle corpus callosum of control, cuprizone‐treated mice, and cuprizone+D‐Asp‐treated mice at 5 weeks. (k, right panel), Quantitative analysis of Olig2+ cells (red) and Olig2+‐CC1+ (blue) double‐labeled cells in the middle corpus callosum of control, vehicle, and D‐Asp‐treated mice 2.5 weeks after cuprizone withdrawal. Arrows point to Olig2+‐CC1+ cells. Arrowheads point to Olig2+‐CC1+ cells. Scale bar in a–j: 50 μm.
- B
Representative electron microscopy images of middle corpus callosum sections from control mice (control), from cuprizone‐treated mice for 5 weeks in the absence (cpz) or in the presence of D‐Asp (cpz+D‐Asp), and from mice 2.5 weeks after cuprizone withdrawal in the absence (vehicle) or in the presence of D‐Asp (D‐Asp). Scale bars: 1 μm.
- C
Percentage of myelinated axons in the middle corpus callosum of cuprizone (blue) and cuprizone + D‐Asp‐treated mice (red) for 5 weeks.
- D
Scatter plot analysis of myelin thickness, expressed as individual G‐ratios against axon diameters, after 2.5 weeks of cuprizone withdrawal in the middle corpus callosum of vehicle (blue circle) or D‐Asp‐treated mice (red triangle). Linear regression was used to indicate the differences between the groups in myelin thickness across the range of axon diameters.
- E
Histogram analysis displaying the G‐ratio values of myelinated fibers across the range of axon diameters. Data represent the mean ± SEM for at least 100 axons from each group.
- F
Percentage of myelinated axons after 2.5 weeks of cuprizone withdrawal in the middle corpus callosum of vehicle (blue) or D‐Asp‐treated mice (red). DEM, demyelination; REM, remyelination.
References
-
- Bergles DE, Roberts JD, Somogyi P, Jahr CE (2000) Glutamatergic synapses on oligodendrocyte precursor cells in the hippocampus. Nature 405: 187–191 - PubMed
-
- Boscia F, Annunziato L, Taglialatela M (2006) Retigabine and flupirtine exert neuroprotective actions in organotypic hippocampal cultures. Neuropharmacology 51: 283–294 - PubMed
-
- Boscia F, Ferraguti F, Moroni F, Annunziato L, Pellegrini‐Giampietro DE (2008) mGlu1alpha receptors are co‐expressed with CB1 receptors in a subset of interneurons in the CA1 region of organotypic hippocampal slice cultures and adult rat brain. Neuropharmacology 55: 428–439 - PubMed
Publication types
MeSH terms
Substances
LinkOut - more resources
Full Text Sources
Miscellaneous
