. 2018 Dec 17;9(1):5342.
doi: 10.1038/s41467-018-07718-5.

Myopathy associated BAG3 mutations lead to protein aggregation by stalling Hsp70 networks

Affiliations

Myopathy associated BAG3 mutations lead to protein aggregation by stalling Hsp70 networks

Melanie Meister-Broekema et al. Nat Commun. .

Abstract

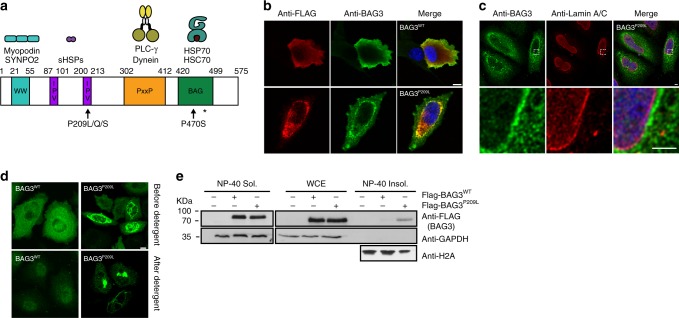
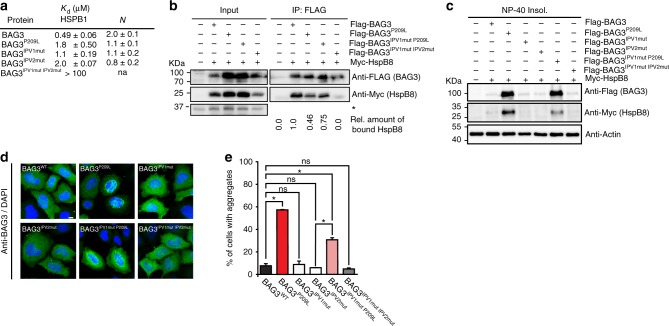
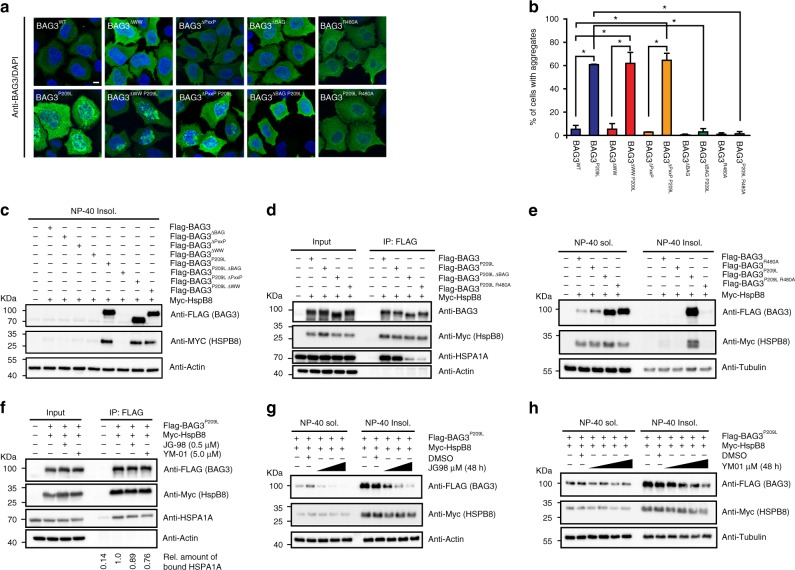
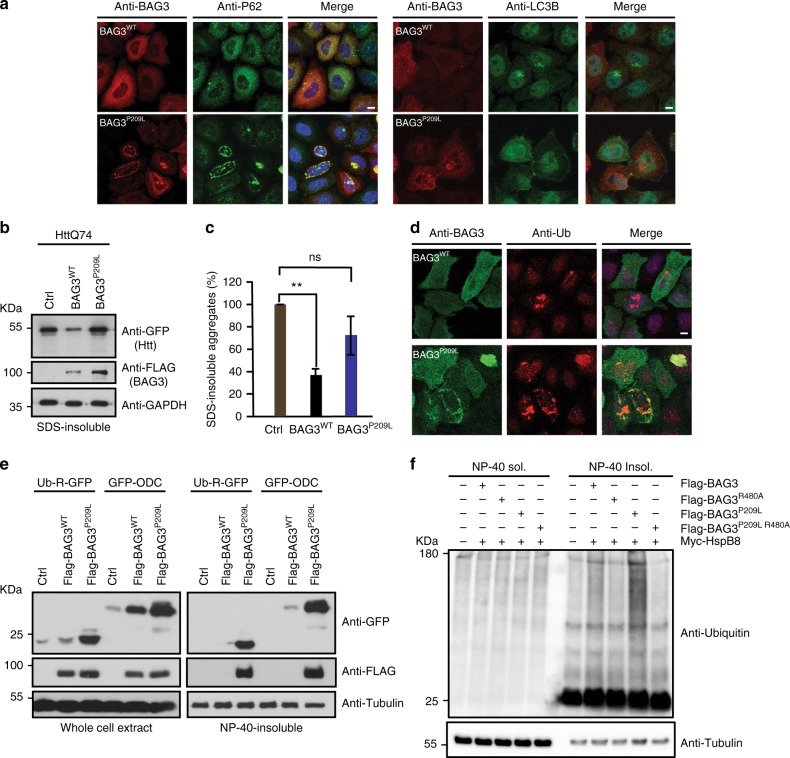
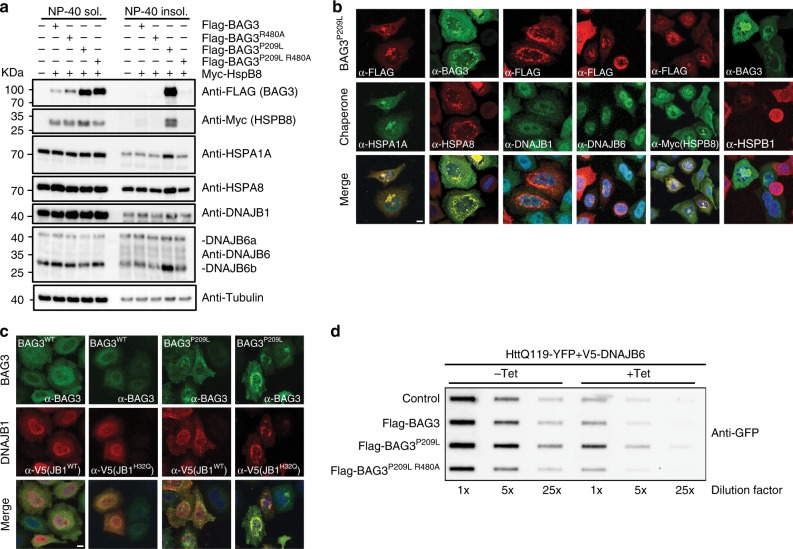
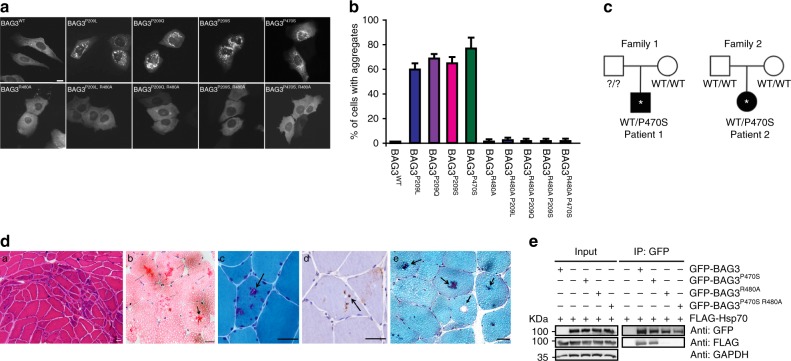
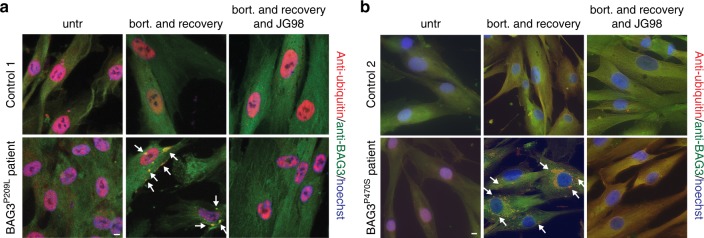
BAG3 is a multi-domain hub that connects two classes of chaperones, small heat shock proteins (sHSPs) via two isoleucine-proline-valine (IPV) motifs and Hsp70 via a BAG domain. Mutations in either the IPV or BAG domain of BAG3 cause a dominant form of myopathy, characterized by protein aggregation in both skeletal and cardiac muscle tissues. Surprisingly, for both disease mutants, impaired chaperone binding is not sufficient to explain disease phenotypes. Recombinant mutants are correctly folded, show unaffected Hsp70 binding but are impaired in stimulating Hsp70-dependent client processing. As a consequence, the mutant BAG3 proteins become the node for a dominant gain of function causing aggregation of itself, Hsp70, Hsp70 clients and tiered interactors within the BAG3 interactome. Importantly, genetic and pharmaceutical interference with Hsp70 binding completely reverses stress-induced protein aggregation for both BAG3 mutations. Thus, the gain of function effects of BAG3 mutants act as Achilles heel of the HSP70 machinery.


Conflict of interest statement

The authors declare no competing interest.

Figures

Fig. 1
Fig. 1
Cytoplasmic protein aggregation by BAG3P209L. a Schematic representation of BAG3 depicting the WW domain, the IPV motifs, the PxxP domain and the BAG domain. The disease-causing mutations P209L, P209Q, and P209S, and p470S are indicated with an arrow. The Hsp70-interaction disrupting mutation R480A is indicated with an *. b Immunofluorescence pictures of myoblast expressing FLAG-BAG3WT or FLAG-BAG3P209L, using BAG3 (green) or FLAG (red) antibodies. DAPI staining is shown in blue. Scale bar = 5 μm. c Immunofluorescence pictures of HeLa cells expressing FLAG-BAG3P209L using antibodies against BAG3 (green) and Lamin A/C (red). DAPI staining is shown in blue. Scale bar = 5 μm. d Immunofluorescence pictures of FLAG-BAG3WT and FLAG-BAG3P209L expressing HeLa cells using BAG3 antibody (green) before and after detergent treatment prior to fixation. Scale bar = 5 μm. e Whole cell extracts (WCE) and NP-40 soluble and insoluble fractions of HEK293 cells expressing indicated FLAG-BAG3 variants. Western blot against the indicated antibodies is shown. Source data are provided as a Source data file
Fig. 2
Fig. 2
Protein aggregation by BAG3P209L is not caused by a loss of HSPB binding. a Binding of BAG3 to HSPB1c (Hsp27c) is partially disrupted by P209L. Binding affinity and estimated stoichiometry were measured by ITC. Results are the average of at least three independent experiments and error is standard deviation (SD). b Immunoprecipitation from HEK293 cells expressing FLAG-BAG3WT or mutant variants using anti-FLAG beads. Western blots for FLAG (BAG3) and MYC (HSPB8) is shown. * indicates a cross-reactive band used as loading control. c NP-40 insoluble fraction of HEK293 cells expressing indicated FLAG-BAG3 variants. Western blot against the indicated antibodies is shown. The soluble fraction can be found in supplemental figure S2B. d Immunofluorescence pictures of HeLa cells expressing FLAG-BAG3WT or indicated mutants, using a BAG3 antibody (green). Scale bar = 5 μm. e Quantification of the percentage of cells with BAG3 aggregates expressing the indicated variants of BAG3. Data represent the mean and standard deviation of two independent experiments (at least 100 cells were counted per experiment, Welch t-test was used to calculate the P values, * indicates P value < 0.05 and ns is not significant). Source data are provided as a Source data file
Fig. 3
Fig. 3
BAG3P209L forms soluble oligomers. a Replacing proline for leucine at residue 209 is predicted to increase local beta-sheet content. PepFold was used to estimate propensity to form secondary structure. b Solutions containing recombinant BAG3wt or BAG3P209L were stained with SYPRO orange and fluorescence was measured. Results are the average of at least three independent experiments performed in triplicate each. Error bars represent SD. c Recombinant BAG3wt or BAG3P209L solutions were labeled by the beta-sheet dye, thioflavin T. Results are the average of at least three independent experiments performed in triplicate each. Error bars represent SD. d BAG3P209L does not have gross changes in secondary structure, as estimated from CD measurements. Results are representative of measurements performed in triplicate. e BAG3wt or BAG3P209L solutions were subjected to partial proteolysis with either chymotrypsin or trypsin and samples were loaded on SDS–PAGE for separation. Coomassie stained gels are shown. f Fractionation of HEK293 cells expressing FLAG-BAG3wt or FLAG-BAG3P209L over a sucrose gradient. Western blot against BAG3 and GAPDH is shown. Source data are provided as a Source data file
Fig. 4
Fig. 4
BAG3P209L fails to collaborate with Hsp70 in client refolding. a Recombinant BAG3P209L and BAG3wt have normal affinity to HSPA8NBD. b All of the BAG3 variants are capable of releasing fluorescent nucleotide from Hsc70/HSPA9. Results are the average of at least three experiments performed in triplicate. Error bars represent SD. See the methods for details. c, d Recombinant BAG3P209L is not functional in promoting HSPA8 steady state ATP hydrolysis (c) and Hsp70-mediated refolding assays (d). Measurement of ATPase activity and denatured luciferase refolding was carried out in the presence of Hsc70, DnaJA2, and various concentrations of BAG3WT or BAG3P209L. Results are the average of at least three independent experiments performed in triplicate each. Error bars represent SD. e luciferase folding capacity of HEK293 cells expressing HSPB8 and BAG3WT or indicated mutants of BAG3. Data represents the mean and standard deviation of two independent experiments (with three technical repeats for each experiment, Welch t test was used to calculate the P values, ** indicates P < 0.01). f Noncanonical interaction of BAG3P209L with LVEAVY amyloid peptide. Source data are provided as a Source data file
Fig. 5
Fig. 5
BAG3P209L aggregation requires an interaction with Hsp70. a Immunofluorescence images of HeLa cells expressing FLAG-BAG3wt and indicated mutants using an antibody recognizing BAG3 (green). Scale bar = 5 μm. b Quantification of the fraction of HeLa cells expressing the indicated BAG3 variants with immunofluorescence detectable punctae (2 experiments, at least 100 cells were counted per experiment, error bars represent SD, Welch t test was used to calculate the P values, * indicates P < 0.05). c Western blot of the NP-40 insoluble fraction of HEK293 cells expressing BAG3wt and indicated variants of BAG3. d Immunoprecipitation of FLAG-BAG3 variants from HEK293 cells expressing both Myc-HSPB8 and indicated FLAG-BAG3 variants. Western blots using the indicated antibodies is shown. e Western blot of NP-40 soluble and insoluble fractions of HEK293 cells expressing indicated BAG3 variants; FLAG (BAG3), Myc (HSPB8), and tubulin antibodies were used. f Western blot of immunoprecipitates using anti FLAG beads from HEK293 cells expressing both FLAG-BAG3P209L and Myc-HSPB8 in cells treated with either 0.5 μM JG-98, 5μM YM-01 or DMSO; FLAG (BAG3), Myc (HSPB8), HSPA1A, and actin antibodies were used. g, h Western blot of NP-40 soluble and insoluble fractions of HEK293 cells expressing both FLAG-BAG3P209L and Myc-HSPB8, treated with DMSO or increasing concentration of the drug JG-98 (0.25, 0.5, or 1.0 µM) (g) or YM-01 (1.25, 2.5, 5.0, or 10 µM) (h). Source data are provided as a Source data file
Fig. 6
Fig. 6
BAG3P209L aggregation leads to co-aggregation of proteasomal substrates. a Immunofluorescence pictures of HeLa cells expressing FLAG-BAG3WT or FLAG-BAG3P209L using antibodies against BAG3 (green) or ubiquitin (red). Scale bar = 5 μm. b Suppression of GFP-HttQ74 aggregation of cells expressing a control, FLAG-BAG3WT or FLAG-BAG3P209L. Western blot against indicated antibodies is shown. c Quantification of GFP-HttQ74 aggregation of experiments similar to b. Relative percentage of SDS-insoluble protein levels are shown. Data represents the mean and standard deviation of three independent experiments. d Immunofluorescence pictures of HeLa cells expressing FLAG-BAG3WT or FLAG-BAG3P209L using antibodies against BAG3 (green) or ubiquitin (red). Left column BAG3, middle column ubiquitin and right column is the merge of BAG3 (green), ubiquitin (red), and DAPI (blue). Scale bar = 5 μm. e Fractionation of HEK293 cells expressing HSPB8, a control or BAG3WT or BAG3P209L, together with either Ub-R-GFP or GFP-ODC (ornithine decarboxylase). Western blot against GFP, FLAG (BAG3), Myc (HSPB8), and tubulin are shown. f Fractionation of HEK293 cells expressing HSPB8 and indicated BAG3 variants. Western blot using ubiquitin (FK2) and tubulin antibodies are shown. The same samples as in Fig. 5e have been used, loading control is therefore the same. Source data are provided as a Source data file
Fig. 7
Fig. 7
PQC proteins co-aggregate with BAG3P209L. a Fractionation of HEK293 cells expressing Myc-HSPB8 and BAG3 variants. Western blots using the indicated antibodies is shown. The same samples as in Fig. 5e have been used, loading control is therefore the same. b Immunofluorescence pictures of HeLa cells expressing FLAG-BAG3P209L. Cells were stained with the indicated antibodies for staining endogenous chaperones except HSPB8 (which was stained using antibodies against myc after expression of myc-HSPB8). Scale bar = 5 μm. c Immunofluorescence pictures of HeLa cells expressing BAG3WT or BAG3P209L (upper row in green) with V5-DNAJB1WT or V5-DNAJB1H32Q (middle row in red). Lower row depicts the merge with DAPI. Scale bar = 5 μm. d Filter trap assay of HEK293 cells expressing HttQ119-YFP together with tetracyclin-inducible DNAJB6b and the indicated FLAG-BAG3 variants. Immunoblot using a GFP antibody is shown. Source data are provided as a Source data file
Fig. 8
Fig. 8
MFM-causing BAG-domain mutations also cause HSP70-dependent aggregation. a Immunofluorescence pictures of HeLa cells expressing the indicated BAG3-disease causing mutants, with or without the additional R480A mutation that abrogates the ability of the (mutant) BAG3s to interact with Hsp70. Scale bar = 5 μm. b Analyses of the number of cells expressing the indicated BAG3-disease causing mutants (with or without the additional R480A mutation that abrogates their ability BAG3s to interact with Hsp70) that contain over 20 punctae. The increase in cells with punctae in the single mutant backgrounds and their abrogation in the double mutant backgrounds are significant with a P value of <0.00005 (t test). c Pedigree structures and known genotype of the proband (*) and parents in Family 1 and Family 2 with a P470S mutation in the BAG-domain. d Histochemical and immunohistochemical analysis of muscle biopsies from two novel MFM patients carrying a P470S mutation in the BAG domain of BAG3: Patient 1 (ac) and Patient 2 (d, e) (see Fig. S6B, C for further patient info); a hematoxylin and eosin (H&E) staining demonstrates region of grouped atrophy with small fibers harboring vacuoles; b modified gomori trichrome (GT) staining demonstrating both cytoplasmic inclusion and rimmed vacuoles; c immunohistochemistry with an antibody to TDP-43 demonstrates protein accumulation; d H&E staining shows large centrally located eosinophilic inclusion; e GT staining shows dark centrally located inclusions and a fiber with a centrally located vacuole. Arrows denote protein inclusions or vacuoles. Scale bar = 50 μm. e Immunoprecipitation of GFP-tagged BAG3 variants from cells expressing both GFP-BAG3 variants and FLAG-tagged HSP70. Western blots using the indicated antibodies is shown. Source data are provided as a Source data file
Fig. 9
Fig. 9
Abrogation of BAG3–Hsp70 by pharmaceutical intervention. a, b Immunofluorescence pictures using BAG3 (green) and ubiquitin (FK2; red) antibodies of primary control versus BAG3P209L patient fibroblasts (a) or primary control versus BAG3P470S patient fibroblasts (b). Cells were either untreated, treated for 6 h with bortezomib followed by a 20 h recovery or treated for 6 h with bortezomib followed by a 20 h recovery in the presence of 0.05 µM JG98. Arrows indicate BAG3-punctae. Scale bar = 5 μm. Source data are provided as a Source data file

References

    1. Stürner E, Behl C. The role of the multifunctional BAG3 protein in cellular protein quality control and in disease. Front. Mol. Neurosci. 2017;10:177. doi: 10.3389/fnmol.2017.00177. - DOI - PMC - PubMed
    1. Xu Z, et al. 14-3-3 protein targets misfolded chaperone-associated proteins to aggresomes. J. Cell. Sci. 2013;126:4173–4186. doi: 10.1242/jcs.126102. - DOI - PMC - PubMed
    1. Jia, B., Wu, Y. & Zhou, Y. 14-3-3 and aggresome formation: implications in neurodegenerative diseases. Prion8, 173–177 (2014). - PMC - PubMed
    1. Carra S, Seguin SJ, Lambert H, Landry J. HspB8 chaperone activity toward poly(Q)-containing proteins depends on its association with Bag3, a stimulator of macroautophagy. J. Biol. Chem. 2008;283:1437–1444. doi: 10.1074/jbc.M706304200. - DOI - PubMed
    1. Kampinga, H. H. & Bergink, S. Heat shock proteins as potential targets for protective strategies in neurodegeneration. Lancet Neurol.15, 748–759 (2016) - PubMed

Publication types

MeSH terms

Substances