. 2018 Dec 17;9(1):5343.
doi: 10.1038/s41467-018-07741-6.

Lysosomal protease deficiency or substrate overload induces an oxidative-stress mediated STAT3-dependent pathway of lysosomal homeostasis

Affiliations

Lysosomal protease deficiency or substrate overload induces an oxidative-stress mediated STAT3-dependent pathway of lysosomal homeostasis

Jonathan Martínez-Fábregas et al. Nat Commun. .

Abstract

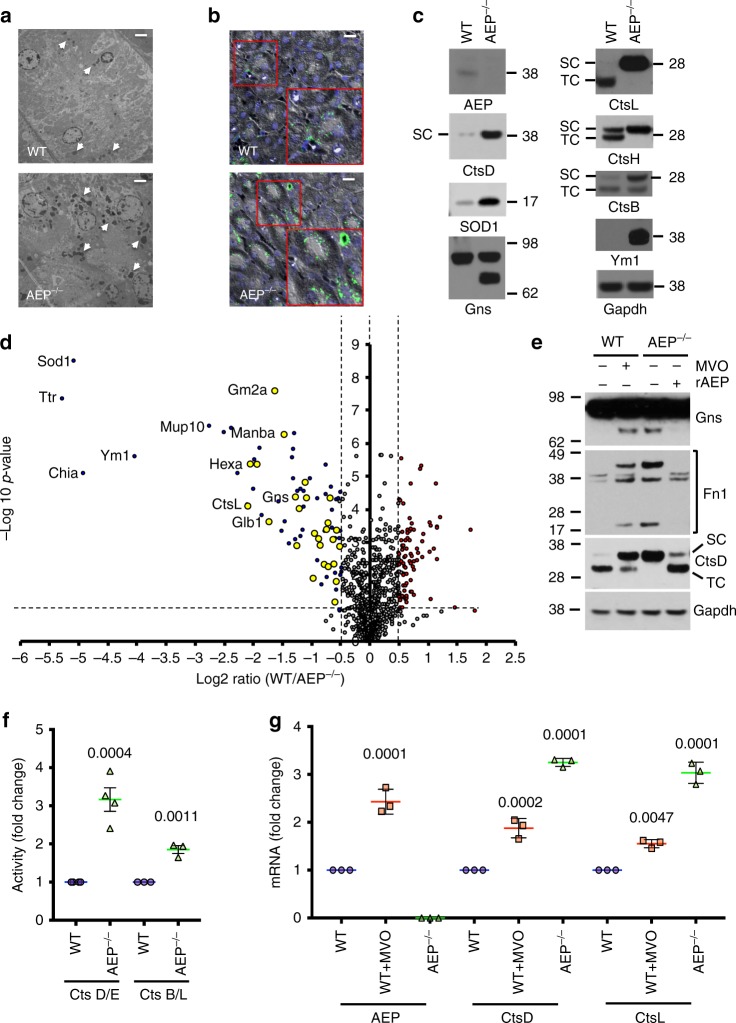
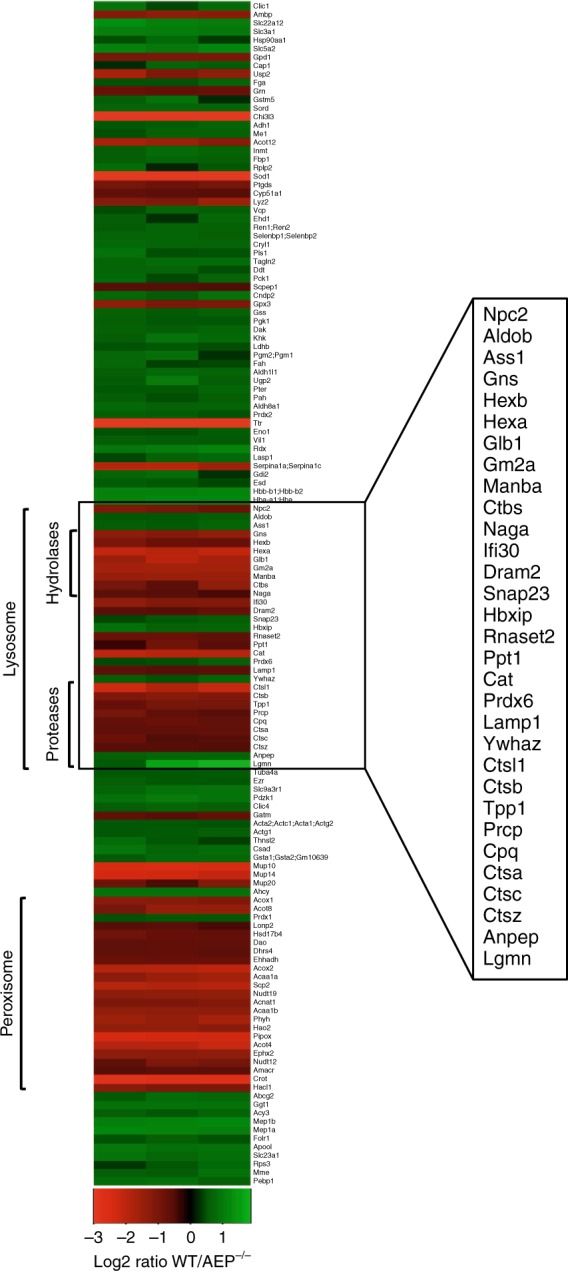
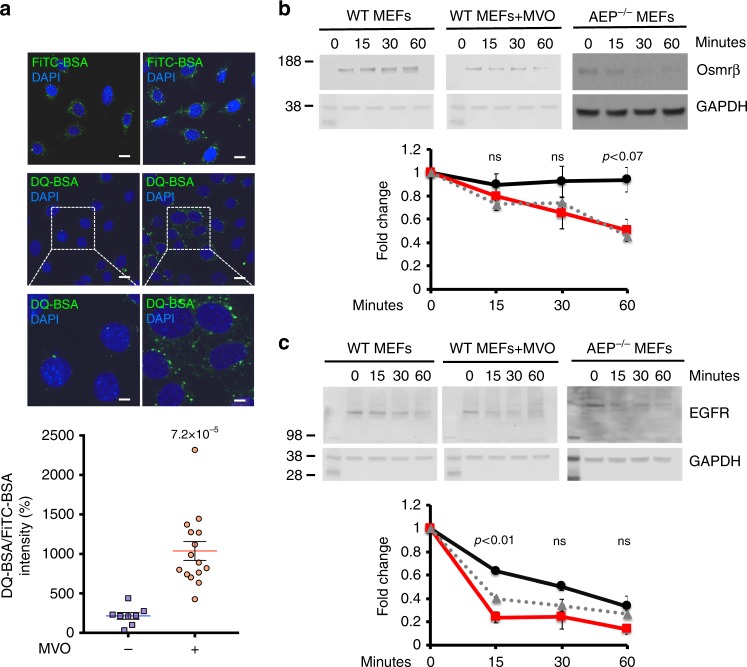
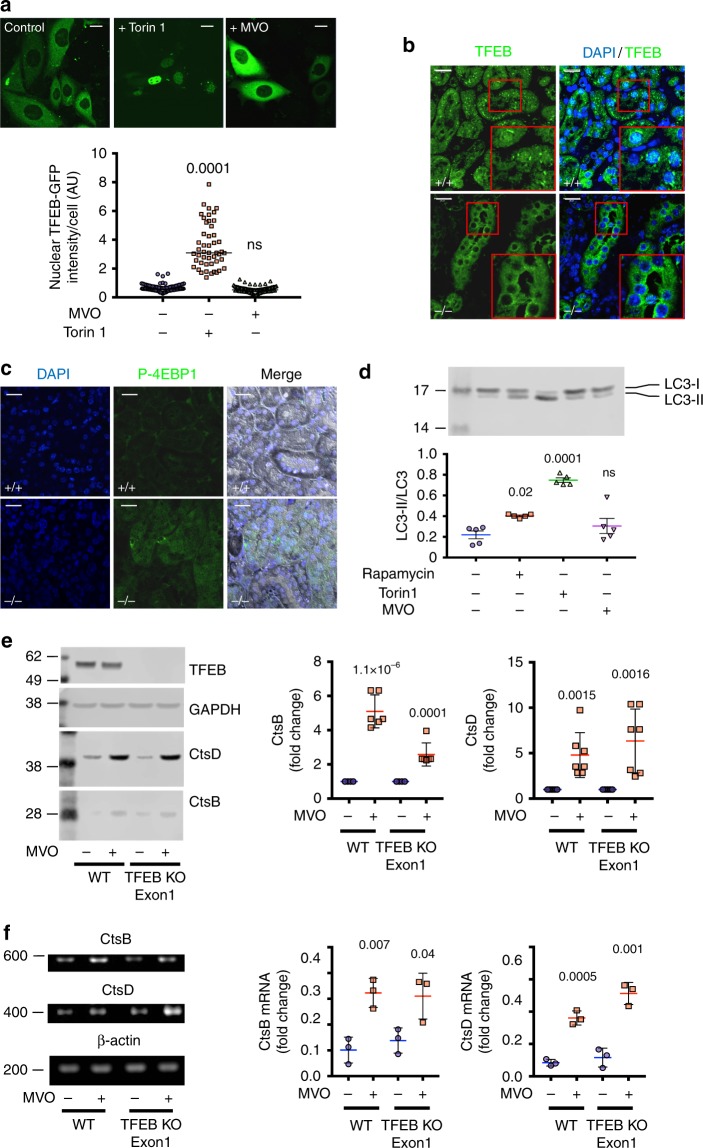
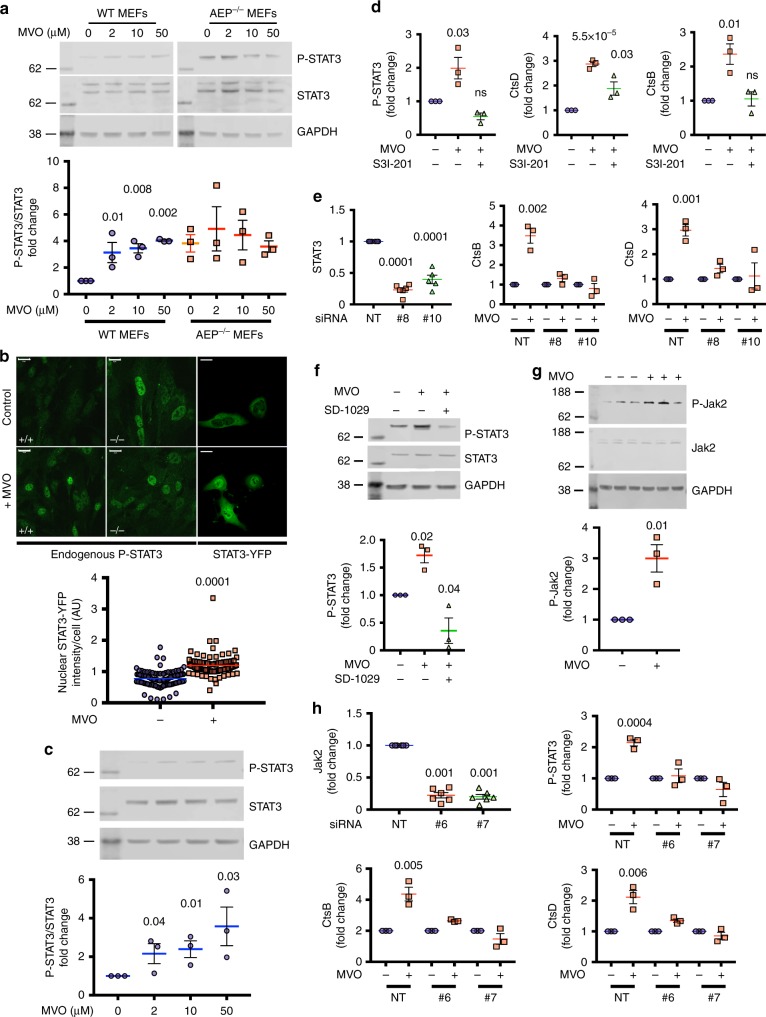
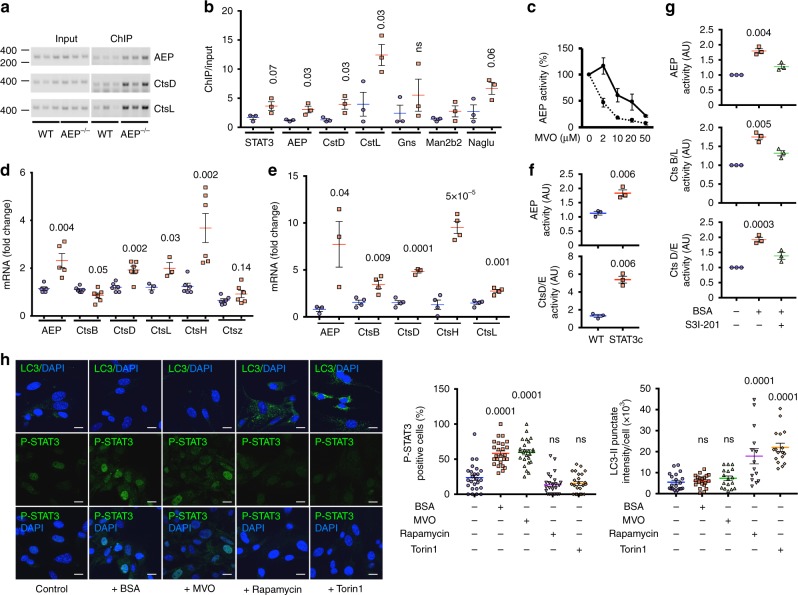
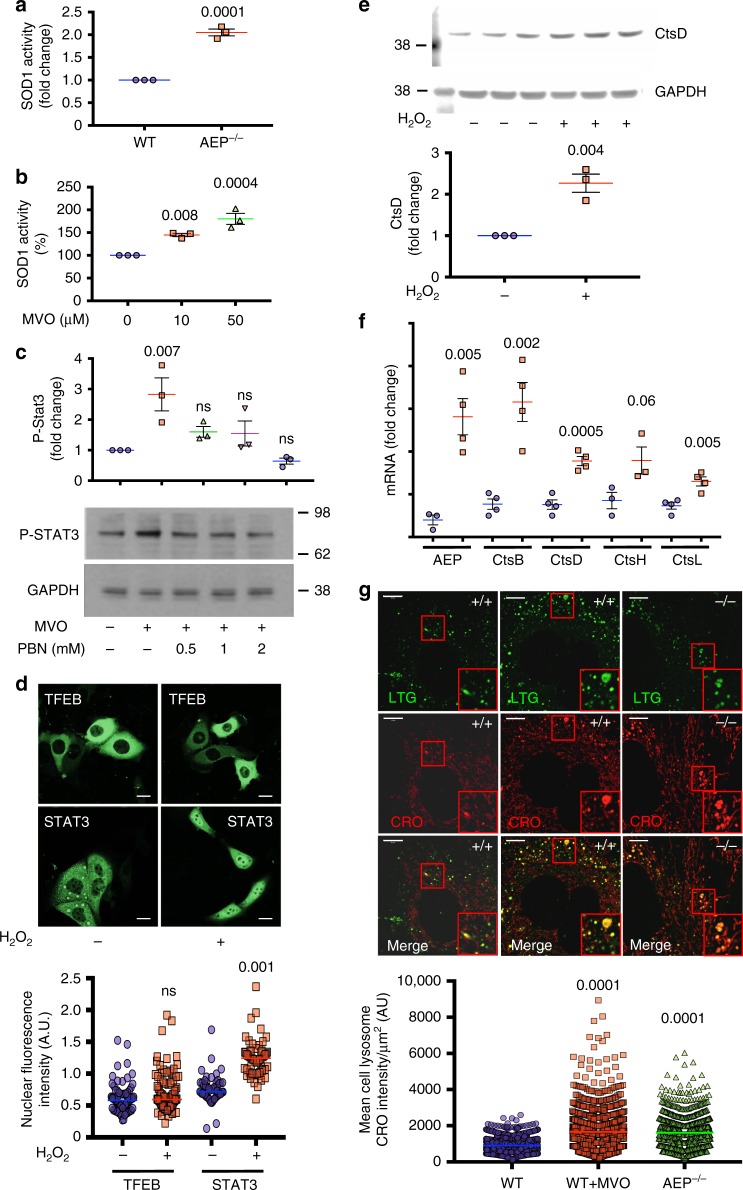
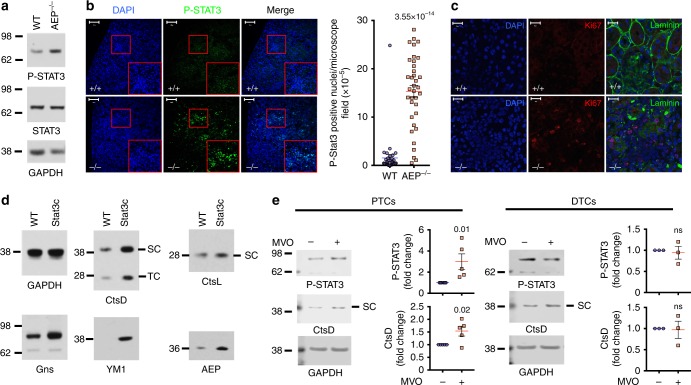
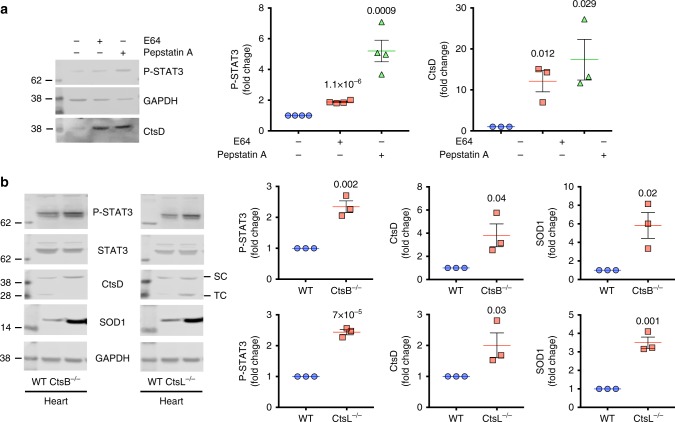
Diverse cellular processes depend on the lysosomal protease system but how cells regulate lysosomal proteolytic capacity is only partly understood. We show here that cells can respond to protease/substrate imbalance in this compartment by de novo expression of multiple lysosomal hydrolases. This response, exemplified here either by loss of asparagine endopeptidase (AEP) or other lysosomal cysteine proteases, or by increased endocytic substrate load, is not dependent on the transcription factor EB (TFEB) but rather is triggered by STAT3 activation downstream of lysosomal oxidative stress. Similar lysosomal adaptations are seen in mice and cells expressing a constitutively active form of STAT3. Our results reveal how cells can increase lysosomal protease capacity under 'fed' rather than 'starved' conditions that activate the TFEB system. In addition, STAT3 activation due to lysosomal stress likely explains the hyperproliferative kidney disease and splenomegaly observed in AEP-deficient mice.


Conflict of interest statement

The authors declare no competing interests.

Figures

Fig. 1
Fig. 1
In vivo SILAC labelling reveals elevated lysosomal hydrolase expression induced by lack of AEP. a Transmission electron microscopy of WT (upper panel) and AEP−/− (lower panel) kidney sections. Arrows indicate lysosomes. (Scale bar = 2 μm) b Immunofluorescence showing more prominent lysosomes (CtsD, green) in AEP−/− kidney sections (lower panel) compared to WT kidney sections (upper panel). (Scale bar = 20 μm). c Western blot analysis confirming the accumulation in AEP−/− kidneys of proteins identified by mass spectrometry. d Volcano plot showing proteins over-represented (blue dots, lysosomal proteins highlighted in yellow) or under-represented (red dots) in AEP−/− lysosomal kidney fractions against the −log10 p-value for three independent experiments. Dotted line on y axis indicates p value < 0.05. e Acute AEP inhibition with MVO26630 recapitulates hydrolase induction in WT MEF and AEP reconstitution reverses it in AEP−/− MEF. f Induction of CtsD/E and CtsB/L activities in AEP−/− MEF compared to WT MEF. Data are the average ± SD of n = 4 biologically independent samples for CtsD/E or n = 3 biologically independent samples for CtsB/L. Statistical significance was calculated using a two-sided unpaired t-test. g Semi-quantitative RT-PCR analysis of mRNA levels for different cathepsins in WT MEF, WT MEF treated overnight with 50 μM MVO26630 and AEP−/− MEF. Data are the average ± SD of n = 3 biologically independent samples. Statistical significance was calculated using a Dunnett’s multiple comparison test
Fig. 2
Fig. 2
Lack of AEP induces an increase in the hydrolytic capacity of lysosomes in vivo. Heatmap built using heatmap.2 in the gplots package of R program showing proteins over-represented (red) or under-represented (green) in the AEP−/− lysosomal kidney fractions compared to WT samples as identified by our SILAC approach, organised by cellular location and molecular function
Fig. 3
Fig. 3
Increased lysosomal proteolytic capacity induced by suppression of AEP activity. a FiTC-BSA uptake and DQ-BSA degradation rates in WT 3T3s treated (red circles) or untreated (blue squares) with 50 μM MVO26630 for 16 h. Data are means ± SEM of n = 8 microscopic fields for untreated and n = 15 microscopic fields for MVO-treated. (Scale bar = 20 μm). b Time course of degradation of oncostatin M receptor beta (Osmrβ) in WT MEFs treated (dashed grey line) or untreated (black solid line) with 50 μM MVO26630 for 16 h and AEP−/− MEFs (red solid line) following receptor downregulation by oncostatin M. Relative intensity of each Osmrβ band was calculated for three independent experiments. c Time course of degradation of epithelial growth factor receptor (EGFR) in WT MEFs treated (dashed grey line) or untreated (black solid line) with 50 μM MVO26630 for 16 h and AEP−/− MEFs (red solid line) following receptor downregulation by epithelial growth factor. Relative intensity of each EGFR band was calculated for three independent experiments. Statistical significance was calculated using a two-sided unpaired t-test. ns = not significant
Fig. 4
Fig. 4
Increased lysosomal hydrolytic capacity induced by chronic or acute AEP-deficiency does not depend on TFEB activation. a Cellular localisation of TFEB-GFP in HKC-8 cells treated or untreated with 50 μM MVO26630 or 1 μM Torin1 overnight. (Scale bar = 20 μm). Data are the average ± SD of n = 93 cells for control sample, n = 48 for Torin1-treated sample and n = 92 for MVO-treated sample. Statistical significance was calculated using a Dunnett’s multiple comparison test. b Localisation of TFEB by IF in WT and AEP−/− kidney sections. (Scale bar = 20 μm). c Levels of P-4EBP1 by IF in WT and AEP−/− kidney sections. (Scale bar = 20 μm). d Immunoblotting and quantitation of LC3II/total LC3 ratio in lysates from WT MEFs treated with Rapamycin (1 μM) or Torin1 (1 μM) for 4 h or with MVO26630 (50 μM) for 16 h. Data are the average ± SD of n = 5 biologically independent samples. Statistical significance was calculated using a Dunnett’s multiple comparison test. e Levels of expression of CtsB and CtsD in HKC-8 WT and TFEB knockout Exon 1 treated or untreated with 50 μM MVO26630 for 16 h. Data are the average ± SD of n = 6 biologically independent samples for CtsB and n = 7 biologically independent samples for CtsD. Statistical significance was calculated using a two-sided unpaired t-test. f mRNA expression levels for CtsB and CtsD in HKC-8 WT and TFEB knockout Exon 1 treated or untreated with 50 μM MVO26630 for 16 h. Data are the average ± SD of n = 3 biologically independent samples. Full data and gel calibration markers can be seen in Supplementary Fig. 3c. Statistical significance was calculated using a two-sided unpaired t-test
Fig. 5
Fig. 5
Increased lysosomal hydrolytic capacity induced by chronic or acute AEP-deficiency is controlled by the Jak2-STAT3 signalling pathway. a STAT3 activation in WT but not AEP−/− MEFs treated for 16 h with increasing concentrations of MVO26630. Data are the average ± SD of n = 3 biologically independent samples. Statistical significance was calculated using a Dunnett’s multiple comparison test. b P-STAT3 localisation in WT and AEP−/− MEFs treated or not with 50 μM MVO26630 for 16 h (endogenous P-STAT3) and HKC-8 cells transfected with STAT3-YFP and treated or not with 50 μM MVO26630 for 16 h. Data are the average ± SEM of n = 96 cells for control samples and n = 86 for MVO-treated samples. Statistical significance was calculated using a two-sided unpaired t-test. (Scale bar = 20μm). c STAT3 activation in HKC-8 cells treated with increasing levels of MVO26630 overnight. Data are the average ± SD of n = 3 biologically independent samples. Statistical significance was calculated using a two-sided unpaired t-test. d CtsD, CtsB and P-STAT3 levels in WT MEFs compared to WT MEFs treated overnight with 50 μM MVO26630 with or without 100 μM of the STAT3 inhibitor S3I-201. Data are the average ± SD of n = 3 biologically independent samples. Statistical significance was calculated using a two-sided unpaired t-test. e Levels of STAT3, CtsB and CtsD in WT HKC-8 cells transfected with a non-targeting siRNA (NT) or two different STAT3-targeting siRNAs (#8 and #10) and treated or not with 50 μM MVO26630 for 16 h. Data are the average ± SD of n ≥ 3. Statistical significance was calculated using a two-sided unpaired t-test. f P-STAT3 western blot in WT HKC-8 treated with 50 μM MVO26630 in the presence or absence of the Jak2 inhibitor SD-1029 (10 μM). Data are the average ± SD of n = 3 biologically independent samples. Statistical significance was calculated using a Dunnett’s multiple comparison test. g Levels of P-Jak2 in WT HKC-8 cells treated or untreated with 50 μM MVO26630 for 16 h. Data are the average ± SD of n = 3 biologically independent samples. Statistical significance was calculated using a two-sided unpaired t-test. h Levels of Jak2, P-STAT3, CtsB and CtsD in WT HKC-8 cells transfected with a non-targeting siRNA (NT) or two different Jak2-targeting siRNAs (#6 and #7) and treated or not with 50 μM MVO26630 for 16 h. Data are the average ± SD of n ≥ 3 biologically independent samples. Statistical significance was calculated using a two-sided unpaired t-test
Fig. 6
Fig. 6
Direct STAT3 involvement in regulation of lysosomal hydrolase genes under conditions of protease activity/lysosomal substrate imbalance. a Agarose gel analysis of representative ChIP-PCR products for AEP, CtsD and CtsL promoters in WT and AEP-deficient MEFs. Full data and gel calibration markers can be seen in Supplementary Fig. 6. b Quantitative PCR analysis of DNA from STAT3 ChIP of WT (blue circles) and AEP-deficient (red squares) MEFs expressed as fold enrichment. Data are the average ± SD of n = 3 biologically independent samples. Statistical significance was calculated using a two-sided unpaired t-test. c AEP activity in WT MEF treated overnight with different concentrations of MVO26630 in the presence (dashed line) or absence (solid line) of 100 μM S3I-201. Data are the average ± SD of three independent experiments. d Quantitative PCR analysis of the mRNA levels for different lysosomal proteases in WT (blue circles) and STAT3c 3T3 (red squares) cells. Data are the average ± SD of n = 6 biologically independent samples for all samples, except for AEP where n = 5 and CtsL where n = 3. Statistical significance was calculated using a two-sided unpaired t-test. e Quantitative PCR analysis of the mRNA levels for different lysosomal proteases in WT MEFs treated (red squares) or not (blue circles) with 30 mg/ml BSA overnight. Data are the average ± SD of n = 4 biologically independent samples for all samples, except for AEP and CtsD where n = 3. Statistical significance was calculated using a two-sided unpaired t-test. f AEP and CtsD/E activities measured in WT and STAT3c 3T3 cells. Data are the average ± SD of n = 3 biologically independent samples. Statistical significance was calculated using a two-sided unpaired t-test. g Activities of AEP, CtsB/L and CtsD/E in WT MEF treated or not with 30 mg/ml BSA overnight in the presence or absence of 100 μM S3I-201. Data are the average ± SD of n = 3 biologically independent samples. h Quantitation of P-STAT3 and LC3II levels in WT MEFs treated with Rapamycin (1 μM) or Torin1 (1 μM) for 4 h or with MVO26630 (50 μM) or BSA (30 mg/ml) for 16 h. Data are the average ± SD of n = 25 microscopic fields for P-STAT3 and n = 14 for LC3II. Statistical significance was calculated using a Dunnett’s multiple comparison test. ns = not significant. (Scale bar = 20μm)
Fig. 7
Fig. 7
Reactive oxygen species: At the nexus between lysosomal hydrolytic capacity and STAT3 phosphorylation. a Superoxide dismutase 1 (SOD1) activity in WT and AEP−/− MEFs. Data are the average ± SD of n = 3 biologically independent samples. Statistical significance was calculated using a two-sided unpaired t-test. b SOD1 activity in WT MEFs treated for 16 h with increasing concentrations of MVO26630. Data are the average ± SD of n = 3 biologically independent samples. Statistical significance was calculated using a Dunnett’s multiple comparison test. c MVO26630-induced (6 h, 50 μM) STAT3 activation in the presence of increasing concentrations of alpha Phenyl-N-Tert Butyl Nitrone (PBN). Data are the average ± SD of n = 3 biologically independent samples. Statistical significance was calculated using a Dunnett’s multiple comparison test. d Cellular distribution of TFEB-GFP (upper panels) and STAT3-YFP (lower panels) in HKC-8 WT treated or untreated with 0.2 mM H2O2 for 16 h. Quantitative data show the nuclear fluorescence intensity per cell (n = 79 for TFEB control, n = 99 for TFEB + H2O2, n = 59 for STAT3 control and n = 58 for STAT3 + H2O2). Statistical significance was calculated using a two-sided unpaired t-test. (Scale bar = 20μm). e Levels of CtsD in HKC-8 WT cells treated with 0.2 mM H2O2 for 16 h. Data are the average ± SD of n = 3 biologically independent samples. Statistical significance was calculated using a two-sided unpaired t-test. f Quantitative PCR analysis of the mRNA levels encoding several different lysosomal proteases in WT MEFs treated or not with 0.2 mM H2O2 overnight. Data are the average ± SD of n = 4 biologically independent samples for all samples, except for CtsH where n = 3. Statistical significance was calculated using a two-sided unpaired t-test. g Live cell imaging of lysosomal production of reactive oxygen species using CellROX Orange (CRO) in AEP−/− or WT MEFs treated or not with 50 μM MVO26630 for 16 h. LysoTracker Green DND26 (LTG) was used as a lysosomal marker. Data represent the mean CRO intensity per lysosome normalised to lysosomal size in µm2 (n = 1254 lysosomes for WT MEFs sample, n = 1413 lysosomes for WT MEFs + MVO sample and n = 1204 for AEP MEFs). (Scale bar = 10μm). Statistical significance was calculated using a Dunnett’s multiple comparison test
Fig. 8
Fig. 8
Activation of STAT3 in AEP−/− kidney and enhanced hydrolase expression in STAT3c kidneys. a STAT3 and P-STAT3 levels in WT and AEP−/− kidneys. b P-STAT3 detected by IF in WT and AEP−/− kidney sections. Right panel shows quantitation of the number of P-STAT3 positive nuclei per area (n = 35 microscopic fields). (Scale bar = 100μm). Statistical significance was calculated using a two-sided unpaired t-test. c Ki67 and laminin detected by IF in WT and AEP−/− kidney sections. (Scale bar = 20μm). d Similar proteins accumulate in STAT3c and AEP−/− kidney. e Levels of P-STAT3 and CtsD in proximal (PTC) and distal (DTC) tubular cells treated or not with 50 μM MVO26630 overnight. Data are the average ± SD of n = 5 biologically independent samples for PTCs and n = 3 for DTCs. Statistical significance was calculated using a two-sided unpaired t-test
Fig. 9
Fig. 9
Chronic or acute inhibition of cysteine or aspartyl cathepsins lead to a similar response. a Levels of P-STAT3 and CtsD in WT MEFs treated or not with 10 μM E64 or 5 μM Pepstatin A for 72 h. Data are the average ± SD of n = 4 biologically independent samples for P-STAT3 and n = 3 biologically independent samples for CtsD. Statistical significance was calculated using a two-sided unpaired t-test. b Levels of P-STAT3, STAT3, CtsD and SOD1 in CtsB−/− heart or CtsL−/− heart compared to WT heart. Data are the average ± SD of n = 3 biologically independent samples. Statistical significance was calculated using a two-sided unpaired t-test

References

    1. Sepulveda FE, et al. Critical role for asparagine endopeptidase in endocytic Toll-like receptor signaling in dendritic cells. Immunity. 2009;31:737–748. doi: 10.1016/j.immuni.2009.09.013. - DOI - PubMed
    1. Ewald S, et al. The ectodomain of Toll-like receptor 9 is cleaved to generate a functional receptor. Nature. 2008;456:658–662. doi: 10.1038/nature07405. - DOI - PMC - PubMed
    1. Settembre C, et al. A lysosome-to-nucleus signalling mechanism senses and regulates the lysosome via mTOR and TFEB. EMBO J. 2012;31:1095–1108. doi: 10.1038/emboj.2012.32. - DOI - PMC - PubMed
    1. Sabatini DM. Twenty-five years of mTOR: Uncovering the link from nutrients to growth. Proc. Natl Acad. Sci. USA. 2017;114:11818–11825. doi: 10.1073/pnas.1716173114. - DOI - PMC - PubMed
    1. Colbert JD, Matthews SP, Miller G, Watts C. Diverse regulatory roles for lysosomal proteases in the immune response. Eur. J. Immunol. 2009;39:2955–2965. doi: 10.1002/eji.200939650. - DOI - PubMed

Publication types

MeSH terms