

doi: 10.1038/s41467-018-07771-0.
A rapid and robust method for single cell chromatin accessibility profiling
Affiliations
- PMID: 30559361
- PMCID: PMC6297232
- DOI: 10.1038/s41467-018-07771-0
Item in Clipboard
A rapid and robust method for single cell chromatin accessibility profiling
Nat Commun.
.
Abstract
The assay for transposase-accessible chromatin using sequencing (ATAC-seq) is widely used to identify regulatory regions throughout the genome. However, very few studies have been performed at the single cell level (scATAC-seq) due to technical challenges. Here we developed a simple and robust plate-based scATAC-seq method, combining upfront bulk Tn5 tagging with single-nuclei sorting. We demonstrate that our method works robustly across various systems, including fresh and cryopreserved cells from primary tissues. By profiling over 3000 splenocytes, we identify distinct immune cell types and reveal cell type-specific regulatory regions and related transcription factors.
Conflict of interest statement
The authors declare no competing interests.
Figures

Simple and robust analysis of chromatin status at the single cell level. a Schematic view of the workflow of the scATAC-seq method. Tagmentation is performed upfront on bulk cell populations, followed by sorting single-nuclei into 96/384-well plates containing lysis buffer. The lysis buffer contains a low concentration of proteinase K and SDS to denature the Tn5 transposase and fragment the genome. Tween-20 is added to quench SDS. Subsequently, library preparation by indexing PCR is performed, and the number of PCR cycles needed to amplify the library is determined by quantitative PCR (qPCR) (Supplementary Figure 2b). b Species mixing experiments to show the accuracy of FACS. Equal amounts of HEK293T (Human) and NIH3T3 (Mouse) cells were mixed, and scATAC-seq was performed as described in a. Successful wells with more than 90% of reads uniquely mapped to either human or mouse were categorised as singlets (n = 303). Otherwise, they will be categorised as doublets (n = 4) (see Methods). c Comparison of the median library size (estimated by the Picard tool), fraction of mitochondrial DNA (MT content) and fraction of reads in peaks (FRiP) in single cells from either C1 (blue) or plate-based (red) scATAC-seq approach. d UCSC genome browser tracks displaying the signal around the Nanog gene locus from the aggregate of mESCs obtained from Fluidigm C1 (top) and plate (bottom). e The same type of tracks as d around the ZBTB32 gene locus in K562 cells
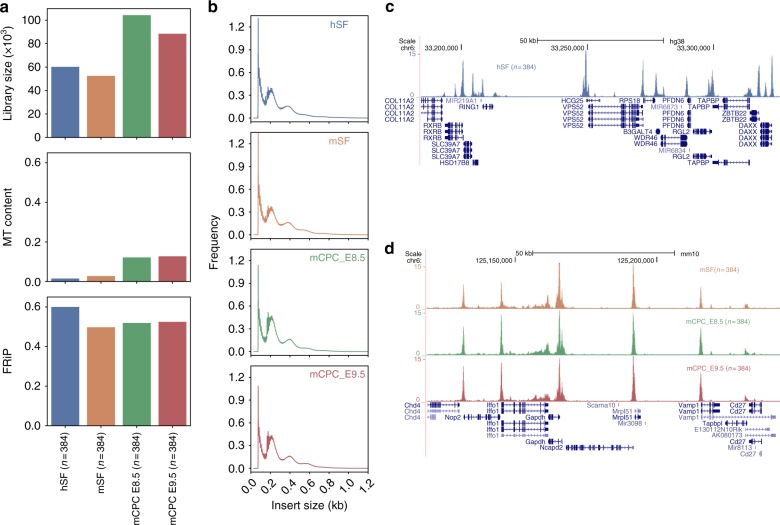
Plate-based scATAC-seq worked robustly on cryopreserved cells from primary tissues. a Comparison of the median library size (estimated by the Picard tool), fraction of mitochondrial DNA (MT content) and fraction of reads in peaks (FRiP) in cryopreserved single cells from four different tissues: human skin fibroblasts (hSF), mouse skin fibroblasts (mSF), mouse cardiac progenitor cells (mCPC) at embryonic day E8.5 and E9.5. b Insert size frequencies from the aggregated data of the cells from the four tissues. c, d UCSC genome browser tracks displaying the signal around the RPS18 gene locus from the aggregate of hSFs c and around the Gapdh gene locus from the aggregate of mSFs, mCPC_E8.5 and mECP_E9.5 d
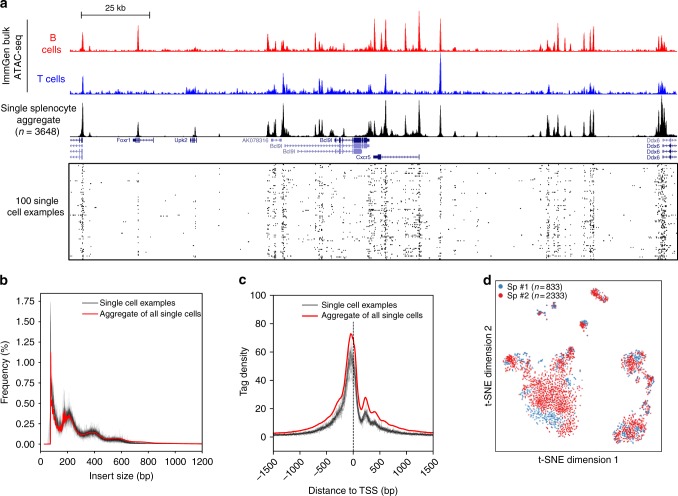
Plate-based scATAC-seq applied to over 3000 mouse splenocytes. a UCSC genome browser tracks displaying the signal around the Cxcr5 gene locus from the aggregate of all single cells in this study. Bulk ATAC-seq profiles from the ImmGen consortium are also shown. Randomly selected 100 single cell profiles are show below the aggregated profile. b, c Insert size frequencies b and sequencing read distributions across transcriptional start sites c of libraries from the aggregated data (the red line) and individual single cells (grey lines, 24 examples are shown). d A two-dimensional projection of the scATAC-seq data using t-SNE. Colours represent two different batches, showing excellent agreement between batches. Sp, spleen

Identification of different cell types and cell-type-specific open chromatin regions and transcription factor motifs. a The same t-SNE plot as in Fig. 3d, coloured by the number of counts in the peaks near indicated gene locus. b The same t-SNE plot as in Fig. 3d coloured by spectral clustering and cell-type annotation. c Comparisons of spleen CD4 T cells scATAC-seq obtained by two strategies. TagSort: cells were stained with anti-CD4-PE, tagged with Tn5 and CD4-PE-positive cells were sorted for scATAC-seq; SortTag: CD4 T cells were purified first and scATAC-seq was performed on the purified cells. Top: comparison of library size and binding signal correlation (pearson r = 0.96) around called peaks; bottom: UCSC genome browser tracks of the indicated single cell aggregates around the Cd4 gene locus. d UCSC genome browser tracks around Cd27 and Cd83 gene loci, displaying the aggregate (top panel) and single cell (bottom panel) signals of the two NK clusters. ATAC-seq peaks specific to the CD27+ NK cells are highlighted. For visual comparison reason, we randomly choose 65 out of 75 CD27- NK cells. e
Z-score of normalised read counts in the top 500 peaks that distinguish each cell cluster based on the logistic regression classifier, across each peak (row) in each cell (column). Top 500 marker peaks were picked per cell cluster, so there are 500 × 12 = 6000 peaks in the heatmap. Cells are ordered by cluster labels. f Heatmap representation of transcription factor motif (rows) enrichments (binomial test p-values) in the top 500 marker peaks in different cell clusters (columns). Some key motifs are enclosed by black rectangles and motif logos are shown to the right. Motif names are taken from the HOMER software suite
References
Publication types
MeSH terms
Substances
Grants and funding
LinkOut - more resources
Full Text Sources
Other Literature Sources
