. 2019 Jan;565(7737):43-48.
doi: 10.1038/s41586-018-0768-9. Epub 2018 Dec 17.

Loss of ADAR1 in tumours overcomes resistance to immune checkpoint blockade

Affiliations

Loss of ADAR1 in tumours overcomes resistance to immune checkpoint blockade

Jeffrey J Ishizuka et al. Nature. 2019 Jan.

Abstract

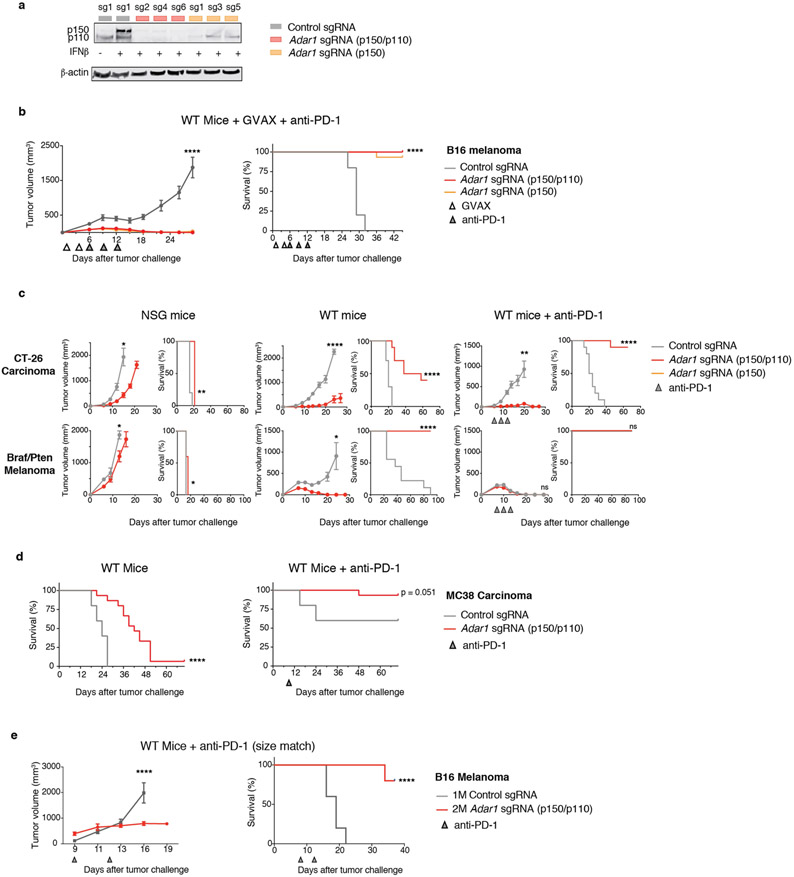
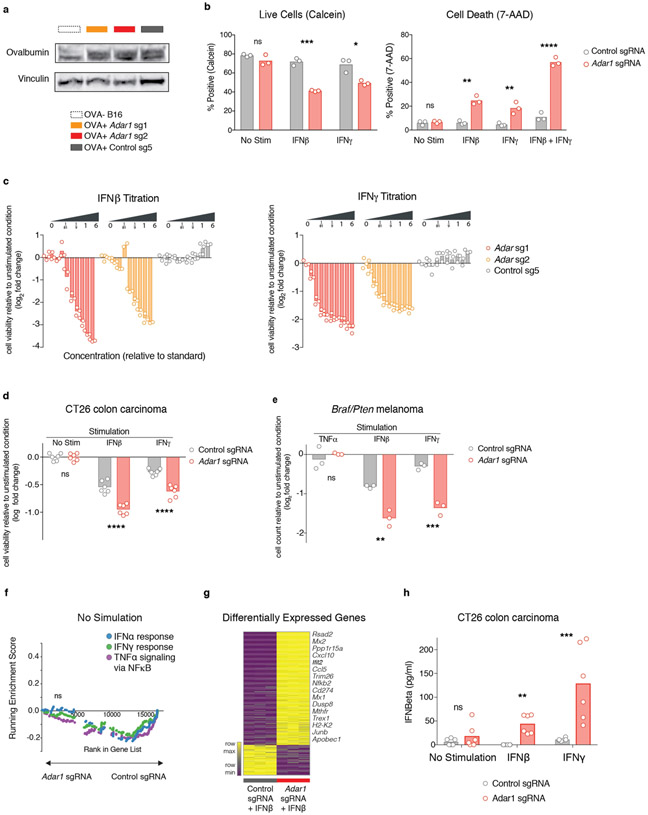
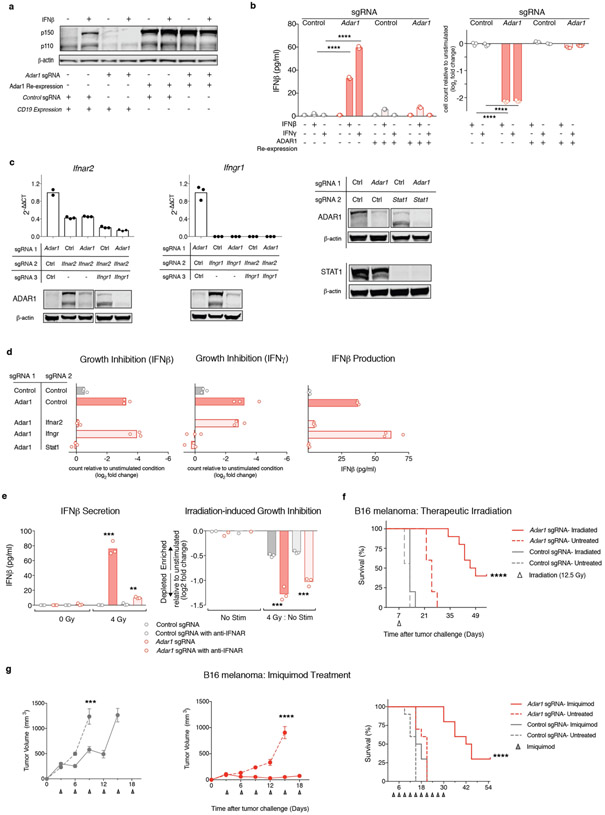
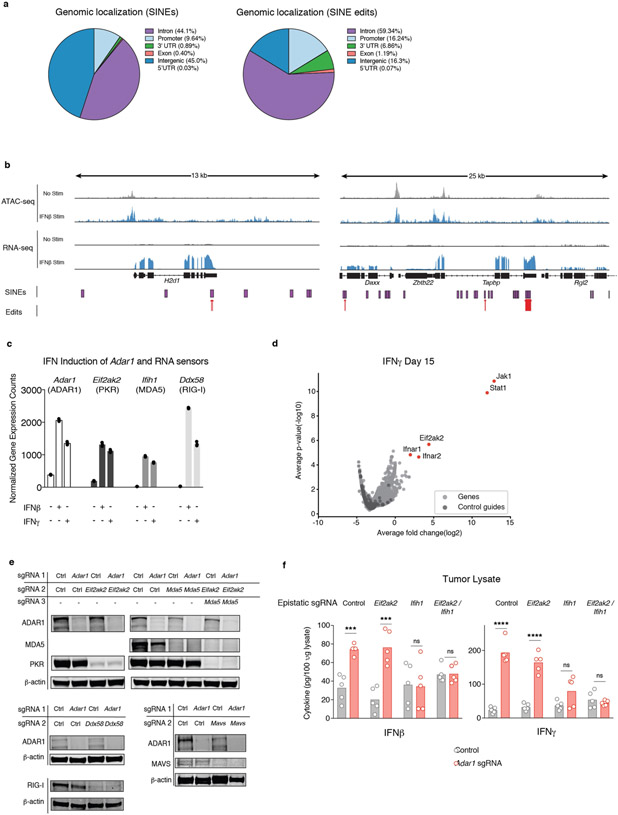
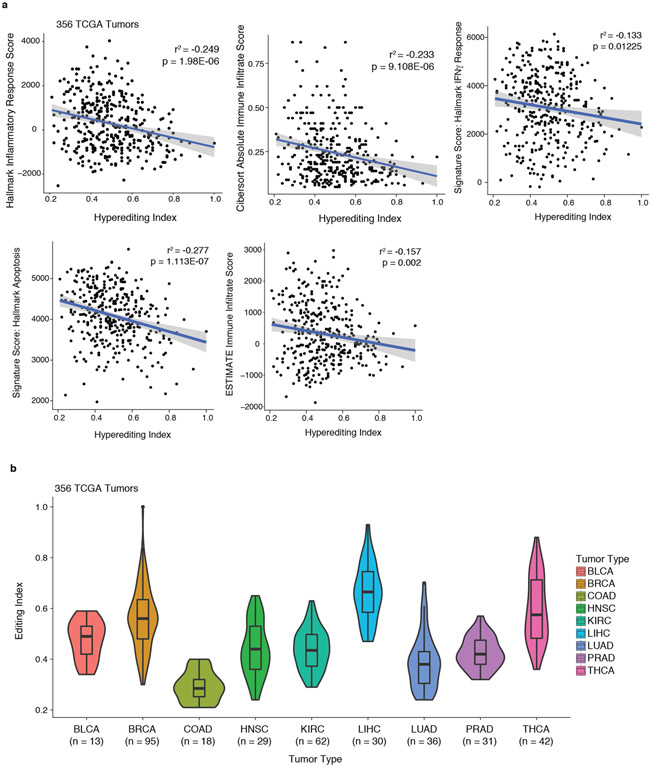
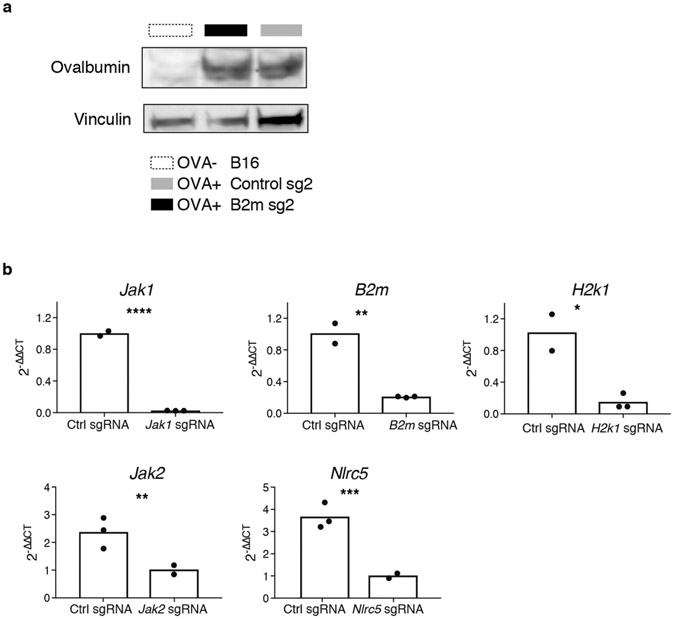
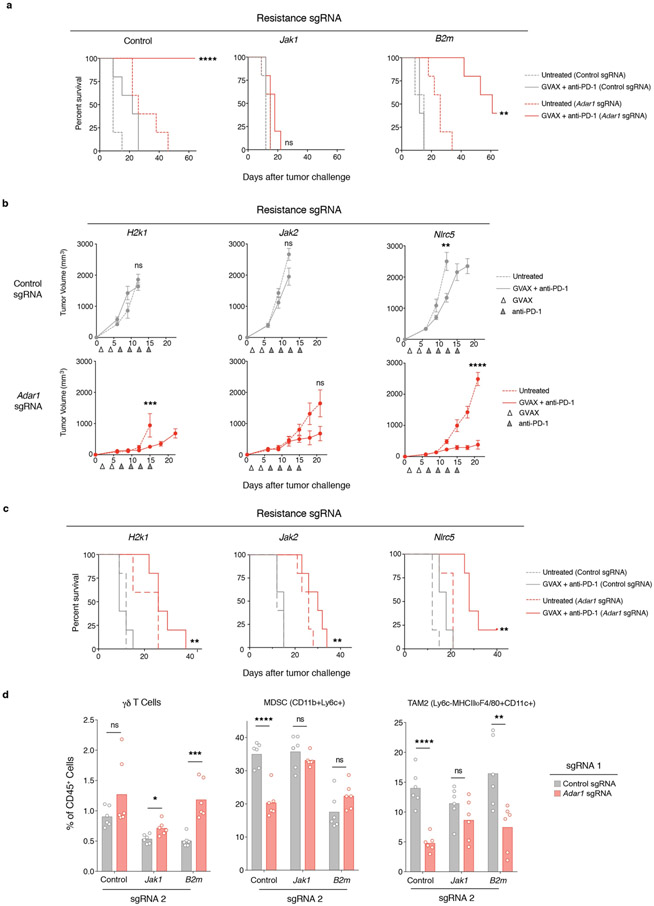
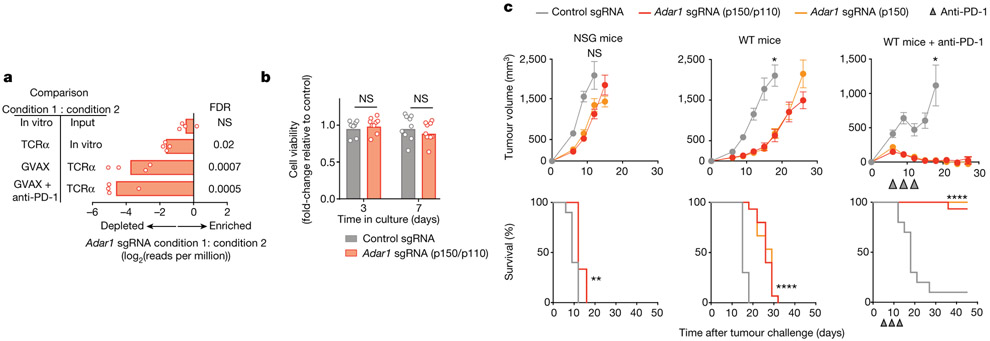
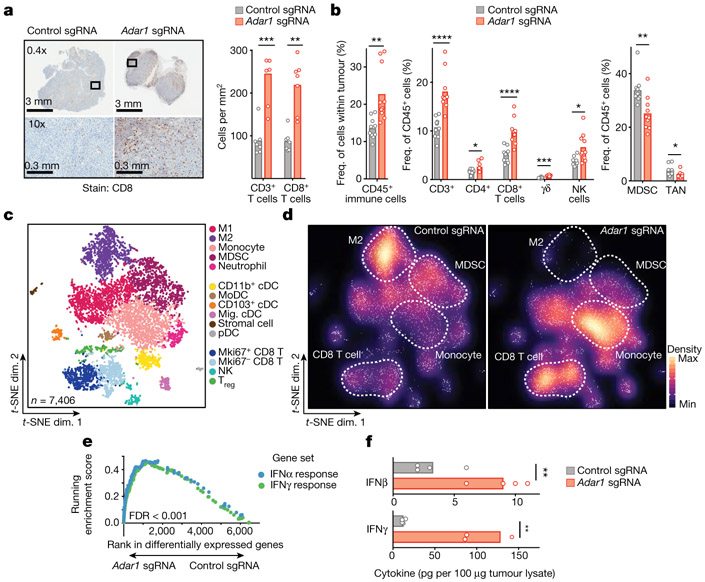
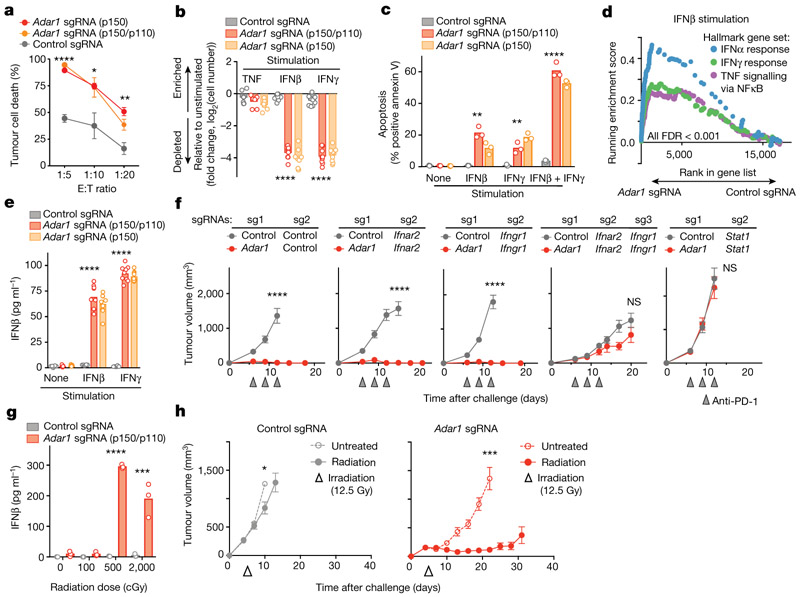
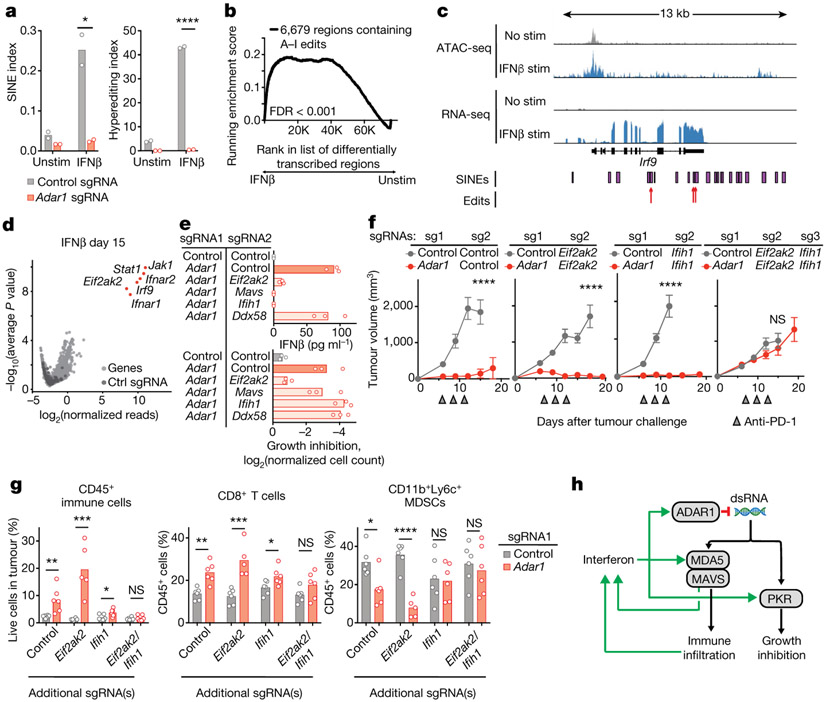
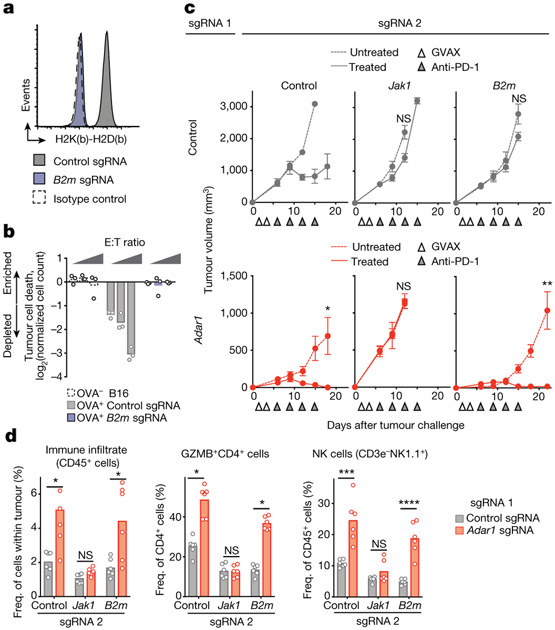
Most patients with cancer either do not respond to immune checkpoint blockade or develop resistance to it, often because of acquired mutations that impair antigen presentation. Here we show that loss of function of the RNA-editing enzyme ADAR1 in tumour cells profoundly sensitizes tumours to immunotherapy and overcomes resistance to checkpoint blockade. In the absence of ADAR1, A-to-I editing of interferon-inducible RNA species is reduced, leading to double-stranded RNA ligand sensing by PKR and MDA5; this results in growth inhibition and tumour inflammation, respectively. Loss of ADAR1 overcomes resistance to PD-1 checkpoint blockade caused by inactivation of antigen presentation by tumour cells. Thus, effective anti-tumour immunity is constrained by inhibitory checkpoints such as ADAR1 that limit the sensing of innate ligands. The induction of sufficient inflammation in tumours that are sensitized to interferon can bypass the therapeutic requirement for CD8+ T cell recognition of cancer cells and may provide a general strategy to overcome immunotherapy resistance.


Conflict of interest statement

Competing interests This work was supported in part by funding from Calico Life Sciences, LLC. J.J.I., R.T.M. and W.N.H. are authors of a patent application related to ADAR. W.N.H. consults for and has equity in Tango Therapeutics.

Figures

Extended Data Fig. 1 ∣
Extended Data Fig. 1 ∣. Supporting evidence that ADAR1 loss enhances the response to immunotherapy.
a, Expression of ADAR1 protein in control (grey), Adar1 p150-null (orange) and Adar1 p150/p110-null (red) B16 cells. Results are representative of three independent experiments. b, Tumour volume (left) and survival analysis (right) of control (grey), Adar1 p150-null (orange) or Adar1 p110/p150-null (red) B16 tumours in GVAX- and anti-PD-1-treated wild-type C57BL/6 mice. n = 5 animals per guide with two separate guides for the control group and at least two separate guides for each Adar1-null group. Data are representative of two independent experiments. c, Tumour volume and survival analysis of control (grey), Adar1 p150-null (orange) or Adar1 p110/p150-null (red) CT26 and Braf/Pten tumours in NSG, wild-type and wild-type anti-PD-1-treated mice. n = 5 mice per group; data are representative of two independent experiments. d, Survival analysis of control and Adar1-null MC38 tumours in wild-type and wild-type anti-PD-1-treated C57BL/6 mice. n = 5 animals per guide with two separate guides for the control group and three separate guides for the Adar1-null group. Data are representative of two independent experiments. e, Tumour volume and survival analysis of Adar1-null and control B16 tumours size matched at the time of PD-1 treatment initiation. be, Tumour volume curves are mean ± s.e.m and assessed with Student’s t-test; survival curves assessed with log-rank test, *P < 0.05; **P < 0.01; ***P < 0.001; ****P < 0.0001.
Extended Data Fig. 2 ∣
Extended Data Fig. 2 ∣. Flow cytometry gating strategies and representative plots.
a, Gating strategy and representative flow cytometry plots for the assessment of CD4+, CD8+ and γδ T cells in Adar1-null and control B16 tumours. b, Gating strategy and representative flow cytometry plots for the assessment of NK cells in Adar1-null and control B16 tumours. c, Gating strategy and representative flow cytometry plots for the assessment of CD11b+Ly6c+ and CD11b+Ly6cloCD24+ cells in Adar1-null and control B16 tumours.
Extended Data Fig. 3 ∣
Extended Data Fig. 3 ∣. Further flow cytometry gating strategies and representative plots.
a, Gating strategy and representative flow cytometry plots for the assessment of granzyme B+CD4+ T cells in Adar1-null and control B16 tumours. b, Gating strategy and representative flow cytometry plots for the assessment of TAM1 and TAM2 populations in Adar1-null and control B16 tumours.
Extended Data Fig. 4 ∣
Extended Data Fig. 4 ∣. Single-cell RNA-seq extended data.
a, Gene expression matrix from single-cell RNA-seq experiment characterizing expression of lineage-defining genes in cell clusters. b, Key differentially expressed transcripts that distinguish cell clusters in Fig. 2. c, Paired quantile-quantile (Q–Q) plots comparing the expression of a curated set of genes in immune cells from Adar1-null and control tumours and matched t-SNEs depicting the distribution of gene expression for proinflammatory, suppressive and T cell activation/effector genes. P values calculated using Wilcoxon rank-sum test. d, Single-cell gene set enrichment scores of an IFNγ response signature score within individual immune subpopulations from Adar1-null and control tumours (P values calculated using Kolmogorov–Smirnov test). a, c, d, n = 7,406 cells. *P < 0.05; **P < 0.01; ***P < 0.001.
Extended Data Fig. 5 ∣
Extended Data Fig. 5 ∣. Further studies corroborating the reported in vitro phenotype of Adar1-null tumour cells.
a, Western blot demonstrating expression of ovalbumin in modified Adar1 p150/p110-null (red), Adar1 p150-null (orange) and control (grey) B16 tumour cell lines. Data are representative of two independent experiments. b, Calcein cell viability and 7-AAD cell death staining of control or Adar1-null B16 tumour cells following stimulation with IFNβ, IFNγ or a combination of both. Data are representative of three independent experiments with n = 3 for each condition. c, Growth and viability of Adar1 p150/p110-null, Adar1 p150-null and control B16 tumour cells in response to increasing doses of IFNβ and IFNγ (n = 3 for each condition). Doses are relative to 1 × standard of 1,000 U ml−1 IFNβ and 100 ng ml−1 IFNγ. Data are representative of two independent experiments. d, Growth and viability of Adar1 p150/p110-null and control CT26 tumour cells following stimulation with IFNβ or IFNγ relative to the unstimulated state (n = 3 for each condition). Data are representative of two independent experiments. e, Growth and viability of Adar1 p150/p110-null and control Braf/Pten tumour cells following stimulation with TNF, IFNβ or IFNγ relative to the unstimulated state (n = 3 for each condition). Data are representative of two independent experiments. f, GSEA of gene signatures in Adar1-null compared with control B16 tumours cells after in vitro culture without cytokine stimulation. n = 3 for each condition; FDR calculated using GSEA. g, Heat map showing differentially expressed genes from Adar1-null and control B16 tumour cells 36 h after IFNβ stimulation in vitro (n = 3 for each condition). Genes listed in adjacent text were manually curated as antiviral or relevant to anti-tumour immunity. h, IFNβ ELISA of control and Adar1 p150/p110 CT26 tumour cells following stimulation with IFNβ or IFNγ (n = 3 for each condition). b–e, h, Two-sided Student’s t-test, *P < 0.05; **P < 0.01; ***P < 0.001; ****P < 0.0001.
Extended Data Fig. 6∣
Extended Data Fig. 6∣. ADAR1 re-expression and corroborating in vitro epistatic IFN-signalling experiments.
a, Western blot of B16 Adar1-null tumour cells following re-expression of wild-type ADAR1 or an irrelevant control (CD19) protein. Data are representative of two independent experiments. b, IFNβ secretion (left) and relative growth (right) of control (grey), Adar1 p150/p110-null (red), Adar1-null with full-length ADAR1 re-expression construct (red outline) and control with ADAR1 re-expression construct (grey outline) B16 tumour cells following cytokine stimulation as indicated (n = 3 for each condition). Data are representative of two independent experiments. c, qPCR and western blot validation of the loss of expression of Ifnar2, Ifngr1 and Stat1 from B16 tumour cells used to generate the control and Adar1-null tumour cell lines shown in Fig. 3. n = 3 for qPCR experiments and data are representative of two independent experiments. d, Growth inhibition (left two panels) and IFNβ ELISA (right panel) of control and Adar1-null B16 tumour cells modified to delete Ifnar2, Ifngr1 or Stat1 (n = 3 for each condition; data representative of three independent experiments). e, IFNβ secretion in vitro following irradiation with 4 Gy in Adar1-null and control B16 tumour cells with and without IFNAR-blocking antibodies (left). Growth and viability of Adar1-null and control B16 tumour cells in vitro following irradiation with 4 Gy with and without IFNAR-blocking antibodies (right). For both plots: n = 3 for each condition; data are representative of two independent experiments. f, Survival analysis corresponding to the tumour volume curves depicted in Fig. 3h of Adar1 and control tumours treated with therapeutic irradiation. n = 10 mice for each group. Data are representative of two independent experiments. g, Tumour volume and survival analysis of control and Adar1-null B16 tumours treated with topical imiquimod. Data are representative of two independent experiments with n = 10 mice per group. b, e and tumour volume curves, two-sided Student’s t-test; survival curves, log-rank test, *P < 0.05; **P < 0.01; ***P < 0.001; ****P < 0.0001.
Extended Data Fig. 7∣
Extended Data Fig. 7∣. Corroborating data for dsRNA editing and epistasis studies of Adar1-null tumours.
a, Genomic localization of SINEs (left) and detected editing sites within SINEs (right) in control B16 tumour cells. b, Representative tracks of ATAC-seq and RNA-seq mapped to SINEs and detected edits in IFN-inducible regions of accessible chromatin and transcription. c, Transcriptional upregulation of Adar1 and dsRNA sensors 36 h after stimulation with IFNβ or IFNγ in control B16 tumour cells as measured by RNA-seq (n = 3 for each condition). d, Volcano plot depicting the relative depletion and enrichment of sgRNAs targeting 20,146 genes in a Cas9+ Adar1-null B16 tumour cell line following stimulation with IFNγ in vitro. P values are derived using STARS v1.3. e, Western blots demonstrating the loss of expression of PKR, MDA5, RIG-I, MAVS and ADAR1 from double knockout and triple knockout B16 tumour cell lines. Data are representative of two independent experiments. f, IFNβ and IFNγ ELISAs from tumour lysate extracted from Adar1-null and control tumours that were epistatically deleted for dsRNA sensors including Eif2ak2 (PKR), Ifih1 (MDA5) or both (n = 5 for each condition). f, Two-sided Student’s t-test, *P < 0.05; **P < 0.01; ***P < 0.001; ****p < 0.0001.
Extended Data Fig. 8∣
Extended Data Fig. 8∣. Correlations between RNA editing and signatures of immune infiltration in TCGA.
a, Pearson’s correlations between hyperediting index and Hallmark Inflammatory Response, CIBERSORT Absolute Immune Infiltrate, Hallmark Interferon Gamma Response, Hallmark Apoptosis and ESTIMATE immune infiltrate gene signatures from 356 tumours in TCGA for which hyperediting index information was available. b, Distribution of hyperediting index values of individual tumour types from the same samples from TCGA. Box plots represent the range, median, 25th and 75th percentile with n as indicated in the figure.
Extended Data Fig. 9 ∣
Extended Data Fig. 9 ∣. Corroborating data for models of immunotherapy resistance.
a, Western blot demonstrating the expression of ovalbumin in control and B2m-null B16 tumour cell lines depicted in Fig. 5c. Data are representative of two independent experiments. b, Quantitative PCR and western blots demonstrating loss of expression of B2m, Jak1, H2k1, Jak2, and Nlrc in B16 tumour cell lines used to make epistatically deleted Adar1-null or control tumour cells lines. n = 3 for qPCR experiments and data are representative of two independent experiments with P value calculated using two-sided Student’s t-test, *P < 0.05; **P < 0.01; ***P < 0.001; ****P < 0.0001.
Extended Data Fig. 10 ∣
Extended Data Fig. 10 ∣. Loss of ADAR1 overcomes multiple common mechanisms of resistance to immunotherapy in vivo.
a, Survival analysis corresponding to tumour volume curves from Fig. 5c depicting the effect of Adar1 deletion in B16 tumours in which Jak1 or B2m have been epistatically deleted. n = 5 animals per group; data are representative of two independent experiments. b, Tumour volume curves in control (grey) and Adar1-null (red) B16 tumour cells epistatically deleted for H2k1, Jak2 and Nlrc5 and treated with GVAX and anti-PD-1 as indicated (n = 5 animals per group). c, Survival analysis corresponding to the tumour volume curves depicted in b. d, Additional TME characterization of control and Adar1-null B16 tumour cells epistatically deleted for Jakl and B2m as indicated (n = 5 mice per group). Data in d and all tumour volume curves assessed with two-sided Student’s t-test; all survival curves assessed with log-rank test, *P < 0.05; **P < 0.01; ***P < 0.001; ****P < 0.0001.
Fig. 1 ∣
Fig. 1 ∣. Loss of ADAR1 in tumour cells enhances anti-tumour immunity and responses to PD-1 checkpoint blockade.
a, Relative depletion of Adar1 sgRNAs from a pool of sgRNAs targeting 2,368 genes expressed by Cas9+ B16 tumour cells. n = 4 independent guides targeting each gene; false discovery rate (FDR) was calculated using the STARS algorithm v1.3 to generate permutation testing and a null distribution. b, Viability of Adar1-null and control B16 tumour cells following in vitro culture. n = 9 for each condition; results are representative of two independent experiments. c, Tumour volume and survival analysis of control (grey), Adar1 p150-null (orange) or Adar1 p110/p150-null (red) B16 tumours in NSG, wild-type (WT) and wild-type anti-PD-1-treated C57BL/6 mice. Wild-type B16 mice that did not receive anti-PD-1 treatment were treated with an equivalent concentration of rat IgG2a isotype control antibody. Data in c represent two independent experiments with n= 5 animals per guide with two separate guides for the control group and three separate guides for each Adar1-null group. Data for individual guides targeting each isoform of ADAR1 are pooled. a, b, Bars show mean; c, mean ± s.e.m. b, c (tumour volume curves), two-sided Student’s t-test; c (survival curves), log-rank test;*P < 0.05; **P < 0.01; ****P < 0.0001; NS, not significant.
Fig. 2 ∣
Fig. 2 ∣. Loss of ADAR1 inflames the TME.
a, Immunohistochemistry (left) with quantification (right) of CD3+ and CD8+ T cells in untreated control (grey) or Adar1-null (red) B16 tumours (n = 8 mice per group). b, Flow cytometry of immune populations from untreated control and Adar1-null B16 tumours (representative results from two independent experiments; n= 8–10 mice per group per experiment). TAN, tumour-associated neutrophils. c, d, t-Distributed stochastic neighbour embedding (t-SNE) plot (c) and density plots (d) of 7,406 RNA-sequenced (RNA-seq) single CD45+ cells from Adar1-null and control B16 tumours (n = 2 biological replicates for each population). Treg, regulatory T cells; M1, M1 macrophages; M2, M2 macrophages; cDC, conventional dendritic cells; MoDC, monocyte-derived dendritic cells; pDC, plasmacytoid dendritic cells. e, Gene set enrichment analysis (GSEA) of IFN response signatures in immune cells from Adar1-null compared with control tumours. FDR calculated using GSEA. f, IFNβ and IFNγ protein levels within the TME of Adar1-null and control B16 tumours; n = 4 for each condition. a, b, f, Twosided Student’s t-test;*P < 0.05; **P < 0.01; ***P < 0.001; ****P < 0.0001.
Fig. 3 ∣
Fig. 3 ∣. Exogenous IFN is required to trigger anti-tumour immunity in Adar1-null tumours.
a, T cell-dependent killing of ovalbumin-expressing Adar1 p150/p110-null (red), p150-null (orange) and control (grey) B16 tumour cells by OT-I transgenic T cells specific for an ovalbumin-derived peptide in the context of MHC-I at decreasing E:T ratios (1:20, 1:10 and 1:5). Data shown are representative of two independent experiments with n = 3 replicates for each condition; mean ± s.e.m. b, Relative numbers of control, Adar1 p150/p110-null, and Adar1 p150-null B16 tumour cells stimulated with cytokines indicated compared with unstimulated conditions (n = 3 for each condition; data are representative of three independent experiments). c, Annexin V staining in control, Adar1 p110/ p150-null and Adar1 p150-null tumours following stimulation with IFNβ, IFNγ or IFNβ + IFNγ (n = 3 for each condition; data are representative of three independent experiments). d, GSEA of gene signatures in Adar1-null compared with control B16 tumour cells after in vitro culture with IFNβ stimulation. n = 3 for each condition; FDR calculated using GSEA. e, Enzyme-linked immunosorbent assay (ELISA) for IFNβ in supernatant from control, Adar1 p150/p110-null and Adar1 p150-null B16 tumour cells after in vitro culture in unstimulated, IFNβ or IFNγ conditions (n = 3 for each condition; data are representative of three independent experiments). f, Tumour volume following treatment with anti-PD-1 in vivo in genetic epistasis tumour models that lack ADAR1 and components of IFN sensing pathways (n = 5 mice in each group, data representative of two independent experiments). g, ELISA for IFNβ in supernatant from control and Adar1 p150/p110-null B16 tumour cells following irradiation in vitro (n = 3 for each condition; data representative of two independent experiments). h, Tumour volume of control (grey) and Adar1-null (red) B16 tumours following therapeutic irradiation in vivo. n = 10 mice in each group; data are representative of two independent experiments. b, c, e, g, Bars represent mean; f, mean ± s.e.m. a–c, e, f, h, Two-sided Student’s t-test; *P < 0.05; **P < 0.01; ***P < 0.001, ****P < 0.0001; NS, not significant.
Fig. 4 ∣
Fig. 4 ∣. dsRNA sensing triggers distinct mechanisms of anti-tumour immunity through MDA5 and PKR in Adar1-null tumours.
a, Quantification of A-to-I editing in SINEs (left) and hyper-editing (right) in control and Adar1-null B16 tumours with and without stimulation with IFNβ (n = 3 for each condition). b, Enrichment in the expression of RNA transcripts containing A-to-I editing sites following stimulation with IFNβ relative to the unstimulated state in control B16 tumour cells. n = 3 for each condition; FDR calculated using GSEA. c, Assay for transposase accessible chromatin with high-throughput sequencing (ATAC-seq) and RNA-seq at the Irf9 locus indicating positions of SINEs and A-to-I edits of RNA in IFNβ-stimulated or unstimulated control B16 cells. d, Volcano plot depicting the relative depletion and enrichment of sgRNAs targeting 20,146 genes in a Cas9+ Adar1-null B16 tumour cell line following stimulation with IFNβ in vitro. p values were derived using STARS v1.3. e, IFNβ secretion (top) and IFNγ-mediated growth inhibition (bottom) in Adar1-null (red) and control (grey) B16 cells with additional deletion of Eif2ak2 (PKR), Mavs (MAVS), Ifih1 (MDA5), or Ddx58 (RIG-I) (n = 3 for each condition; data are representative of two independent experiments). f, Tumour volume following anti-PD-1 treatment of B16 tumours with the genetic perturbations indicated (n = 5 mice per group; data are representative of two independent experiments). g, Flow cytometry of immune populations from untreated control and Adar1-null B16 tumours with the genetic perturbations indicated (n = 5 mice per group). h, Schema of the genetic dependencies of enhanced immune infiltration and enhanced susceptibility to immune cells in Adar1-null tumours, a, e, g, Bars represent mean; f, mean ± s.e.m. a, f, g, Two-sided Student’s t-test; *P < 0.05; **P < 0.01; ***P < 0.001; ****P < 0.0001; NS, not significant.
Fig. 5 ∣
Fig. 5 ∣. Loss of ADAR1 overcomes resistance to immunotherapy mediated by loss of antigen presentation.
a, MHC I expression in control (grey) and B2m-null (purple) B16 tumour cell lines relative to isotype control (dashed line). Data are representative of two independent experiments. b, T cell killing assay with non-ovalbumin-expressing control (dashed line), ovalbumin-expressing control (grey) and ovalbuminexpressing B2m-null (purple) B16 cells (n = 3 for effector target ratios 1:20, 1:10 and 1:5 for each condition; data shown are representative of two independent experiments). c, Tumour volume following anti-PD-1 and GVAX treatment of B16 tumours with the genetic perturbations indicated. Data (mean ± s.e.m.) are representative of two independent experiments with n = 5 mice in each group. d, Flow cytometry of immune populations following anti-PD-1 and GVAX treatment of B16 tumours with the genetic perturbations indicated (n = 5 mice per group). Bars represent mean. c, d, Two-sided Student’s t-test; *P < 0.05; **P < 0.01; ***P < 0.001; ****P < 0.0001; NS, not significant.

Comment in

References

    1. Zaretsky JM et al. Mutations associated with acquired resistance to PD-1 blockade in melanoma. N. Engl. J. Med 375, 819–829 (2016). - PMC - PubMed
    1. Gao J et al. Loss of IFN-γ pathway genes in tumor cells as a mechanism of resistance to anti-CTLA-4 therapy. Cell 167, 397–404 (2016). - PMC - PubMed
    1. Yoshihama S et al. NLRC5/MHC class I transactivator is a target for immune evasion in cancer. Proc. Natl Acad. Sci. USA 113, 5999–6004 (2016). - PMC - PubMed
    1. Sade-Feldman M et al. Resistance to checkpoint blockade therapy through inactivation of antigen presentation. Nat. Commun 8, 1136 (2017). - PMC - PubMed
    1. Manguso RT et al. In vivo CRISPR screening identifies Ptpn2 as a cancer immunotherapy target. Nature 547, 413–418 (2017). - PMC - PubMed

MeSH terms