. 2019 Mar;4(3):470-479.
doi: 10.1038/s41564-018-0321-5. Epub 2018 Dec 17.

Genomic variation and strain-specific functional adaptation in the human gut microbiome during early life

Affiliations

Genomic variation and strain-specific functional adaptation in the human gut microbiome during early life

Tommi Vatanen et al. Nat Microbiol. 2019 Mar.

Erratum in

Abstract

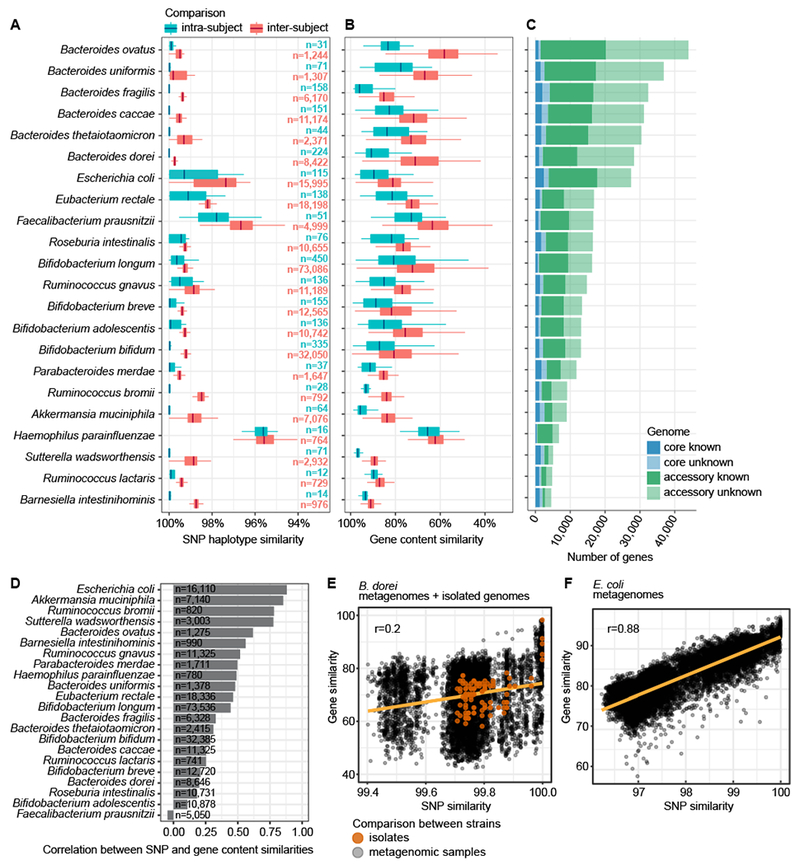
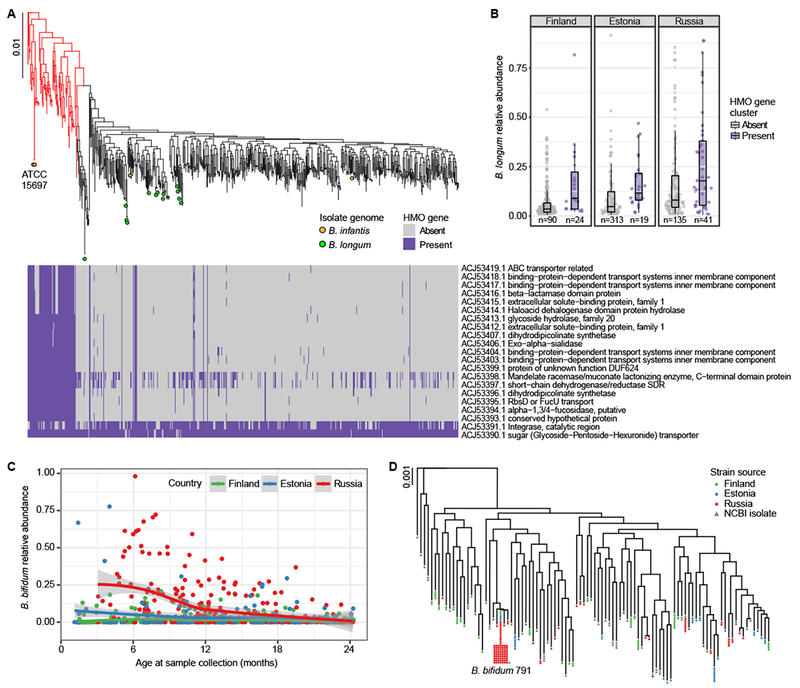
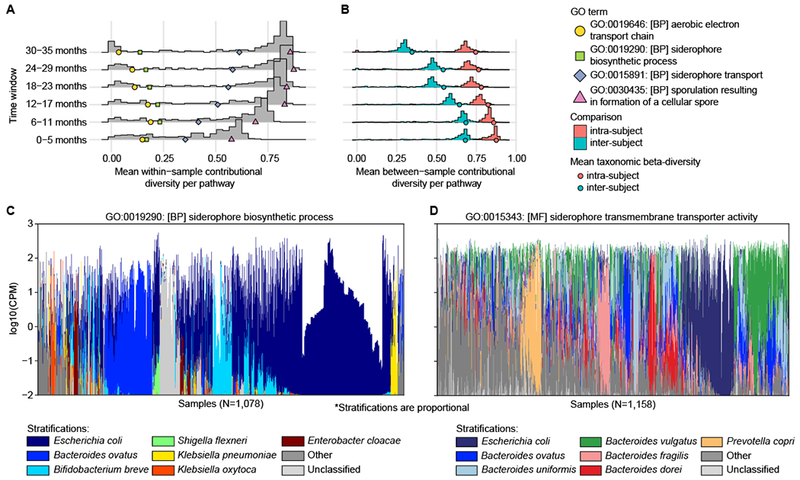
The human gut microbiome matures towards the adult composition during the first years of life and is implicated in early immune development. Here, we investigate the effects of microbial genomic diversity on gut microbiome development using integrated early childhood data sets collected in the DIABIMMUNE study in Finland, Estonia and Russian Karelia. We show that gut microbial diversity is associated with household location and linear growth of children. Single nucleotide polymorphism- and metagenomic assembly-based strain tracking revealed large and highly dynamic microbial pangenomes, especially in the genus Bacteroides, in which we identified evidence of variability deriving from Bacteroides-targeting bacteriophages. Our analyses revealed functional consequences of strain diversity; only 10% of Finnish infants harboured Bifidobacterium longum subsp. infantis, a subspecies specialized in human milk metabolism, whereas Russian infants commonly maintained a probiotic Bifidobacterium bifidum strain in infancy. Groups of bacteria contributing to diverse, characterized metabolic pathways converged to highly subject-specific configurations over the first two years of life. This longitudinal study extends the current view of early gut microbial community assembly based on strain-level genomic variation.


Conflict of interest statement

Competing Interests

The authors declare no competing interests.

Figures

Figure 1.
Figure 1.. Strain diversity across species in early gut metagenomes.
A SNP haplotype similarities per species based on all pairwise comparisons (dominant strain per species per sample) and stratified to intra-subject and inter-subject comparisons. Species containing >10 comparisons in both strata are shown. B Gene content similarities (the percentage of shared genes in the smallest of the two genomes) per species, evaluated on pangenomes generated by metagenomic assembly. Boxplots as in panel A. The box (A, B) shows the interquartile range (IQR), the vertical line shows the median and the whiskers show the range of the data (up to 1.5 times IQR). Sample size (n) per boxplot in panel A gives number of comparisons per panels A and B. C The size of core and accessory genomes per species stratified by the functional annotation of genes using eggNOG. Panels A-C are ordered according to the size of the metagenomic pangenome. D Pearson’s correlation coefficients between SNP- and gene content-based similarity measures between strains. Sample size (n) is indicated. E B. dorei strains’ SNP and gene content similarities show low Pearson’s correlation (r=0.2, n=8646 comparisons from metagenomes, n=136 comparisons of isolate genomes). Comparisons between isolate genomes are shown in orange for reference. F E. coli strains’ SNP and gene content similarities (Pearson’s r=0.88, n=16,110 comparisons).
Figure 2.
Figure 2.. Bifidobacterium strains in DIABIMMUNE children.
A Phylogenetic tree of B. longum strains in DIABIMMUNE stool samples and 18 NCBI B. longum isolate genomes based on SNP haplotypes. Highlighted B. infantis strains (red) include two reference sequences (ATCC 15697). The heatmap illustrates strain-specific carriage of 21 genes in the B. infantis HMO gene cluster responsible for intracellular HMO degradation, evaluated using the metagenomic data. B B. longum relative abundance stratified by country and B. longum strain; B. infantis (highlighted red in panel A) has, on average, higher relative abundance compared to other B. longum strains (mixed effects logistic regression p=0.00049). The box shows the interquartile range (IQR), the vertical line shows the median and the whiskers show the range of the data (up to 1.5 times IQR). Number of samples (n) are indicated below each box and include samples from subjects with no breastfeeding information. C Relative abundance of B. bifidum longitudinally stratified by the countries up to 24 months of age (n = 864). Russians have more B. bifidum, especially during the first year of life. The curves show locally weighted scatterplot smoothing (LOESS) fits for the relative abundances, and shaded areas show 95% confidence interval for each fit, as implemented in geom_smooth function in ggplot2 R package. D Phylogenetic tree of B. bifidum strains in the DIABIMMUNE stool samples based on SNP haplotypes. Strains with >99.5% sequence similarity have been collapsed into a single tip. A known strain, B. bifidum 791, was found in 79 stool samples. The scale bars on phylogenetic trees denote difference in sequence similarity of SNP haplotypes.
Figure 3.
Figure 3.. Contributional diversity of microbial pathways.
A-B We applied alpha- (A) and beta-diversity (B) to the distribution of species contributing to functional categories (GO biological process terms), measuring their contributional diversities. The histograms show the mean alpha- (A) and beta-diversities (B) per GO term stratified by time windows. Colored shapes show (A) examples of pathways with different trends and (B) mean intra- and inter-subject beta-diversities of taxonomic profiles. C-D Species contributing to (C) siderophore biosynthetic process and (D) siderophore transport. Colors displaying the contributions of individual species are linearly scaled within the log-scaled total bar height depicting the total abundance of the pathway.

References

    1. Kundu P, Blacher E, Elinav E & Pettersson S Our Gut Microbiome: The Evolving Inner Self. Cell 171, 1481–1493, doi: 10.1016/j.cell.2017.11.024 (2017). - DOI - PubMed
    1. Backhed F et al. Dynamics and Stabilization of the Human Gut Microbiome during the First Year of Life. Cell Host Microbe 17, 690–703, doi: 10.1016/j.chom.2015.04.004 (2015). - DOI - PubMed
    1. Chu DM et al. Maturation of the infant microbiome community structure and function across multiple body sites and in relation to mode of delivery. Nat Med 23, 314–326, doi: 10.1038/nm.4272 (2017). - DOI - PMC - PubMed
    1. Bach JF The hygiene hypothesis in autoimmunity: the role of pathogens and commensals. Nat Rev Immunol 18, 105–120, doi: 10.1038/nri.2017.111 (2018). - DOI - PubMed
    1. Haahtela T et al. The biodiversity hypothesis and allergic disease: world allergy organization position statement. World Allergy Organ J 6, 3, doi: 10.1186/1939-4551-6-3 (2013). - DOI - PMC - PubMed

Publication types

MeSH terms