. 2019 Feb;15(2):132-140.
doi: 10.1038/s41589-018-0188-z. Epub 2018 Dec 17.

Structural basis of 7SK RNA 5'-γ-phosphate methylation and retention by MePCE

Affiliations

Structural basis of 7SK RNA 5'-γ-phosphate methylation and retention by MePCE

Yuan Yang et al. Nat Chem Biol. 2019 Feb.

Abstract

Among RNA 5'-cap structures, γ-phosphate monomethylation is unique to a small subset of noncoding RNAs, 7SK and U6 in humans. 7SK is capped by methylphosphate capping enzyme (MePCE), which has a second nonenzymatic role as a core component of the 7SK ribonuclear protein (RNP), an essential regulator of RNA transcription. We report 2.0- and 2.1-Å X-ray crystal structures of the human MePCE methyltransferase domain bound to S-adenosylhomocysteine (SAH) and uncapped or capped 7SK substrates, respectively. 7SK recognition is achieved by protein contacts to a 5'-hairpin-single-stranded RNA region, thus explaining MePCE's specificity for 7SK and U6. The structures reveal SAH and product RNA in a near-transition-state geometry. Unexpectedly, binding experiments showed that MePCE has higher affinity for capped versus uncapped 7SK, and kinetic data support a model of slow product release. This work reveals the molecular mechanism of methyl transfer and 7SK retention by MePCE for subsequent assembly of 7SK RNP.


Conflict of interest statement

Declaration of Interests

The authors declare no competing interests.

Figures

Fig. 1.
Fig. 1.
MePCE binds and caps 7SK. a. S-adenosylmethionine (SAM) cofactor, shown with methyl sulfonium group as (S) stereoisomer. Chemical bonds colored pink, sulfur colored yellow, and methyl group colored blue. b. Proposed transfer reaction mechanism of SAM methyl to RNA 5′ γ-phosphate oxygen by MePCE. c. Cartoon schematic of proposed secondary structure of 7SK, linear model. inset: sequence and secondary structure of SL1p used in this study. Residues involved in MePCE interactions are colored by nucleotide (adenine is pink, guanine is gold, uridine is cyan, cytidine is purple). Native residues not involved in protein binding are colored black and non-native residues are colored gray. d. 1H-13C HMQC spectra of free [methyl-13C]-SAM (top) and the quantitatively capped 7SK [methyl-13C]-SL1p. The two peaks for free [methyl-13C]-SAM are from the (S,S) and (R,S) diastereomers. The unique resonance of meSL1p methyl has chemical shift values of 3.65 ppm (1H) and 56.0 ppm (13C).
Fig. 2.
Fig. 2.
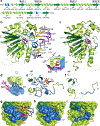
Structural changes in MePCEMT on binding RNA. a. Secondary structure boundaries of MePCEMT. β-strands are colored dark green, α-helices and loops are colored lime, and loops that become ordered on binding RNA are colored blue. b. Crystal structure of MePCE–SAH–me7SK, with SAH colored pink and meSL1p colored as in Fig. 1a. The methyl carbon is colored cyan. meSL1p and SAH are shown as ball and stick and MePCEMT is shown as cartoon. Inset: Cube representation of the active site topology, defined by helix α0 at the floor, helix α5′ to the left, helix α6′ at the ceiling, the β-sheet edge at the back, helix α7 to the right, and SL1p at the front, as seen from the back wall. c. Crystal structure of MePCE–SAH (PDB ID 5UNA). d. The triphosphate-binding tunnel formed by helix α0 and α7 (blue) and helix α5′ and α6′ (green) in MePCE–SAH–7SK structure. Protein residues are shown in transparent surface representation. RNA residue Gua1 and SAH are shown as ball and stick. e–f. MePCEMT N- and C-terminal loops in the presence (e) of SL1p h are structured and form α0 and α7 helices (colored blue), while in the absence (f) of SL1p are disordered (represented as dashed blue lines). g–h. Surface representations of MePCE–SAH–7SK. (g) SAH is buried by MePCEMT N- and C-terminal regions and SL1p. (h) Removal of SL1p RNA visually reveals the sulfur atom of SAH at the base of the triphosphate-binding tunnel. (i) SAH is solvent accessible in the absence of bound RNA for MePCE–SAH (PDB ID 5UNA).
Fig. 3.
Fig. 3.
Sequence- and structure-specific recognition of 7SK by MePCEMT a. Schematic showing the specific interactions between MePCEMT and 7SK SL1p. α0 is indicated as blue circle with RNA-interacting residues as spokes around the helix (Tyr wheel), locations of other helices are shown with curved lines, and SAH is highlighted with a magenta oval. Dashed lines represent H-bonds and blue dashed lines represent water-mediated H-bonds. Bold lines represent stacking interactions. b–e. Interactions between MePCEMT and pppGua1 for (b) γ-phosphate, (c) β-phosphate, (d) α-phosphate, and (e) Gua1 nucleotide. f. Tyr wheel in helix α0 and adjacent loop recognizes the helix-single-stranded junction of SL1p. Surface, stick and cartoon are shown for the Tyr residues and K420, and RNA residues are shown in ball and stick. g. Active site residues that participate in specific stacking and H-bonding interactions that stabilize helices α0 and α7. h. Protein residues that interact with Gua2 nucleotide and backbone. i–m. Interactions between MePCEMT and the single-stranded RNA nucleotides Ade109 (i); Ura110 (j); Gua111 (k); Ura112 (l); Gua113 and Cyt114 (m).
Fig. 4.
Fig. 4.
Active site of MePCEMT organizes cofactor and triphosphate in near transition state. a. Surface representation of the cofactor binding cleft in MePCE–SAH–7SK. MePCEMT is shown in gray cartoon. Surface coloring is identical to that in Fig. 2. b. Overlay of MePCE–SAH–7SK and MePCE–SAH–me7SK structures highlighting the positions of SAH and γ-phosphate in the active site. In MePCE–SAH–7SK, SAH is magenta and phosphorus atoms are gold; in MePCE–SAH–me7SK, SAH is blue and phosphorus atoms are orange with the methyl group in cyan. c. Triphosphate binding residues position the γ-phosphate oxygen in line with SAH sulfur in MePCE–SAH–7SK. The triphosphate-binding tunnel is shown as surface representation colored as in Fig. 2. d. Specific H-bonding and stacking interactions between the SAH adenosyl group and MePCEMT. e. H-bonds between SAH homocysteine group and MePCEMT. f. vdW radii of sulfur atom and γ-phosphate oxygen atom in MePCE–SAH–7SK showing the direct contact between the two. g. vdW radii of sulfur atom and methyl carbon atom in MePCE–SAH–me7SK showing the slight overlap between the two atoms. h. Positions of SAH sulfur, γ-mePi, and Y421 in MePCE–SAH–me7SK, with hypothetical position of SAM methyl group shown as transparent ball. Y421 stacks above path of methyl transfer. Atoms colored as in (g). i. Methyltransferase activities of wild type (wt) MePCEMT and point substitutions K585A (α0), F674A (α5′) and Y421A (α7) using SL1p as RNA substrate. All activities are within one turnover and are scaled relative to wt. Dots indicate values for each of the three independent reactions; bars indicate mean values; error bars are s.d. of three independent reactions performed for each protein construct. The single factor ANOVA1 test was used to compute the p-values, and the exact p-values are: 0.000041 (Y421A), 0.0000077 (K585A) and 0.0000072 (F674A).
Fig. 5.
Fig. 5.
MePCEMT multiple turnover kinetics and binding experiments reveal product and byproduct inhibition and retention. a. MePCEMT activity assay show nonlinear progress curves for varying concentrations of SL1p. Error bars are standard deviations for three independent reactions for time points ≥ 5 min. Time points taken at 1.5 min and 3 min were performed once. Data points reflect mean values for time points ≥ 5 min. The solid lines are best fits to equation 1 (see Online Methods). b–c. ITC data and plots of MePCEMT binding to RNA substrates SL1p (b) and methylated SL1p (c). 3 equivalents of SAH were added to MePCEMT in the ITC experiments, and the numbers of replicates are included in Supplementary Table 3d. Sequence and secondary structures of three RNA constructs assayed for MePCEMT binding. e. Methyltransferase apparent activity (observed sum of single-turnover and product-inhibited activity) of MePCEMT with different RNA substrates or with inhibitors added under multiple turnover conditions. The two sets of plots indicate two sets of experiments, each performed with one enzyme stock with a SL1p control. All activities are measured in three independent reactions and the averages are scaled to the SL1p in the absence of Mg2+. Dots indicate values for each of the three independent reactions; bars indicate mean values; error bars are s.d. from the three reactions. The single factor ANOVA1 test was used to compute the p-values, and the exact p-values are shown on the graph.

References

    1. Byszewska M, Śmietański M, Purta E & Bujnicki JM RNA methyltransferases involved in 5’ cap biosynthesis. RNA Biol 11, 1597–1607 (2014). - PMC - PubMed
    1. Schapira M Structural chemistry of human RNA methyltransferases. ACS Chem Biol 11, 575–582 (2016). - PubMed
    1. Singh R & Reddy R Gamma-monomethyl phosphate: a cap structure in spliceosomal U6 small nuclear RNA. Proc Natl Acad Sci USA 86, 8280–8283 (1989). - PMC - PubMed
    1. Shumyatsky GP, Tillib SV & Kramerov DA B2 RNA and 7SK RNA, RNA polymerase III transcripts, have a cap-like structure at their 5′ end. Nucleic Acids Res 18, 6347–6351 (1990). - PMC - PubMed
    1. Shimba S, Buckley B, Reddy R, Kiss T & Filipowicz W Cap structure of U3 small nucleolar RNA in animal and plant cells is different. gamma-Monomethyl phosphate cap structure in plant RNA. J. Biol. Chem 267, 13772–13777 (1992). - PubMed

Publication types