

doi: 10.1038/s41592-018-0238-1.
Epub 2018 Dec 17.
Imaging cellular ultrastructures using expansion microscopy (U-ExM)
Affiliations
- PMID: 30559430
- PMCID: PMC6314451
- DOI: 10.1038/s41592-018-0238-1
Item in Clipboard
Imaging cellular ultrastructures using expansion microscopy (U-ExM)
Nat Methods.
2019 Jan.
Abstract
Determining the structure and composition of macromolecular assemblies is a major challenge in biology. Here we describe ultrastructure expansion microscopy (U-ExM), an extension of expansion microscopy that allows the visualization of preserved ultrastructures by optical microscopy. This method allows for near-native expansion of diverse structures in vitro and in cells; when combined with super-resolution microscopy, it unveiled details of ultrastructural organization, such as centriolar chirality, that could otherwise be observed only by electron microscopy.
Conflict of interest statement
Authors declare no competing interests.
Figures
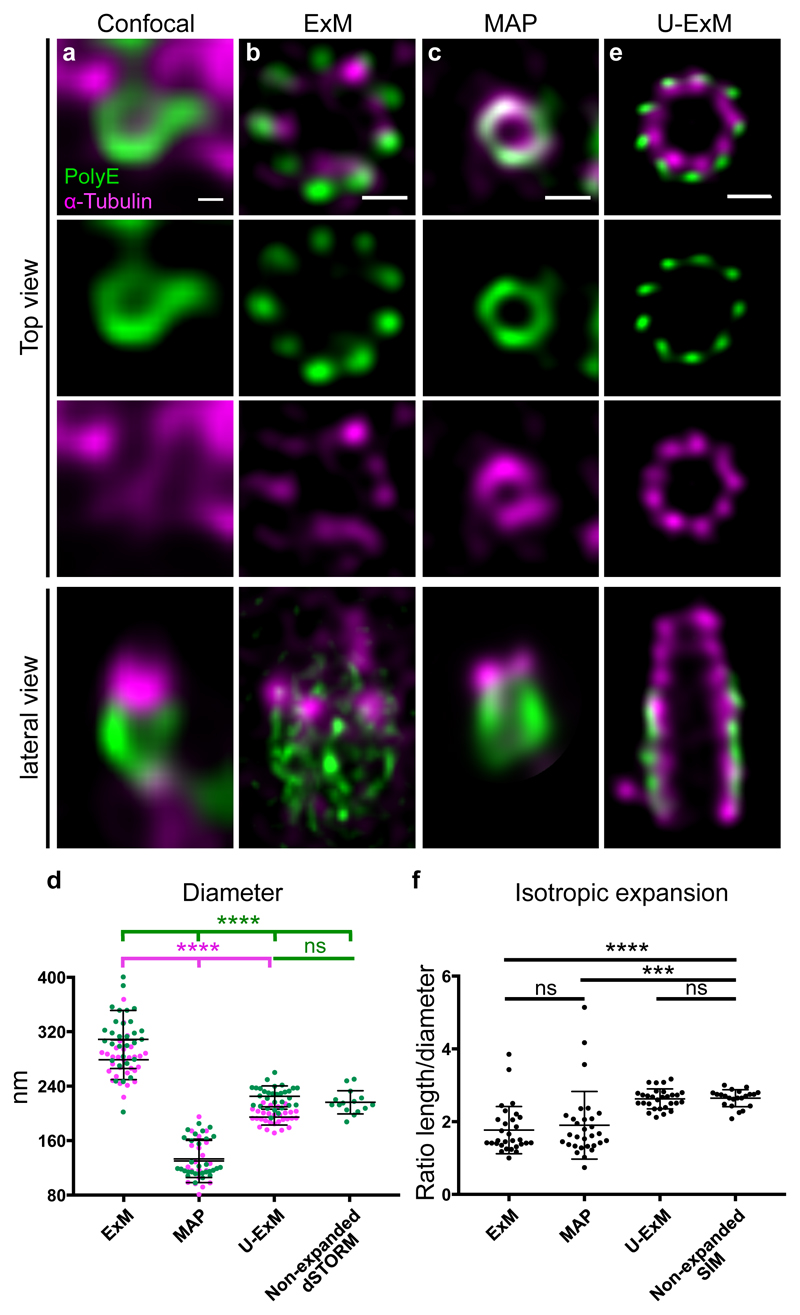
(a-d) Non-expanded (a) and expanded (b-d) isolated centrioles stained with PolyE (green, Alexa488) and α-tubulin (magenta, Alexa568) imaged by confocal microscopy followed by HyVolution. Centrioles were expanded using ExM (b), MAP (c) or U-ExM (e). Scale bar in a: 100nm and b, c, e: 450nm. Representative images from 2 independent experiments (a) and 3 independent experiments (b, c, e). (d) Diameter of the centrioles in the different conditions. Green and magenta dots represent PolyE and α-tubulin diameters, respectively. Averages and standard deviation are as follows: PolyE: 308 nm ± 42 nm, 133 nm ± 27 nm, 225 nm ± 15 nm and 216 nm ± 17 for ExM, MAP, U-ExM and non-expanded dSTORM respectability. N= 30 centrioles for each condition (data from 3 independent experiments) except dSTORM where n= 15 non-expanded centrioles (1 experiment). α-tubulin: 279 nm ± 29, 130 nm ± 32 nm and 195 ± 12, for ExM (n= 29 centrioles), MAP (n= 20 centrioles) and U-ExM (n= 29 centrioles) respectability. Data from 3 independent experiments. Statistical significance was assessed by one-way ANOVA test: ****<0.0001, ns (non significant)=0.77. (f) Isotropic expansion measured as the ratio between the centriolar length and diameter. Average ratios and standard deviation are as follows: ExM=1.8 +/- 0.6 (n= 30 centrioles), MAP=1.9+/- 0.9 (n= 30 centrioles), U-ExM=2.6+/- 0.3 (n= 29 centrioles), Non-expanded SIM=2.6 +/- 0.2 (n= 22 centrioles). Data from 3 independent experiments except for SIM where it comes from a single experiment. Statistical significance was assessed by one-way ANOVA test: ****<0.0001, ***=0.0002, ns (non-significant)=0.84 for ExM vs MAP and 0.99 for U-ExM vs Non-Expanded SIM.
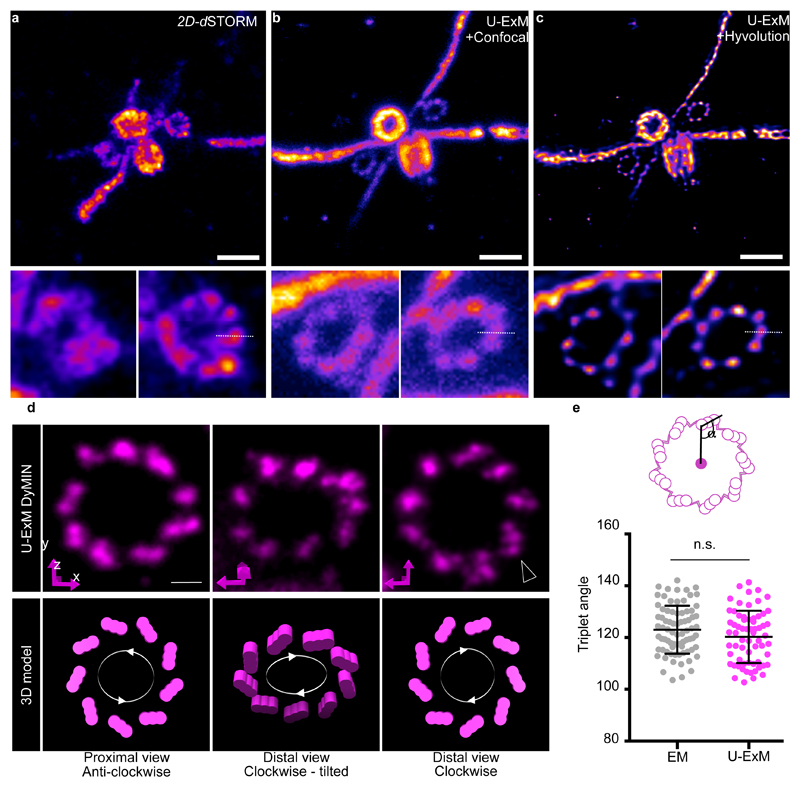
(a) 2D dSTORM image of an isolated centriole. Scale bar: 250nm. (b) Confocal image of an expanded centriole using U-ExM (0.7%FA+1%AA). (c) Deconvoluted image in (b) using Hyvolution. Scale bar in (b, c): 1µm. Insets show the two procentrioles of the above image. The dotted white lines correspond to the plot line profile used to calculate the full width at half maximum (FWHM) shown in Supplementary Fig. 5i-k. Representative images from 1 experiment (a) and 3 independent experiments (b-c). (d) Representative DyMIN images of procentrioles stained for α-tubulin (magenta, STAR RED) highlighting their anticlockwise or clockwise orientations. Below is the interpretation of such orientations in a 3D schematic model. Black arrowheads points to individual blades within a microtubule triplet (11 out of 90 procentrioles). Representative images from 2 independent experiments. Scale bar: 200nm. (e) Quantification of the angle between the center of the centriole and the microtubule triplet both from EM (123° ± 9°) (n= 77 triplets) and DyMIN (120° ± 10°) (n=65 triplets) images. Indicated values in brackets are averages with their associated standard errors. Unpaired two-tailed t test was as performed: P=0.0912.
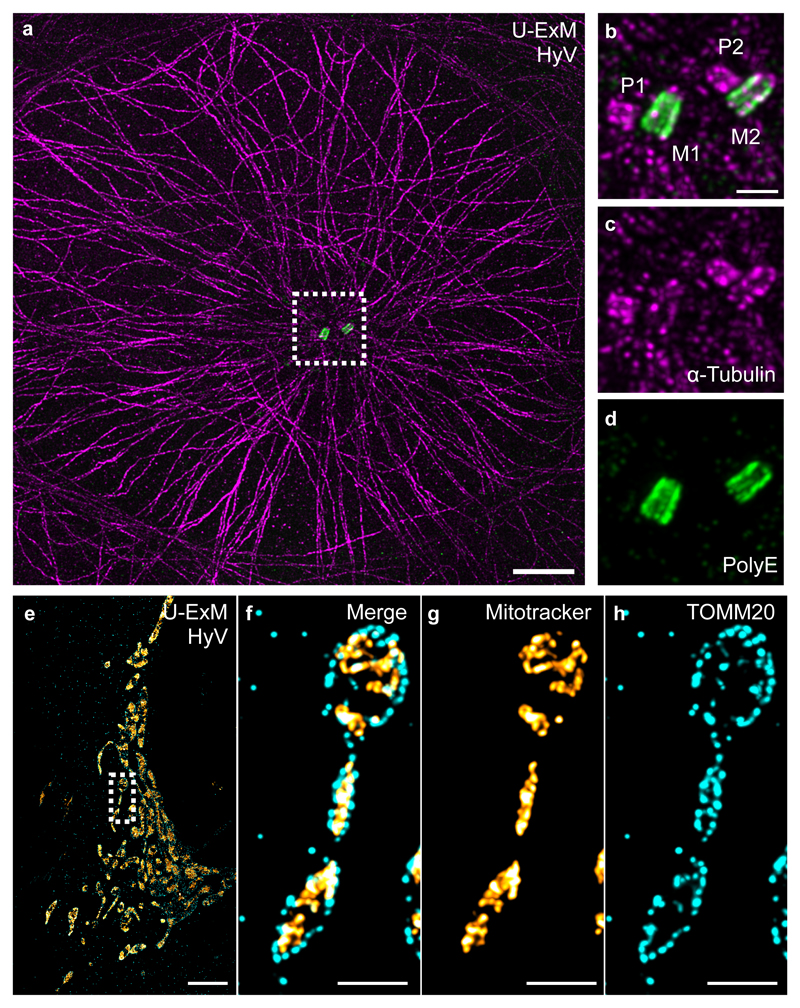
(a) Representative Hyvolution confocal image of a U2OS cell fixed with methanol, expanded with U-ExM, and stained for α-tubulin (magenta) and PolyE (green). Scale bar: 10μm. (b-d) Insets (dotted square in a) show the centriolar pair, P: procentriole, M: mature centriole. Scale bar: 2μm. Representative images from 3 independent experiments. (e-h) Representative Hyvolution confocal image of a U2OS cell fixed with PFA/GA and stained for MitoTracker (orange) and the outer membrane mitochondrial translocase TOMM20 (cyan). Scale bar: 12μm. The dotted square shows a zoom of the highlighted region. Note that as expected TOMM20 signal is surrounding the MitoTracker signal. Scale bar: 3μm. Representative images from 1 experiment.
References
Publication types
MeSH terms
LinkOut - more resources
Full Text Sources
Other Literature Sources
