. 2019 Jan;22(1):57-64.
doi: 10.1038/s41593-018-0289-8. Epub 2018 Dec 17.

Tau impairs neural circuits, dominating amyloid-β effects, in Alzheimer models in vivo

Affiliations

Tau impairs neural circuits, dominating amyloid-β effects, in Alzheimer models in vivo

Marc Aurel Busche et al. Nat Neurosci. 2019 Jan.

Abstract

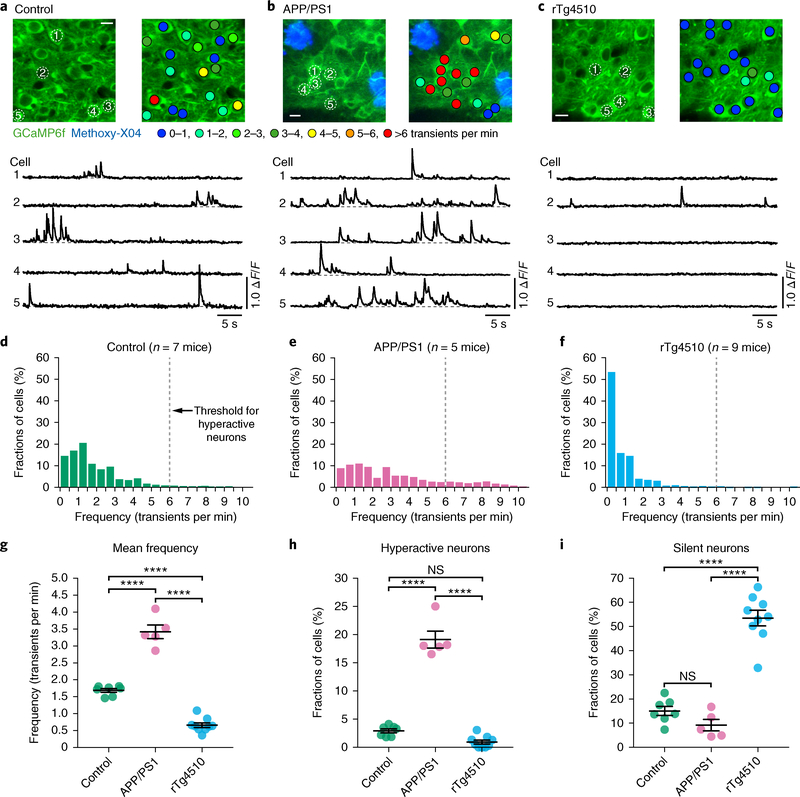
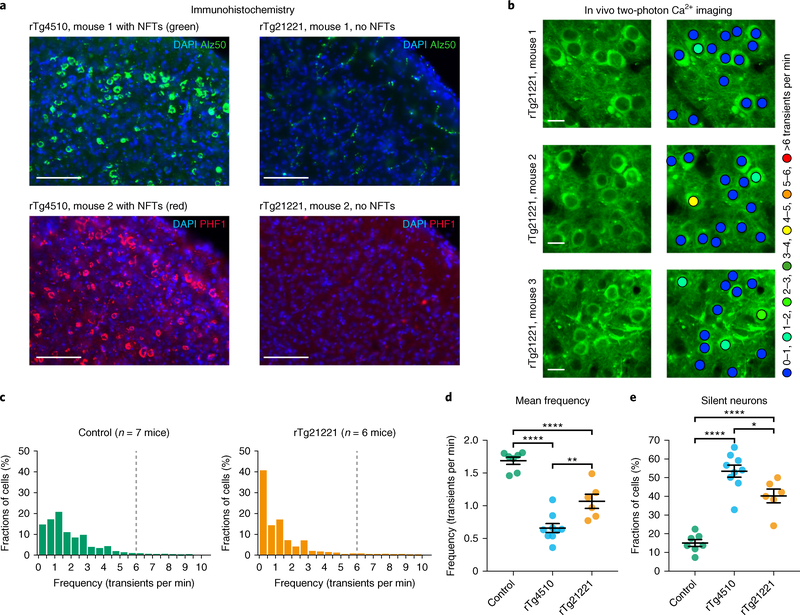
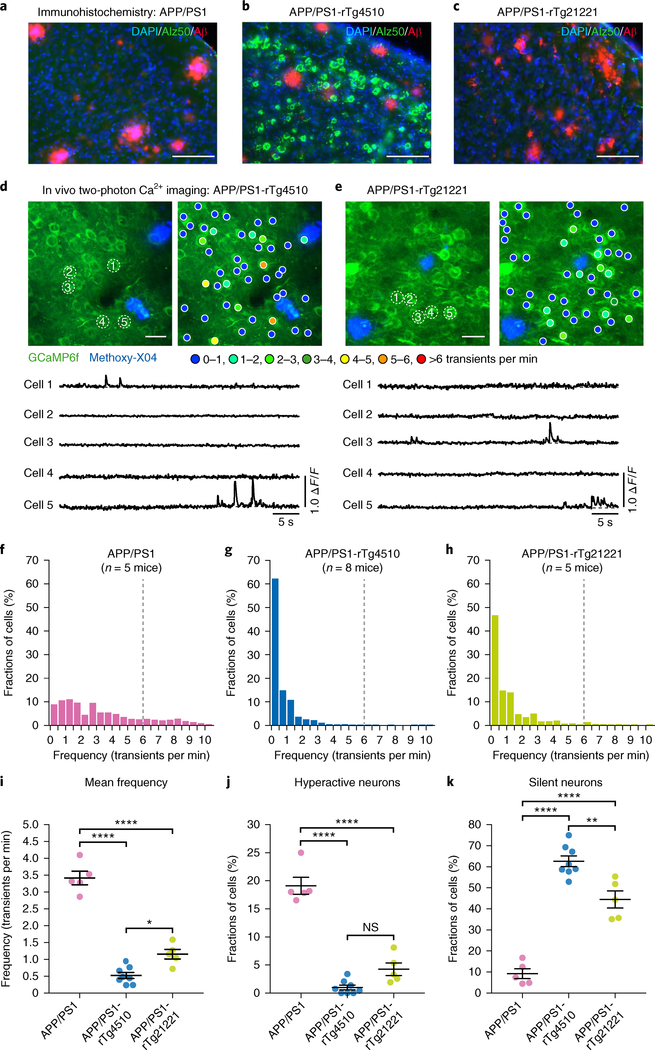
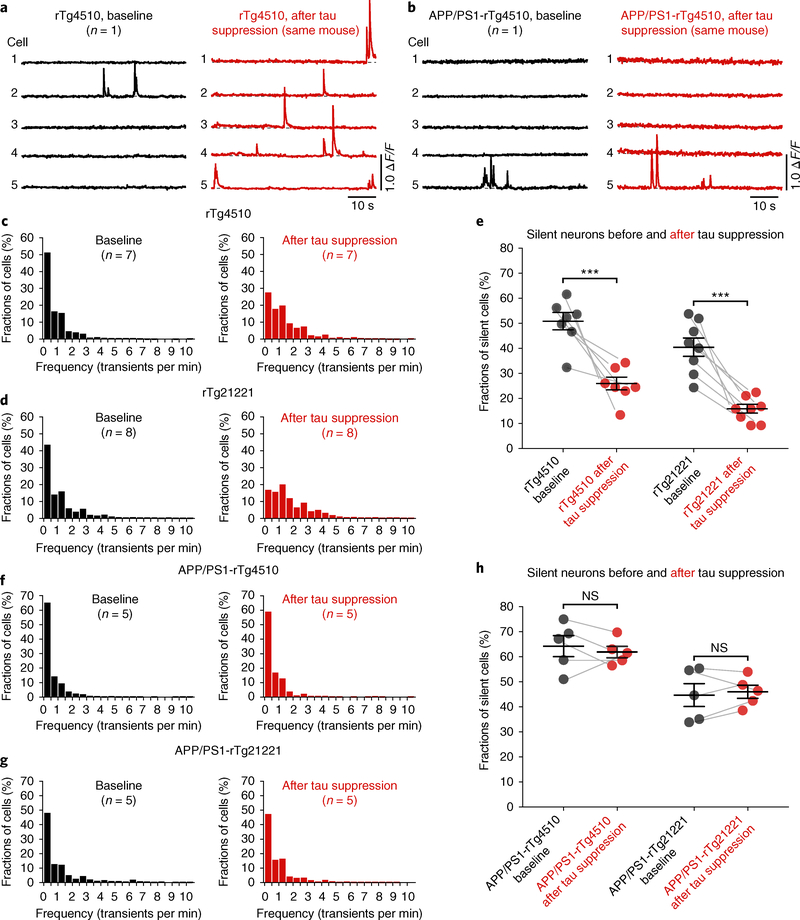
The coexistence of amyloid-β (Aβ) plaques and tau neurofibrillary tangles in the neocortex is linked to neural system failure and cognitive decline in Alzheimer's disease. However, the underlying neuronal mechanisms are unknown. By employing in vivo two-photon Ca2+ imaging of layer 2/3 cortical neurons in mice expressing human Aβ and tau, we reveal a dramatic tau-dependent suppression of activity and silencing of many neurons, which dominates over Aβ-dependent neuronal hyperactivity. We show that neurofibrillary tangles are neither sufficient nor required for the silencing, which instead is dependent on soluble tau. Surprisingly, although rapidly effective in tau mice, suppression of tau gene expression was much less effective in rescuing neuronal impairments in mice containing both Aβ and tau. Together, our results reveal how Aβ and tau synergize to impair the functional integrity of neural circuits in vivo and suggest a possible cellular explanation contributing to disappointing results from anti-Aβ therapeutic trials.


Conflict of interest statement

Competing interests

The authors declare no competing interests.

Figures

Fig. 1 |
Fig. 1 |. Neuronal hyperactivity in APP/PS1 mice but silencing in rTg4510 tau mice.
a-c, Top, in vivo two-photon fluorescence images of GCaMP6f-expressing (green) layer 2/3 neurons in the parietal cortex and corresponding activity maps from wild-type controls (a), APP/PS1 (b), and rTg4510 (c) mice. In APP/PS1 mice, plaques were labeled with methoxy-X04 (blue); in the activity maps, neurons were color-coded as a function of their mean activity. Scale bars, 10 μm. Bottom, spontaneous Ca2+ transients of neurons indicated in the top panel. d-f, Frequency distributions of all recorded neurons in controls (d; green, n = 1,705 neurons in 7 mice), APP/PS1 (e; magenta, n = 878 neurons in 5 mice), and rTg4510 mice (f; light blue, n = 1,771 neurons in 9 mice). The dashed line at 6 transients per min indicates the threshold used to identify hyperactive neurons; silent neurons exhibit 0 transients per min. g, Mean neuronal frequencies for controls (1.69 ± 0.05 transients per min), APP/PS1 (3.42 ± 0.20 transients per min), and rTg4510 (0.66 ± 0.07 transients per min); F(2,18) = 171.2, P = 1.93 × 10⁻¹². All post hoc multiple comparisons between genotypes were highly significant: P = 5.42 × 10⁻⁹ for controls vs. APP/ PS1, P = 1.38 × 10⁻⁶ for controls vs. rTg4510, and P = 1.01 × 10⁻¹² for APP/PS1 vs. rTg4510. h, Fractions of hyperactive neurons. Controls: 2.91 ± 0.35%, APP/PS1: 19.11 ± 1.50%, rTg4510: 0.93 ± 0.35%; F(2,18) = 176.2, P = 1.51 × 10⁻¹². Post hoc multiple comparisons were P = 2.84 × 10⁻¹¹ for controls vs. APP/PS1, P = 1.64 × 10⁻¹² for APP/PS1 vs. rTg4510 and not significant, P = 0.1045, for controls vs. rTg4510. i, Fractions of silent neurons. Controls: 15.05 ± 1.87%, APP/PS1: 9.20 ± 2.36%, rTg4510: 53.48±3.24%; F(2,18) = 77.18, P = 1.48 × 10⁻⁹. Post hoc multiple comparisons were P = 2.02 × 10⁻⁸ for controls vs. rTg4510 and P = 1.08 × 10⁻⁸ for APP/PS1 vs. rTg4510 and not significant, P = 0.3972, for controls vs.s APP/PS1. Each solid circle represents an individual animal (controls, n = 7; APP/PS1, n = 5; rTg4510, n = 9) and all error bars reflect the mean ± s.e.m; the differences between genotypes were assessed by one-way ANOVA followed by Tukey’s multiple comparisons test, ****P < 0.0001. NS, not significant.
Fig. 2 |
Fig. 2 |. NFTs are not required for neuronal silencing.
a, Coronal sections showing many Alz50-positive (top, green) and PHF1-positive (bottom, red) NFTs in the cortex of rTg4510 mice (n = 4 mice, 8–10 sections per mouse were analyzed), but not in rTg21221 mice (n = 4 mice, 5–12 sections per mouse were analyzed). Nuclei are visualized with DAPI (blue). Scale bars, 100 μm. b, In vivo two-photon fluorescence images of GCaMP6f-expressing (green) layer 2/3 neurons and corresponding activity maps from three example rTg21221 mice illustrating the marked silencing of many neurons. Scale bars, 10 μm. c, Frequency distributions of all recorded neurons in wild-type controls (left panel, green, n = 1,705 neurons in 7 mice) and rTg21221 mice (right panel, orange, n = 1,021 neurons in 6 mice). d, Mean frequency of silent neurons. Controls: 1.69 ± 0.05 transients per min; rTg4510: 0.66 ± 0.07 transients per min; rTg21221: 1.07 ± 0.11 transients per min. F(2,19) = 48.43, P = 3.47 × 10⁻⁸. All post hoc multiple comparisons between genotypes were significant: P = 2.01 × 10⁻⁸ for controls vs. rTg4510, P = 1.00 × 10⁻⁴ for controls vs. rTg21221, P = 0.0038 for rTg4510 vs. rTg21221. e, Fractions of silent neurons. Controls: 15.05 ± 1.87%; rTg4510: 53.48 ± 3.24%; rTg21221: 40.25 ± 3.64%. F(2,19) = 42.94, P = 8.94 × 10⁻⁸. All post hoc multiple comparisons between genotypes were significant: P = 5.55 × 10⁻⁸ for controls vs. rTg4510, P = 7.85 × 10⁻⁵ for controls vs. rTg21221, P = 0.0179 for rTg4510 vs. rTg21221. The data for the controls and rTg4510 mice are the same as in Fig. 1. Each solid circle represents an individual animal and all error bars reflect the mean ± s.e.m; the differences between genotypes were assessed by one-way ANOVA followed by Tukey’s multiple comparisons test, *P < 0.05, **P < 0.01, ****P < 0.0001.
Fig. 3 |
Fig. 3 |. No hyperactivity and many silent neurons in mice harboring both tau and Aβ.
a-c, Coronal sections showing the coexistence of NFTs (green) and Aβ plaques (red) in the cortex of APP/PS1-rTg4510 mice (b), but only plaques in APP/PS1 (a) and APP/PS1-rTg21221 (c) mice. Immunostaining was repeated independently in multiple animals (APP/PS1, n = 7; APP/PS1-rTg4510, n = 15; APP/PS1-rTg21221, n = 13) with similar results. Scale bars, 100 μm. d,e, Top: in vivo two-photon fluorescence images of layer 2/3 neurons and corresponding activity maps from APP/PS1-rTg4510 (d) and APP/PS1-rTg21221 (e) mice. Methoxy-X04-labeled plaques are shown in blue. Bottom: spontaneous Ca2+ transients of neurons indicated in the top panel. Scale bars, 20 μm. f-h, Frequency distribution of all recorded neurons in APP/PS1 (f, n = 878 neurons in 5 mice), APP/PS1-rTg4510 (g, n = 2,092 neurons in 8 mice) and APP/PS1-rTg21221 mice (h, n = 1,050 neurons in 5 mice). i, Summary graph representing the mean frequencies. APP/PS1: 3.42 ± 0.20 transients per min; APP/PS1-rTg4510: 0.52 ± 0.09 transients per min; APP/PS1-rTg21221: 1.16 ± 0.14 transients per min. F(2,15) = 119.9, P = 5.96 × 10⁻¹⁰. All post hoc multiple comparisons between genotypes were significant: P = 4.36 × 1 0−10 for APP/PS1 vs. APP/PS1-rTg4510; P = 5.64 × 10⁻⁸ for APP/PS1 vs. APP/PS1-rTg21221; P = 0.012 for APP/PS1-rTg4510 vs. APP/PS1-rTg21221. j, Fractions of hyperactive neurons. APP/PS1: 19.11 ± 1.50%; APP/PS1-rTg4510: 1.00 ± 0.43%; APP/PS1-rTg21221: 4.25 ± 1.13%. F(2,15) = 98.35, P = 2.39 × 10⁻⁹. Post hoc multiple comparisons were highly significant: P = 2.02 × 10⁻⁹ for APP/PS1 vs. APP/PS1-rTg4510 as well as APP/PS1 vs. APP/PS1-rTg21221 (P = 1.21 × 10⁻⁷), but not significant (P = 0.065) for APP/PS1-rTg4510 vs. APP/PS1-rTg21221. k, Fractions of silent neurons. APP/PS1: 9.20 ± 2.36%; APP/PS1-rTg4510: 62.61 ± 2.56%; APP/PS1-rTg21221: 44.47 ± 4.10%. F(2,15) = 80.86, P = 9.25 × 10⁻⁹. All post hoc multiple comparisons between genotypes were significant: P = 5.72 × 10⁻⁹ for APP/PS1 vs. APP/PS1-rTg4510; P = 4.87 × 10⁻⁶ for APP/PS1 vs. APP/PS1-rTg21221; and P = 0.002 for APP/PS1-rTg4510 vs. APP/PS1-rTg21221. Data for APP/PS1 mice are the same as shown in Fig. 1. Each solid circle represents an individual animal and all error bars reflect the mean ± s.e.m; the differences among genotypes were assessed by one-way ANOVA followed by Tukey’s multiple comparisons test, *P < 0.05, **P < 0.01, ****P < 0.0001. NS, not significant.
Fig. 4 |
Fig. 4 |. Tau transgene suppression rescues neuronal silencing in tau mice but not in mice with tau and Aβ.
a,b, Example activity traces from neurons before (black) and after (red) tau suppression with DOX in the same rTg4510 (a) and APP/PS1-rTg4510 (b) mice. c,d, Frequency distributions of all recorded neurons from rTg4510 mice (c) before (baseline, n = 1,412 neurons in 7 mice) and after (n = 1,118 neurons in same 7 mice) DOX. The same is shown for rTg21221 mice (d) (before DOX, n = 1,675 neurons in 8 mice; after DOX, n = 1,036 neurons in same 8 mice). e, Fractions of silent neurons in rTg4510 (left; n = 7 mice) and rTg21221 (right; n = 8 mice) before and after DOX (rTg4510 before DOX, 50.84 ± 3.49% vs. after DOX, 25.92 ± 2.57%, t = 5.753, d.f. = 11.03, P = 1.26 × 10⁻⁴; rTg21221 before DOX, 40.45 ± 3.68% vs. after DOX, 15.87 ± 1.74%, t = 6.047, d.f. = 9.972, P = 1.26 × 10⁻⁴). f, Frequency distributions from APP/PS1-rTg4510 mice before (n = 1,262 neurons in 5 mice) and after (n = 827 neurons in same 5 mice) DOX. g, The same is shown for APP/PS1-rTg21221 mice (before DOX, n = 795 neurons in 5 mice; after DOX, n = 904 neurons in the same 5 mice). h, Fractions of silent neurons in APP/PS1-rTg4510 (left; n = 5 mice) and APP/PS1-rTg21221 (right; n = 5 mice) before and after DOX. APP/PS1-rTg4510 before DOX, 64.25 ± 4.21% vs. after DOX, 61.87 ± 2.28%, t = 0.4962, d.f. = 6.152, P = 0.6370. APP/PS1-rTg21221 before DOX, 44.72 ± 4.59% versus after DOX, 46.04 ± 2.64%, t = 0.2494, d.f. = 6.387, P = 0.8109. Each solid circle represents an individual animal and the error bars represent the mean ± s.e.m.; the differences among groups were assessed using two-sided Welch’s t tests, ***P < 0.001. NS, not significant.

References

    1. Hyman BT et al. National Institute on Aging-Alzheimer’s Association guidelines for the neuropathologic assessment of Alzheimer’s disease. Alzheimers Dement. 8, 1–13 (2012). - PMC - PubMed
    1. Braak H & Braak E Neuropathological stageing of Alzheimer-related changes. Acta Neuropathol 82, 239–259 (1991). - PubMed
    1. Arnold SE, Hyman BT, Flory J, Damasio AR & Van Hoesen GW The topographical and neuroanatomical distribution of neurofibrillary tangles and neuritic plaques in the cerebral cortex of patients with Alzheimer’s disease. Cereb. Cortex 1, 103–116 (1991). - PubMed
    1. Scholl M et al. PET imaging of tau deposition in the aging human brain. Neuron 89, 971–982 (2016). - PMC - PubMed
    1. Delacourte A et al. The biochemical pathway of neurofibrillary degeneration in aging and Alzheimer’s disease. Neurology 52, 1158–1165 (1999). - PubMed

Publication types