. 2019 Jan;22(1):106-119.
doi: 10.1038/s41593-018-0288-9. Epub 2018 Dec 17.

GABA and glutamate neurons in the VTA regulate sleep and wakefulness

Affiliations

GABA and glutamate neurons in the VTA regulate sleep and wakefulness

Xiao Yu et al. Nat Neurosci. 2019 Jan.

Abstract

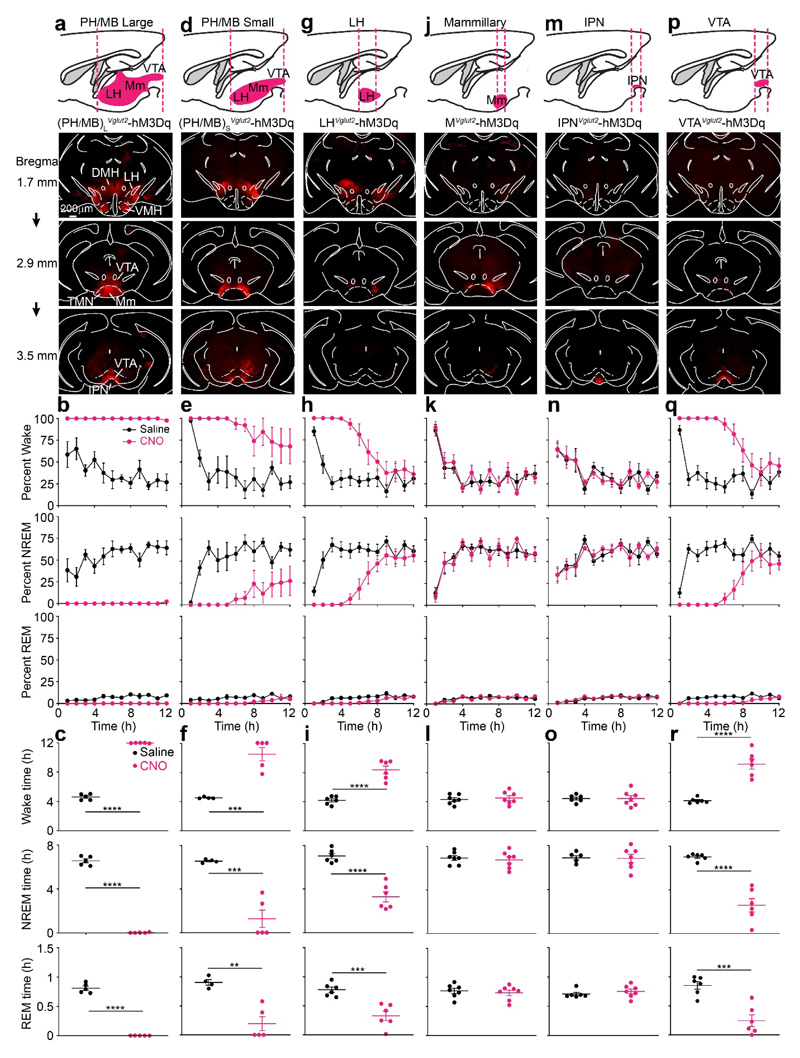
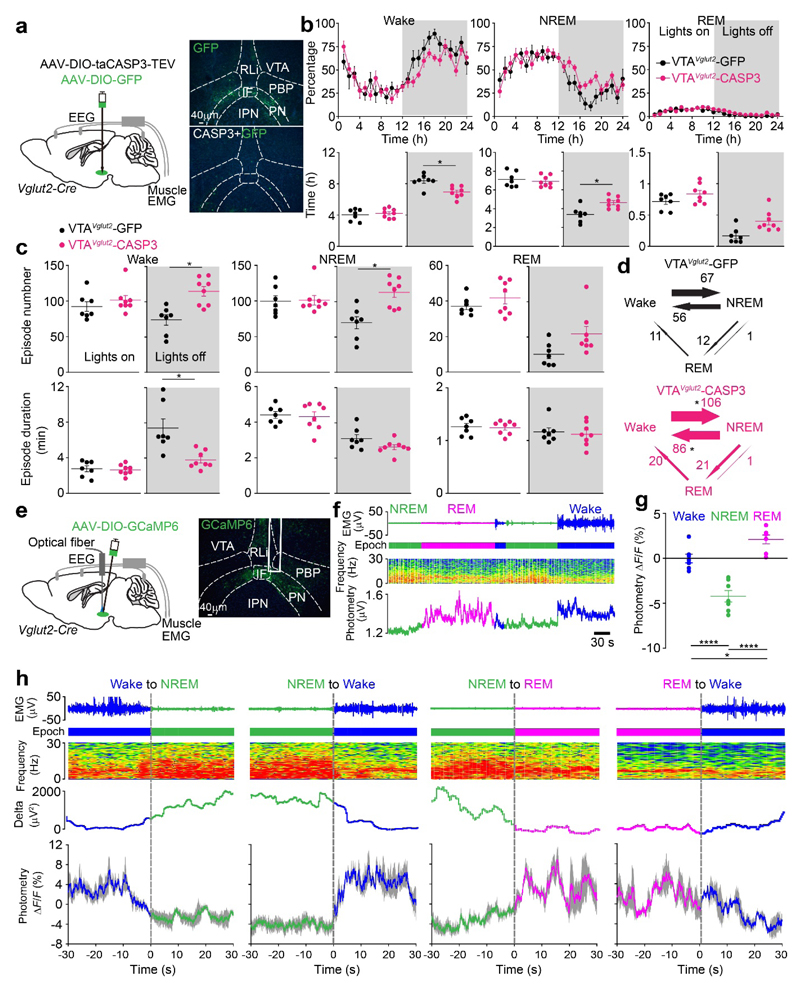
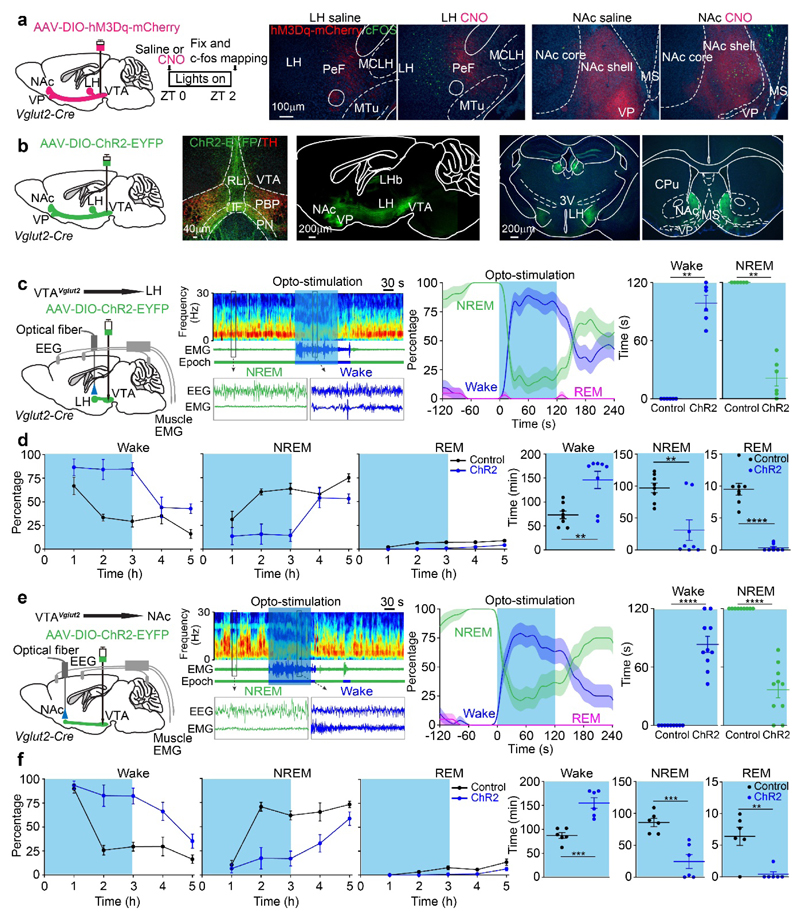
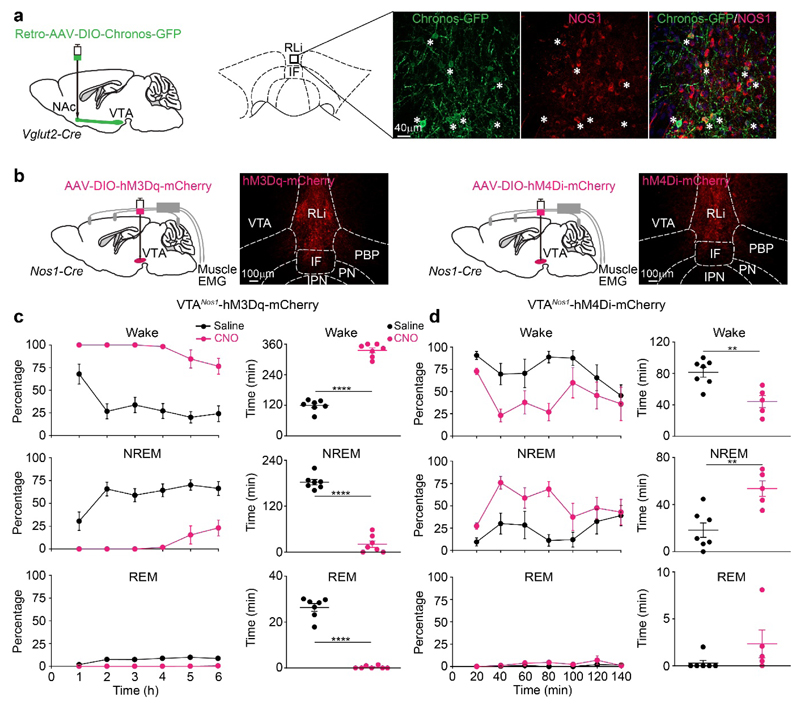
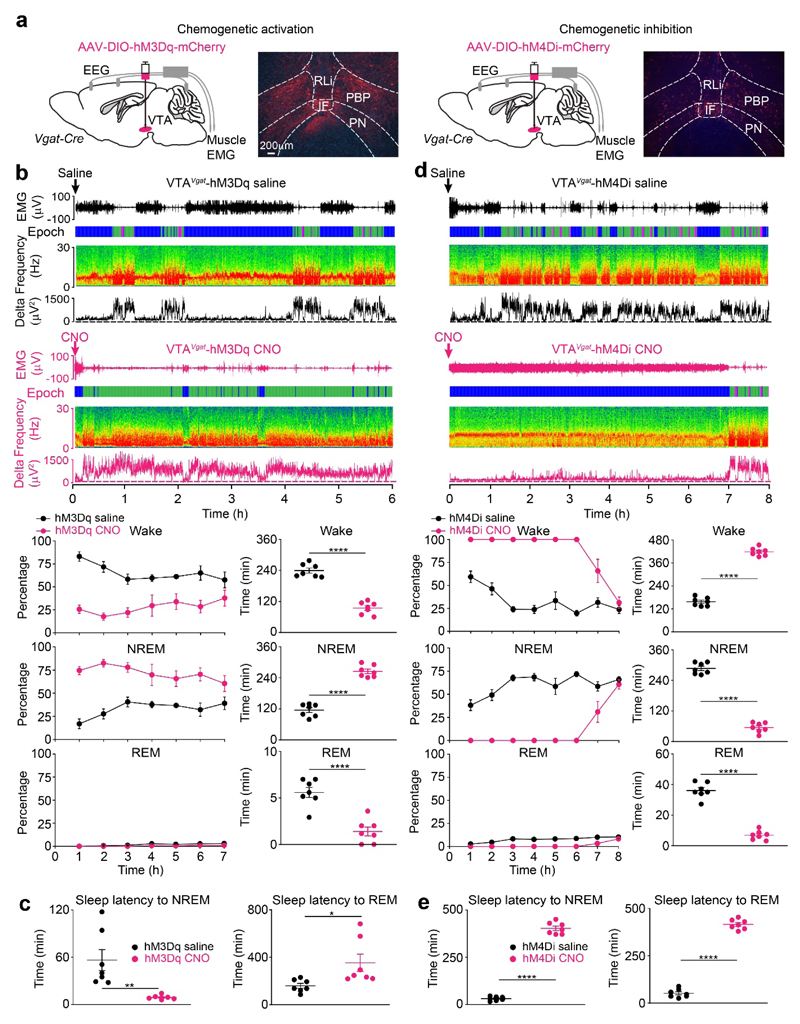
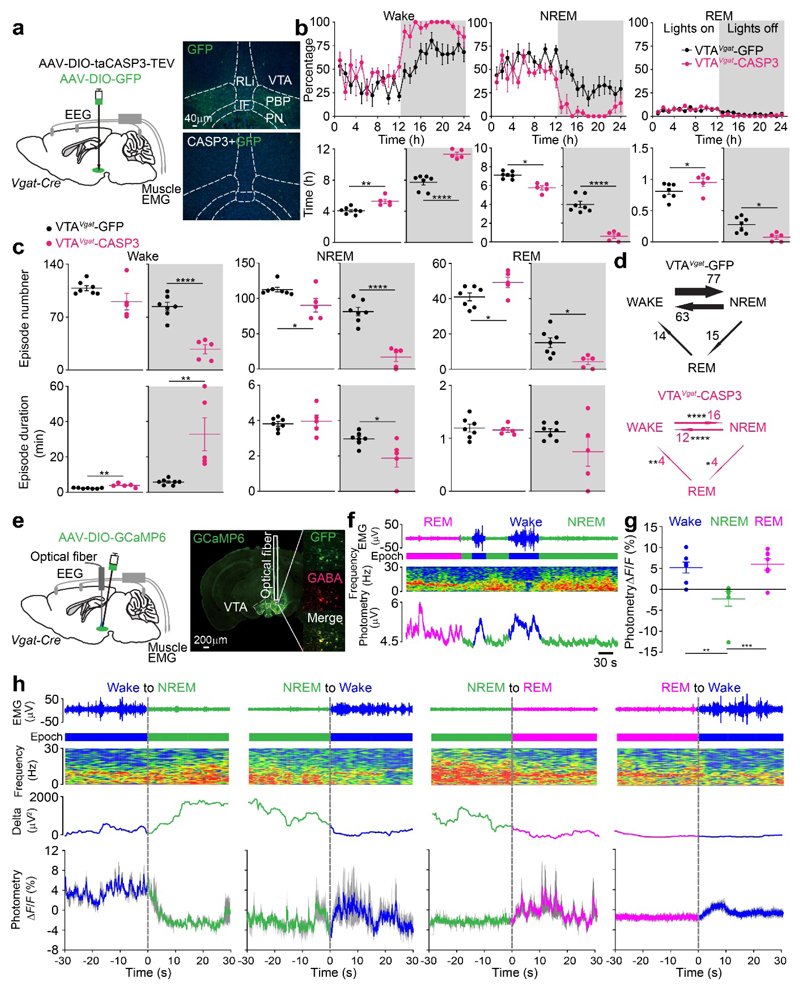
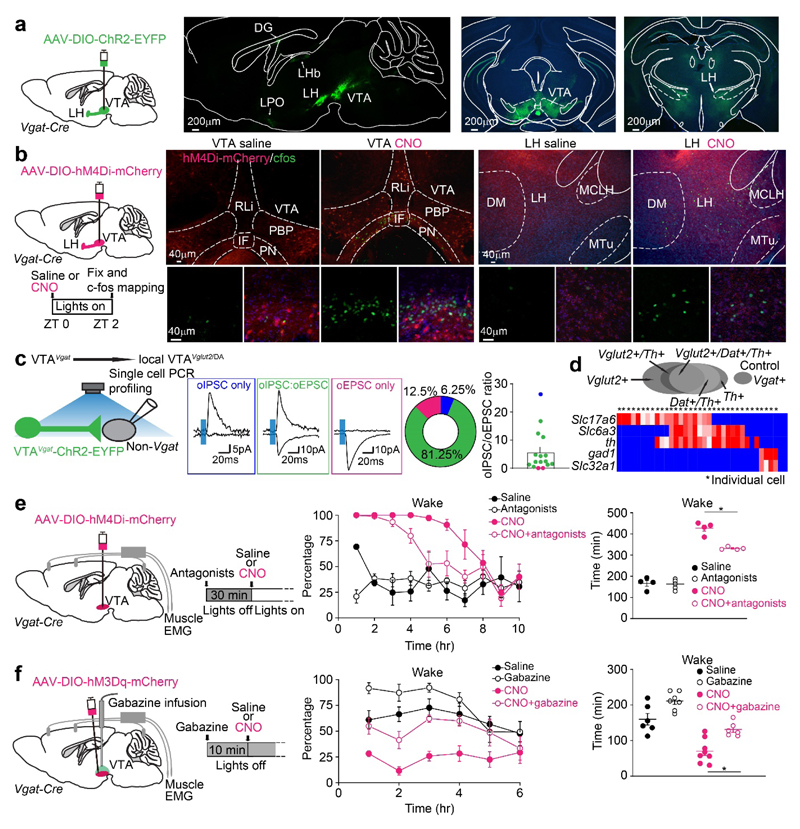
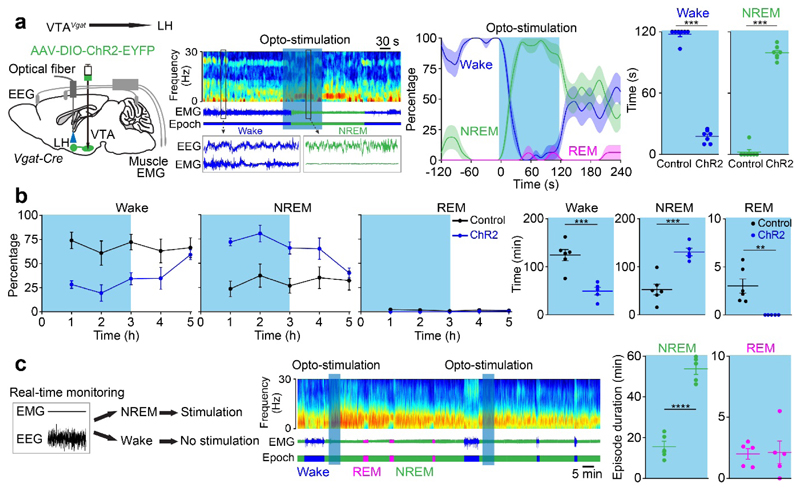
We screened for novel circuits in the mouse brain that promote wakefulness. Chemogenetic activation experiments and electroencephalogram recordings pointed to glutamatergic/nitrergic (NOS1) and GABAergic neurons in the ventral tegmental area (VTA). Activating glutamatergic/NOS1 neurons, which were wake- and rapid eye movement (REM) sleep-active, produced wakefulness through projections to the nucleus accumbens and the lateral hypothalamus. Lesioning the glutamate cells impaired the consolidation of wakefulness. By contrast, activation of GABAergic VTA neurons elicited long-lasting non-rapid-eye-movement-like sleep resembling sedation. Lesioning these neurons produced an increase in wakefulness that persisted for at least 4 months. Surprisingly, these VTA GABAergic neurons were wake- and REM sleep-active. We suggest that GABAergic VTA neurons may limit wakefulness by inhibiting the arousal-promoting VTA glutamatergic and/or dopaminergic neurons and through projections to the lateral hypothalamus. Thus, in addition to its contribution to goal- and reward-directed behaviors, the VTA has a role in regulating sleep and wakefulness.


Conflict of interest statement

Competing interests

The authors declare no competing interests.

Figures

Fig. 1
Fig. 1. Chemogenetic mapping for novel glutamatergic areas in the posterior hypothalamus and midbrain that promote wakefulness identifies the VTA
AAV-DIO-hM3Dq-mCherry was injected into different areas of the brain of Vglut2-ires-Cre mice. AAV expression was determined by immunocytochemistry for mCherry (red). The images show the actual mCherry staining. (a, b and c) AAV injection into a large volume of posterior hypothalamus and midbrain (PH/MB)L. The experiment in (a) was repeated independently 5 times. The graphs show percent of wake, NREM and REM sleep and how these states vary with saline (n=5 mice) or CNO (n=5 mice) i.p. injections. (d, e and f) AAV injection into a smaller volume of posterior hypothalamus and midbrain, and sleep-wake states scored as above after saline (n=4 mice) or CNO (n=5 mice) i.p. injections. The experiment in (d) was repeated independently 5 times. (g, h and i) AAV injection was restricted to the LH, and sleep wake states scored following saline and CNO injection after saline (n=6 mice) or CNO (n=6 mice) i.p. injections. The experiment in (g) was repeated independently 6 times. (j, k and l) AAV injection was restricted to the mammillary area, and sleep wake states scored following saline (n=7 mice) and CNO (n=7 mice) i.p. injection. The experiment in (j) was repeated independently 5 times. See Supplementary Fig. 2a for examples of hM3Dq-mCherry expression in individual mice. (m, n and o) AAV injection was restricted to the interpeduncular nucleus (IPN), and sleep wake states scored following saline (n=6 mice) and CNO (n=7 mice) i.p. injection. The experiment in (m) was repeated independently 6 times. See Supplementary Fig. 2b for examples of individual hM3Dq-mCherry expression. (p, q and r) AAV injection was restricted to the VTA, and sleep wake states scored following saline (n=6) and CNO (n=6) i.p. injection. The experiment in (p) was repeated independently 6 times. See Supplementary Fig. 2c for examples of hM3Dq-mCherry expression in individual mice. DMH, dorsomedial hypothalamus; LH, lateral hypothalamus; PH, posterior hypothalamus; IPN, interpeduncular nucleus; MM, medial mammillary area; TMN, tuberomammillary area; VMH, ventromedial hypothalamus; VTA ventral tegmental area. All error bars represent the SEM. **p<0.01, ***p<0.001, ****p<0.0001; two-sided unpaired t-test. For detailed statistics information, see Supplementary Table1.
Fig. 2
Fig. 2. VTAVglut2 neurons consolidate wakefulness and are selectively wake- and REM sleep-active
(a) Lesioning of VTAVglut2 neurons. Injection of AAV-DIO-GFP (control) or AAV-DIO-GFP and AAV-DIO-taCASP3-TEV into the VTA area of Vglut2-ires-Cre mice. Pictures show GFP control expression in the VTA area of VTAVglut2-GFP mice and that this GFP expression has been greatly diminished in the VTAVglut2-CASP3 mice. The experiment was repeated independently 6 times. IF, interfasicular nucleus; IPN, interpeduncular nucleus; PBP, parabrachial pigmented nucleus; PN, paranigral nucleus; PBP, parabrachial pigmented nucleus; RLi, rostral linear nucleus. (b) Lesioning of VTAVglut2 neurons. Percentage of wake, NREM and REM sleep in control VTAVglut2-GFP mice (n=7 mice) and VTAVglut2-CASP3 mice (n=8 mice), and the total vigilance times in the “lights on” and “lights off” periods. (c, d) Lesioning of VTAVglut2 neurons. Episode number and duration for wake, NREM and REM sleep, and vigilance state transitions during the “lights off” periods in VTAVglut2-GFP control mice (n=7 mice) and VTAVglut2-CASP3 mice (n=8 mice). (e) Fiber photometry for VTAVglut2 neurons. Injection of AAV-DIO-GCaMP6 into the VTA of the Vglut2-ires-Cre mice. The experiment was repeated independently 7 times. GCaMP6 expression can be detected in the VTA area and the trace of where the optical fiber was placed is marked. (f) Fiber photometry Ca2+spectra (bottom trace) recorded in the VTA of VTAVglut2-GCaMP6 mice aligned with the EEG spectra (middle trace) and EMG (top trace) during wakefulness, NREM and REM sleep. “Epoch” indicates vigilance state: blue, wake; green, NREM sleep; magenta, REM sleep. (g) Fiber photometry ΔF/F ratio of the Ca2+ signal in VTAVglut2-GCaMP6 mice during wakefulness, NREM sleep and REM sleep (n=7 mice; 38 sessions). (h) Detail of how the Ca2+ photometry signal in Vglut2 neurons of VTAVglut2-GCaMP6 mice changes at the boundaries of the vigilance states (n=7 mice). Ca2+ photometry ΔF/F ratio (bottom trace) in the VTAVglut2-GCaMP6 mice aligned with the extracted δ power in the EEG, the EEG spectra itself and EMG during wakefulness, NREM and REM sleep. “Epoch” indicates vigilance state: blue, wake; green, NREM sleep; magenta, REM sleep. Grey shaded regions represent SEM. *p<0.05, **p<0.01, ****p<0.0001; For b-d, two-sided unpaired t-test, for g, one-way ANOVA. All error bars represent the SEM. For detailed statistics information, see Supplementary Table1.
Fig. 3
Fig. 3. VTAVglut2 neurons promote wakefulness by their projections to the LH and NAc
(a) cFOS-based activity mapping of brain regions after exciting VTAVglut2 neurons. In VTAVglut2-hM3Dq mice, labelled axons mainly project from the VTA to the LH and NAc. cFOS protein expression in neurons of the LH and NAc of VTAVglut2-hM3Dq mice 2 hours after saline or CNO i.p. injection at ZT0. The red in the histology figure is the primary fluorescence of the hM3Dq-mCherry-positive axons coming from the VTA area, the cFOS immunohistochemistry is shown in green. The experiment was repeated independently 6 times. CPu, caudate-putamen; IF, interfasicular nucleus; LH, lateral hypothalamus; LHb, lateral habenula; MS, medial septum; NAc, nucleus accumbens; PeF, perifornical area; PBP, parabrachial pigmented nucleus; PN, paranigral nucleus; PBP, parabrachial pigmented nucleus; RLi, rostral linear nucleus; 3V, third ventricle; VP, ventral pallidum (b) Axonal projections of VTAVglut2 neurons. AAV-DIO-ChR2-EYFP was delivered into the VTA of Vglut2-ires-Cre mice, and axons projecting to the LH and NAc were strongly labelled. The experiment was repeated independently 4 times. (c, d) To functionally investigate the VTAVglut2→LH projection, an optical fiber was placed into the LH area of VTAVglut2-ChR2-EYFP mice. (c) Mice were given 120 s of optostimulation (20 Hz) during NREM sleep (“lights on” period) and the percentage and time of wake and NREM were scored (control: n=6 mice; 23 trials; ChR2: n=6 mice; 21 trials). (d) VTAVglut2-ChR2-EYFP mice (control: n=8 mice; ChR2: n=8 mice) were given 3 hours of opto-stimulation at the start of the sleep period (“lights on” period) and the percentage and time of wake, NREM and REM sleep were scored. (e, f) To functionally investigate the VTAVglut2→NAc projection, an optical fiber was placed into the NAc area of VTAVglut2-ChR2-EYFP mice. (e) Mice were given 120 s of opto-stimulation (20 Hz) during NREM sleep (“lights on” period) and the percentage and time of wake and NREM were scored (control: n=9 mice; 21 trials; ChR2: n=10 mice; 20 trials). (f) VTAVglut2-ChR2-EYFP mice (control: n=6 mice; ChR2: n=6 mice) were given 3 hours of opto-stimulation at the start of the sleep (“lights on” period) and the percentage and time of wake, NREM and REM sleep were scored. **p<0.01, ***p<0.001, ****p<0.0001, for c and e, two-sided mann-whitney u test. For d and f, two-sided unpaired t-test. All error bars represent the SEM. For (c) and (e), the shaded region represents SEM. For detailed statistics information, see Supplementary Table1.
Fig. 4
Fig. 4. VTAVglut2/Nos1 neurons promote wakefulness
(a) Retro-mapping of VTAVglut2→NAc connections. Retro-AAV-DIO-Chronos-GFP was injected into the NAc of Vglut2-ires-Cre mice. Chronos-GFP expression was detected in cells of the VTA and Chronos-GFP retro-labeled VTA midline soma (from the NAc injection) were doubled-labelled by immunocytochemistry with NOS1 antisera. The experiment was repeated independently 3 times. (b) Testing how VTANos1 neurons influence vigilance state. AAV-DIO-hM3Dq-mCherry or AAV-DIO-hM4Di-mCherry was injected into the VTA area of Nos1-ires-Cre mice. Images show the expression of hM3Dq-mCherry or hM4Di-mCherry in the VTA. The experiment was repeated independently 6 times. (c) Excitation of VTANos1 neurons induces wakefulness. Percentage and time of wake, NREM and REM sleep after saline (n=7 mice) or CNO (n=7 mice) i.p. injection at the start of sleep period (“lights on” period) into VTANos1-hM3Dq mice. (d) Inhibition of VTANos1 neurons induces NREM sleep. Percentage and time of wake, NREM and REM sleep after saline (n=7 mice) or CNO (n=5 mice) i.p. injection during wake period (“lights off” period) into VTANos1-hM4Di mice. IF, interfasicular nucleus; PBP, parabrachial pigmented nucleus; PN, paranigral nucleus; PBP, parabrachial pigmented nucleus; RLi, rostral linear nucleus; VTA, ventral tegmental area **p<0.01, ****p<0.0001; two-sided unpaired t-test. All error bars represent the SEM. For detailed statistics information, see Supplementary Table1.
Fig. 5
Fig. 5. Excitation of GABAergic neurons in the VTA induces sleep and their inhibition produces continuous wakefulness
(a) Excitation and inhibition of VTAVgat neurons. AAV-DIO-hM3Dq-mCherry or AAV-DIO-hM4Di-mCherry was injected into the VTA of Vgat-ires-Cre mice. Images show the expression of hM3Dq-mCherry or hM4Di-mCherry in the VTA. The experiment was repeated independently 6 times. IF, interfasicular nucleus; PBP, parabrachial pigmented nucleus; PN, paranigral nucleus; PBP, parabrachial pigmented nucleus; RLi, rostral linear nucleus; (b) Excitation of VTAVgat neurons induces NREM sleep and suppresses REM sleep. Two individual EEG/EMG spectra and extracted delta power from the EEG are shown for VTAVgat-hM3Dq mice that received saline (n=7 mice) or CNO (n=7 mice) i.p. injection during wake period (“lights off” period). The percentage and time in wake, NREM and REM sleep after saline (n=7 mice) or CNO (n=7 mice) injection are shown. “Epoch” indicates vigilance state: blue, wake; green, NREM sleep; magenta, REM sleep. (c) Excitation of VTAVgat neurons reduces latency to NREM sleep. Latencies to NREM and REM sleep after saline (n=7 mice) or CNO (n=7 mice) i.p. injection into VTAVgat-hM3Dq mice. (d) Inhibition of VTAVgat neurons induces wakefulness. Two individual EEG/EMG spectra and extracted delta power from the EEG are shown for VTAVgat-hM4Di mice that received saline (n=7 mice) or CNO (n=7 mice) i.p. injection at the start of sleep period (“lights on” period). The percentage and time in wake, NREM and REM sleep after saline (n=7 mice) or CNO (n=7 mice) i.p. injection are shown. “Epoch” indicates vigilance state: blue, wake; green, NREM sleep; magenta, REM sleep. (e) Inhibition of VTAVgat neurons increases latency to sleep. Latencies to NREM (n=7 mice) and REM sleep (n=7 mice) after CNO or saline i.p. injection into VTAVgat-hM4Di mice. *p<0.05, **p<0.01, ****p<0.0001; two-sided unpaired t-test. All error bars represent the SEM. For detailed statistics information, see Supplementary Table1.
Fig. 6
Fig. 6. VTAVgat neurons inhibit wakefulness. Lesioning of VTAVgat neurons produces extended wakefulness, but VTAVgat neurons are selectively wake- and REM-active.
(a) Lesioning of VTAVgat neurons. Injection of AAV-DIO-GFP (control) or AAV-DIO-taCASP3-TEV into the VTA area of Vgat-ires-Cre mice. Pictures show GFP control expression in the VTA area of VTAVgat-GFP mice and that this GFP expression has been greatly diminished in the caspase treated mice. The experiment was repeated independently 5 times. IF, interfasicular nucleus; PBP, parabrachial pigmented nucleus; PN, paranigral nucleus; PBP, parabrachial pigmented nucleus; RLi, rostral linear nucleus (b) Lesioning of VTAVgat neurons increases wakefulness. Percentage of wake, NREM and REM sleep in control VTAVgat-GFP mice (n=7 mice) and VTAVgat-CASP3 mice (n=5 mice), and the total vigilance times in the “lights on” and “lights off” periods. (c, d) Lesioning of VTAVgat neurons reduces the transitions between vigilance states and stabilizes wakefulness. Episode number and duration for wake, NREM and REM sleep, and vigilance state transitions during the “lights off” periods in VTAVgat-GFP control mice (n=7 mice) and VTAVgat-CASP3 mice (n=5 mice). (e) Fiber photometry for Ca2+ levels in VTAVgat neurons. Injection of AAV-DIO-GCaMP6 into the VTA of Vgat-ires-Cre mice. GCaMP6 expression can be detected in the VTA area and was co-stained with GABA. The trace of where the optical fiber was placed is illustrated. The experiment was repeated independently 7 times. (f) Fiber photometry for VTAVgat neurons. Neurons are more active in wake and REM sleep. Ca2+ photometry spectra (bottom trace) recorded in the VTA of VTAVgat-GCaMP6 mice aligned with the EEG spectra (middle trace) and EMG (top trace) during wakefulness, NREM and REM sleep. “Epoch” indicates vigilance state: blue: wake; green: NREM sleep; magenta, REM sleep. (g) Fiber photometry for VTAVgat neurons. ΔF/F ratio of the Ca2+ photometry signal in VTAVgat-GCaMP6f mice during wakefulness, NREM sleep and REM sleep (n=7 mice; 41 trials). (h) Fiber photometry for VTAVgat neurons. Detail of how the Ca2+ signal in Vgat neurons of VTAVgat-GCaMP6 mice changes at the boundaries of the vigilance states (n=7 mice). “Epoch” indicates vigilance state: blue, wake; green, NREM sleep; magenta: REM sleep. Grey shaded regions represent SEM. *p<0.05, **p<0.01, ****p<0.0001; For b-d, two-sided unpaired t-test, for g, one-way ANOVA. All error bars represent the SEM. For detailed statistics information, see Supplementary Table1.
Fig. 7
Fig. 7. VTAVgat neurons limit wakefulness in part by locally inhibiting dopamine and Vglut2 neurons in the VTA
(a) Mapping axonal projections of VTAVgat neurons. AAV-DIO-ChR2-EYFP was delivered into the VTA of Vgat-ires-Cre mice, and axons in the local VTA and projecting to the LH were strongly labelled. The experiment was repeated independently 4 times. DG: detent granule cells; IF, interfasicular nucleus; LH, lateral hypothalamus; LHb: lateral habenula; LPO: lateral preoptic area; MCLH, magnocellular nucleus, lateral hypothalamus; MTu, medial tuberomammillary nucleus; PBP, parabrachial pigmented nucleus; PN, paranigral nucleus; RLi, rostral linear nucleus; VTA: ventral tegmental area. (b) cFOS-based activity mapping of brain regions after inhibiting VTAVgat neurons. In VTAVgat-hM4Di mice, cFOS protein expression is found in neurons of the VTA and LH 2 hours after saline or CNO i.p. injection at ZT0. The red in the histology figure is the primary fluorescence of the hM4Di-mCherry-positive axons, the cFOS immunohistochemistry is shown in green. The experiment was repeated independently 6 times. (c, d) (c) Investigating the local transmitter properties of VTAVgat neurons in the midline VTA. Acute brain slice electrophysiology was performed on non-Vgat neurons in the midline VTA area in VTAVgat-ChR2-EYFP mice. Non-Vgat cells were visually selected by YFP negative signals, and after whole-cell status was successfully achieved, a 5ms single blue LED light pulse was given to the local VTA area. The percentages of recorded non-Vgat cells which had either oIPSCs only, or oEPSCs only, or both oIPSCs and oEPSCs were: oIPSC only: 6.25% (n=1); oIPSC and oEPSC (oIPSC: oEPSC), 81.25% (n=13); oEPSC only, 12.5% (n=2). The relative amplitude ratio of the oIPSC peaks versus the oEPSC peaks of non-Vgat cells was 5.71±1.8 (n=16). (d) Heat map for the single-cell PCR of patched cells. The genes tested for were: Slc17a6 (vglut2); Slc6a3 (dat), Slc32a1 (vgat), th, and gad1. (e) VTAVgat neurons inhibit wakefulness in part by inhibiting dopamine neurons. Dopamine receptor D1 and D2/3 antagonists (SCH23390 and raclopride respectively) were injected into VTAVgat-hM4Di mice 30 min before saline or CNO injection. Percentage and time of wake was scored after saline or CNO injection (saline: n=4 mice; antagonists: n=5 mice; CNO: n=4 mice; CNO+antagonists: n=4 mice). (f) Local inhibition from VTAVgat neurons limits wakefulness. A cannula was placed into the VTA of VTAVgat-hM3Dq mice and mice were given gabazine 10 min before saline or CNO i.p. injection. Percentage and time of wake was scored (saline: n=6 mice; gabazine: n=7 mice; CNO: n=8 mice; CNO+gabazine: n=6 mice). *p<0.05, for e and f, repeated measures two-way ANOVA and Bonferroni-Holm post hoc test. All error bars represent the SEM. For detailed statistics information, see Supplementary Table1.
Fig. 8
Fig. 8. VTAVgat neurons inhibit wakefulness in part via projections to the lateral hypothalamus
(a, b) To functionally test the VTAVgat→LH projections, an optical fiber was placed into the LH area of VTAVgat-ChR2-EYFP mice. (a) Mice were given 120 s of opto-stimulation (20 Hz) during their active period (during the “lights off” period) and the percentage and time of wake and NREM sleep were scored (control: n=7 mice; 16 trials; ChR2: n=7 mice; 16 trials) the sem; (b) VTAVgat-ChR2-EYFP mice (control: n=6 mice; ChR2: n=5 mice) were given 3 hours of opto-stimulation during the active period (“lights-off” period) and the percentage and time of wake, NREM and REM sleep were scored. (c) Mice were given 5 min of opto-stimulation when NREM sleep occurred (control: n=5 mice; 5 trials; ChR2: n=5 mice; 5 trials). The duration of NREM and REM sleep was scored. **p<0.01, ***p<0.001, ****p<0.0001, for a, two-sided mann-whitney u test. For b and c, two-sided unpaired t-test. All error bars represent the SEM. Shaded regions represent SEM. For detailed statistics information, see Supplementary Table1.

References

    1. Scammell TE, Arrigoni E, Lipton JO. Neural Circuitry of Wakefulness and Sleep. Neuron. 2017;93:747–765. doi: 10.1016/j.neuron.2017.01.014. - DOI - PMC - PubMed
    1. Weber F, Dan Y. Circuit-based interrogation of sleep control. Nature. 2016;538:51–59. doi: 10.1038/nature19773. - DOI - PubMed
    1. Saper CB, Fuller PM. Wake-sleep circuitry: an overview. Curr Opin Neurobiol. 2017;44:186–192. doi: 10.1016/j.conb.2017.03.021. - DOI - PMC - PubMed
    1. Gent TC, Bassetti C, Adamantidis AR. Sleep-wake control and the thalamus. Curr Opin Neurobiol. 2018;52:188–197. doi: 10.1016/j.conb.2018.08.002. - DOI - PubMed
    1. Eban-Rothschild A, Rothschild G, Giardino WJ, Jones JR, de Lecea L. VTA dopaminergic neurons regulate ethologically relevant sleep-wake behaviors. Nat Neurosci. 2016;19:1356–1366. doi: 10.1038/nn.4377. - DOI - PMC - PubMed

Publication types