. 2019 Jan;51(1):106-116.
doi: 10.1038/s41588-018-0288-4. Epub 2018 Dec 17.

Neurodevelopmental disease genes implicated by de novo mutation and copy number variation morbidity

Affiliations

Neurodevelopmental disease genes implicated by de novo mutation and copy number variation morbidity

Bradley P Coe et al. Nat Genet. 2019 Jan.

Abstract

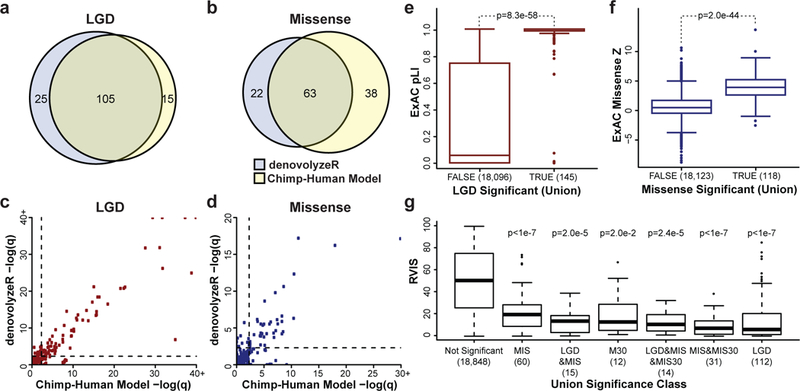
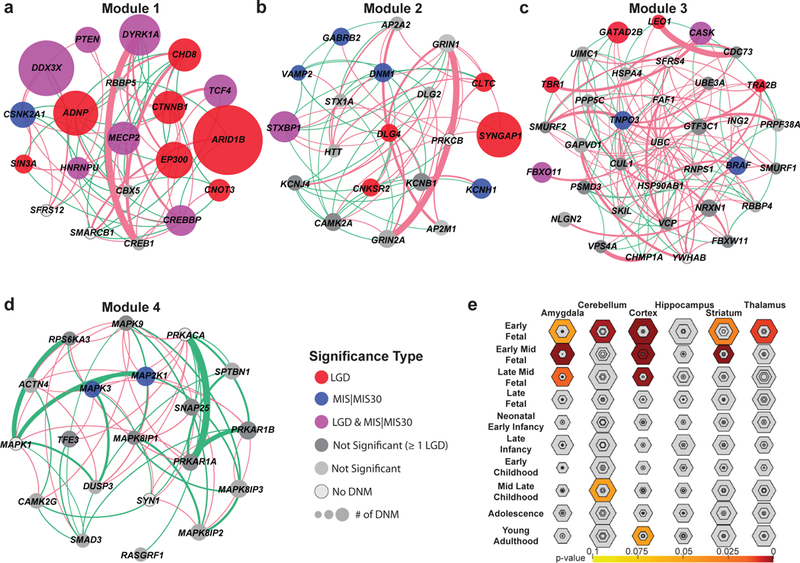
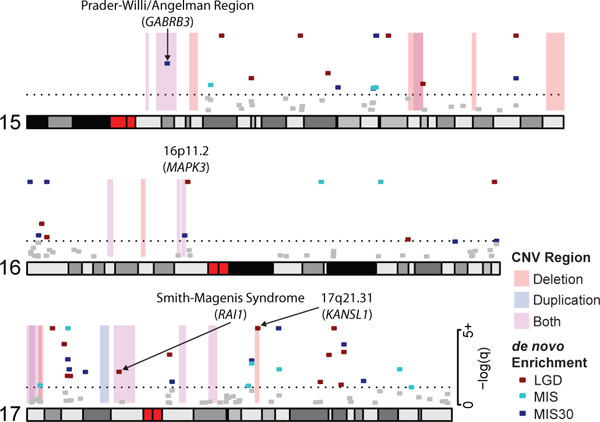
We combined de novo mutation (DNM) data from 10,927 individuals with developmental delay and autism to identify 253 candidate neurodevelopmental disease genes with an excess of missense and/or likely gene-disruptive (LGD) mutations. Of these genes, 124 reach exome-wide significance (P < 5 × 10⁻⁷) for DNM. Intersecting these results with copy number variation (CNV) morbidity data shows an enrichment for genomic disorder regions (30/253, likelihood ratio (LR) +1.85, P = 0.0017). We identify genes with an excess of missense DNMs overlapping deletion syndromes (for example, KIF1A and the 2q37 deletion) as well as duplication syndromes, such as recurrent MAPK3 missense mutations within the chromosome 16p11.2 duplication, recurrent CHD4 missense DNMs in the 12p13 duplication region, and recurrent WDFY4 missense DNMs in the 10q11.23 duplication region. Network analyses of genes showing an excess of DNMs highlights functional networks, including cell-specific enrichments in the D1+ and D2+ spiny neurons of the striatum.


Conflict of interest statement

COMPETING FINANCIAL INTERESTS

E.E.E. is on the scientific advisory board (SAB) of DNAnexus, Inc.

Figures

Figure 1:
Figure 1:. de novo enriched genes and their characteristics.
Shown are the results of applying both the chimpanzee-human (CH) divergence model and denovolyzeR to de novo variation in n = 10,927 independent individuals with ASD/ID/DD. The two models show considerable gene overlap (A,B) with correlated significance values (LGD Pearson r2 = 0.94, missense r2 = 0.74) (C,D). CH model LGD outliers include NONO, MEIS2, LEO1, WDR26, and CAPRIN1, and denovolyzeR LGD outliers include ZBTB18 and FAM200B (C). CH model missense (MIS) outliers include CAPN15, SNAPC5, DLX3, TMEM178A, ADAP1, SNX5, SMARCD1, WDR26, and AGO4, and denovolyzeR missense outliers include ITPR1, RAC1, SETD1B, WDFY4, and UNC80 (D). Recurrent mutated LGD genes (TRUE, n = 145 with pLI scores) are highly enriched for genes intolerant to mutation as defined by ExAC pLI score (two-tailed Wilcoxon rank-sum test) (E). Genes significantly enriched for missense DNMs (n = 118 with missense Z scores) are outliers by the ExAC missense depletion Z scores (two-tailed Wilcoxon rank-sum test) (F). Similarly, all subcategories of significant genes (n below each category name) are intolerant to mutation (RVIS percentile) when compared to non-significant genes (Tukey HSD test, p-values are corrected for all possible group comparisons) (G). Boxplots represent Quartiles 1 to 3 with the median indicated. Whiskers span from Q1 - 1.5 IQR to Q3 + 1.5 IQR.
Figure 2:
Figure 2:. Gene expression and protein-interaction networks.
(A-D) MAGI analysis of the union set (n = 253 independent genes) highlights the top four modules of co-expression and protein-protein interaction (PPI), including genes significant for DNM enrichment by denovolyzeR (FDR-adjusted Poisson test) or the CH model (FDR-adjusted binomial test) (colored circles) and new candidate genes with DNM that do not yet reach significance (dark gray). The size of the circle represents the relative number of patients with DNMs within this cohort. Edges depict PPIs (pink arcs) and co-expression (green arcs) scaled by their scores from geneMANIA. (E) Tissue-specific enrichment analyses (TSEA) of the union set (n = 253 independent genes) highlight a strong bias to various developing parts of the brain with the strongest signal early to mid-fetal development (color corresponds to FDR-adjusted one-tailed Fisher’s exact test p-values, shaded regions closer to the center of each hexagon indicate increasing tissue specificity).
Figure 3:
Figure 3:. Expression in human cortical neurons.
(A-B) Heatmaps demonstrating a broad pattern of inhibitory and excitatory neuronal expression (median log2 (CPM+1)) in the union gene set (n = 253 independent genes) compared to control genes (n = 156 independent genes). Expression level is indicated by a color gradient from low expression (dark blue) to high (orange). Rows represent individual genes and are ordered by the number of clusters (transcriptomic defined cell types) with expression (median CPM > 1), and columns represent 41 inhibitory neuronal, 24 excitatory neuronal, and 6 glial transcriptional clusters, each representing a distinct cell type. (C-D) The number of inhibitory and excitatory clusters with expression in NDD genes (Union n = 253, LGD n = 145, MIS n = 123, MIS30 n = 59) compared to controls (synonymous (SYN) n = 101, Control n = 156 independent genes). The signal is strongest for NDD genes with the most severe missense mutations (MIS30). Boxplots represent Quartiles 1 to 3 with the median indicated. Whiskers span from Q1 - 1.5 IQR to Q3 + 1.5 IQR.
Figure 4:
Figure 4:. Estimation of gene discovery rates in future cohorts.
We estimate the number of genes reaching significance under the CH model at varying population sizes subsampled from the total cohort of 10,927 individuals. Both the number of significant genes with recurrent LGD and MIS30 DNMs appear to be saturating with limited new gene discovery as sample sizes grow. De novo missense variants (including MIS30), however, as a more general class demonstrate a more complex growth pattern with no best-fit line and, thus, likely represent the most important reservoir for new gene discovery as sequence data are generated from additional ASD and DD cohorts.
Figure 5:
Figure 5:. Integration of de novo SNVs and CNV morbidity map.
Shown are examples of pathogenic CNVs (blue, red and purple shading) associated with genomic disorders from chromosomes 15, 16, and 17, which intersect with genes that show a significant excess of DNM in n = 10,927 independent patients (red, turquoise and blue points representing the minimum q-value from either denovolyzeR or CH model, the dashed line represents a q-value of 0.05). The analysis confirms known associations, such as RAI1, and KANSL1 and candidate association for MAPK3. Recurrent severe missense mutations of GABRB3 have been associated with autism and may be relevant to the recurrent 15q11 duplication. We note that mutations and deletions of the imprinted genes SNRPN (no DNM in our data set) and UBE3A (1 LGD and 1 missense DNM in our data set) are known to cause the core phenotype of Prader-Willi and Angelman syndromes, respectively, but do not reach significance in this analysis.

Similar articles

Cited by

References

    1. Sebat J et al. Strong association of de novo copy number mutations with autism. Science 316, 445–9 (2007). - PMC - PubMed
    1. Sharp AJ et al. Segmental duplications and copy-number variation in the human genome. Am J Hum Genet 77, 78–88 (2005). - PMC - PubMed
    1. Tuzun E et al. Fine-scale structural variation of the human genome. Nat Genet 37, 727–32 (2005). - PubMed
    1. de Vries BB et al. Diagnostic genome profiling in mental retardation. Am J Hum Genet 77, 606–16 (2005). - PMC - PubMed
    1. Bailey JA, Yavor AM, Massa HF, Trask BJ & Eichler EE Segmental duplications: organization and impact within the current human genome project assembly. Genome Res 11, 1005–17 (2001). - PMC - PubMed

METHODS ONLY REFERENCES

    1. Warde-Farley D et al. The GeneMANIA prediction server: biological network integration for gene prioritization and predicting gene function. Nucleic Acids Res 38, W214–20 (2010). - PMC - PubMed
    1. Zeisel A et al. Brain structure. Cell types in the mouse cortex and hippocampus revealed by single-cell RNA-seq. Science 347, 1138–42 (2015). - PubMed
    1. Dobin A et al. STAR: ultrafast universal RNA-seq aligner. Bioinformatics 29, 15–21 (2013). - PMC - PubMed

Publication types

MeSH terms

Substances