Review
. 2018 Dec 12:12:1179069518815628.
doi: 10.1177/1179069518815628. eCollection 2018.

Need for Speed and Precision: Structural and Functional Specialization in the Cochlear Nucleus of the Avian Auditory System

Affiliations
Review

Need for Speed and Precision: Structural and Functional Specialization in the Cochlear Nucleus of the Avian Auditory System

Hui Hong et al. J Exp Neurosci. .

Abstract

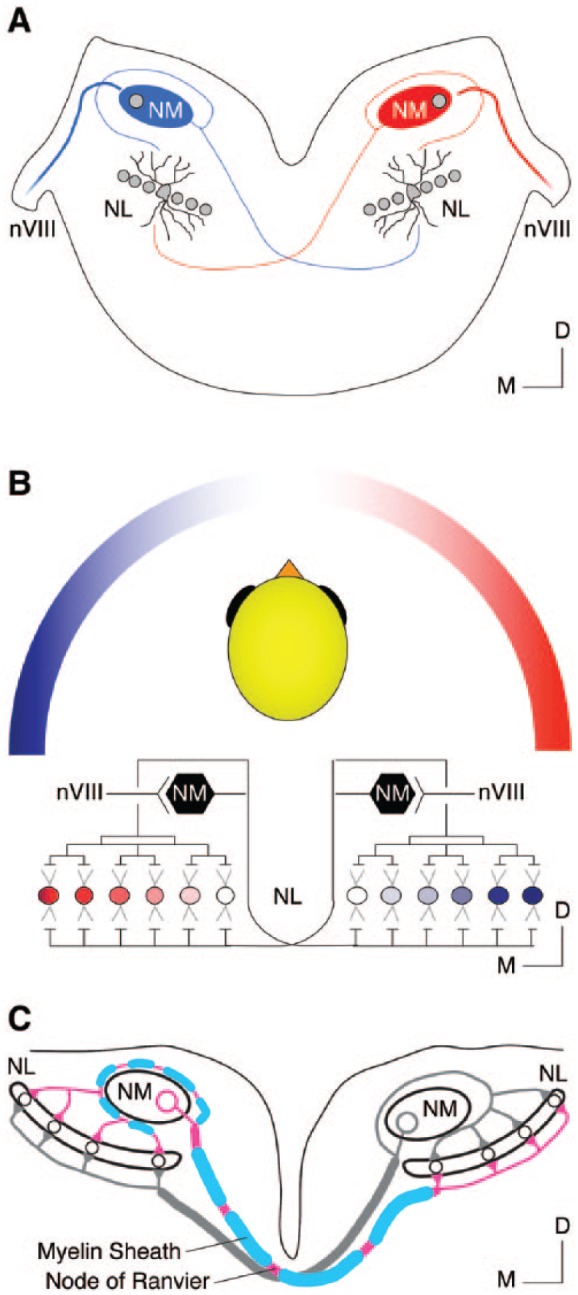
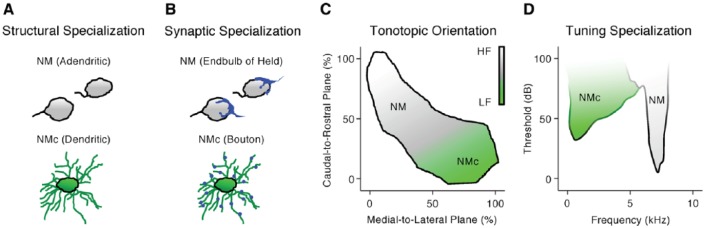
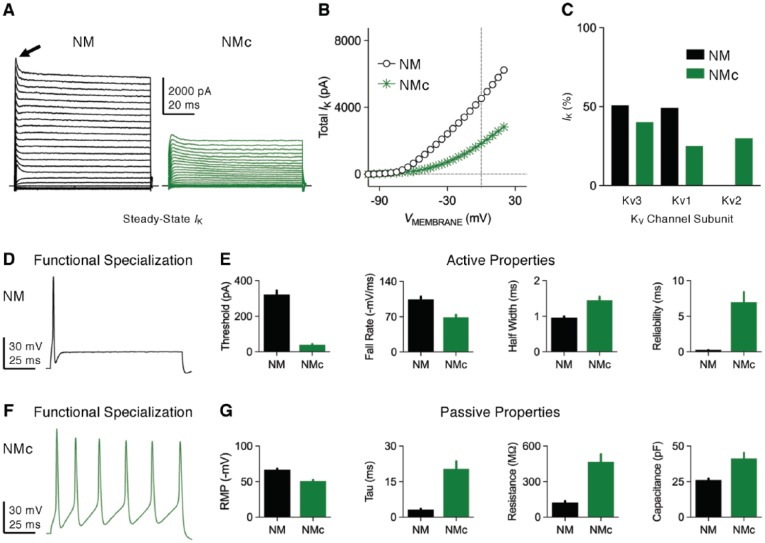
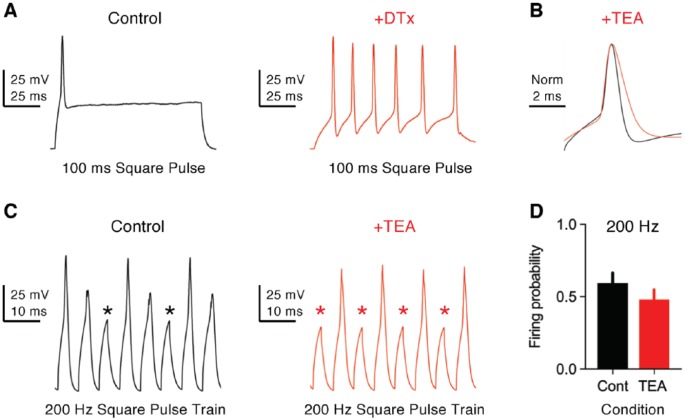
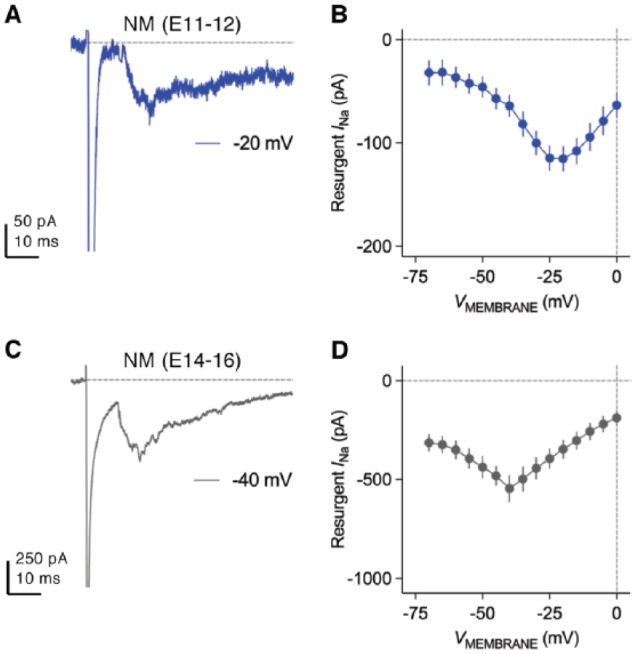
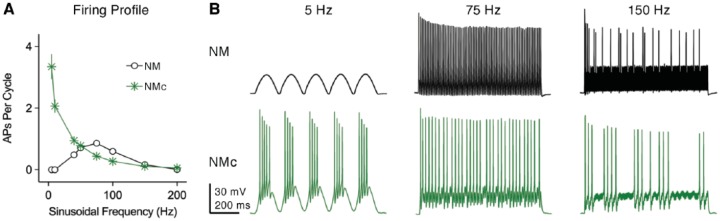
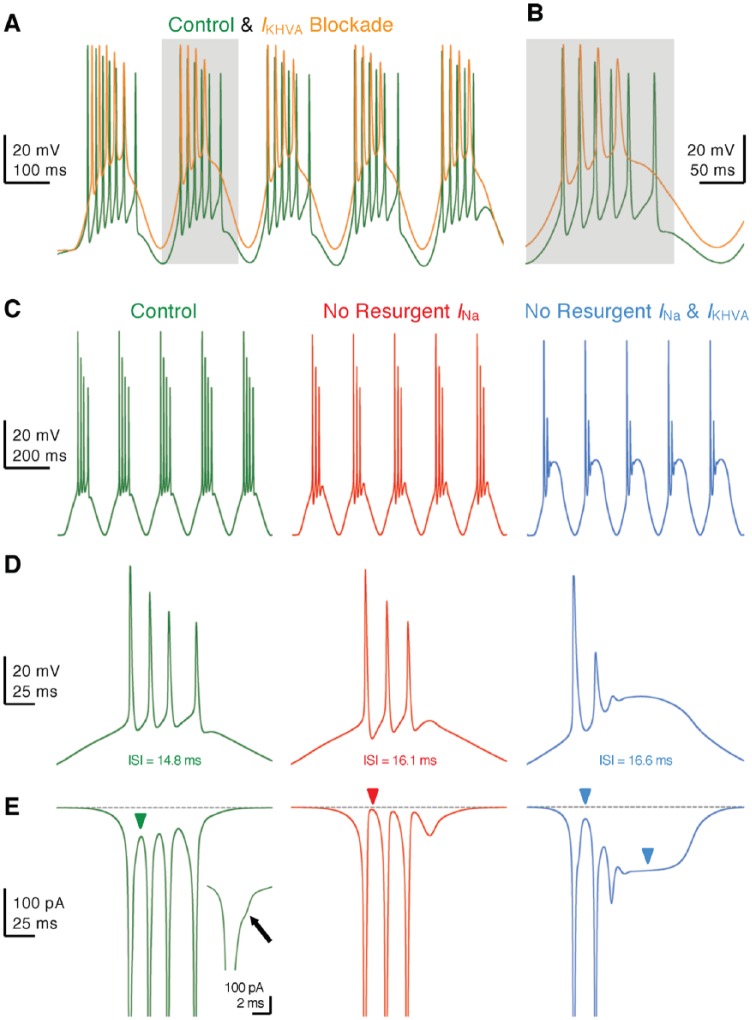
Birds such as the barn owl and zebra finch are known for their remarkable hearing abilities that are critical for survival, communication, and vocal learning functions. A key to achieving these hearing abilities is the speed and precision required for the temporal coding of sound-a process heavily dependent on the structural, synaptic, and intrinsic specializations in the avian auditory brainstem. Here, we review recent work from us and others focusing on the specialization of neurons in the chicken cochlear nucleus magnocellularis (NM)-a first-order auditory brainstem structure analogous to bushy cells in the mammalian anteroventral cochlear nucleus. Similar to their mammalian counterpart, NM neurons are mostly adendritic and receive auditory nerve input through large axosomatic endbulb of Held synapses. Axonal projections from NM neurons to their downstream auditory targets are sophisticatedly programmed regarding their length, caliber, myelination, and conduction velocity. Specialized voltage-dependent potassium and sodium channel properties also play important and unique roles in shaping the functional phenotype of NM neurons. Working synergistically with potassium channels, an atypical current known as resurgent sodium current promotes rapid and precise action potential firing for NM neurons. Interestingly, these structural and functional specializations vary dramatically along the tonotopic axis and suggest a plethora of encoding strategies for sounds of different acoustic frequencies, mechanisms likely shared across species.

Keywords: Auditory; avian; nucleus magnocellularis; potassium channels; resurgent sodium current; sodium channels; tonotopy.


Conflict of interest statement

Declaration of conflicting interests:The author(s) declared no potential conflicts of interest with respect to the research, authorship, and/or publication of this article.

Figures

Figure 1.
Figure 1.
Binaural hearing microcircuit responsible for temporal coding in the avian auditory system. (A) Schematic coronal section of the chicken auditory brainstem. (B) Schematic representation of the neural circuit (ie, modified Jeffress model) in chickens responsible for sound localization. (C) Schematic illustration of NM’s projections to NL. Note the difference in myelin between the ipsilateral and contralateral projections. Images in (B) and (C) were modified with permission from Sanchez et al., 2018. D indicates dorsal; M, medial; nVIII, auditory nerve; NL, nucleus laminaris; NM, nucleus magnocellularis.
Figure 2.
Figure 2.
Structural and functional specializations across the tonotopic axis of nucleus magnocellularis (NM). (A, B, and D) Schematic illustrations showing the structural (A), synaptic (B), and tuning (D) differences between mid- to high-frequency NM and low-frequency NM (termed NMc) neurons. Structural and synaptic differences were modified from Wang et al. Tuning differences were modified from Warchol and Dallos., (C) Schematic illustrations showing the tonotopic orientation of NM. Tonotopic orientation was modified from Kuba and Ohmori. For simplicity, “NM” in all figures represents the traditionally defined, adendritic NM neurons that are mainly located in mid- to high-frequency region.
Figure 3.
Figure 3.
Voltage-dependent potassium (KV) current properties. (A) Representative KV current traces recorded from mid- to high-frequency NM and NMc neurons, in response to membrane voltages from −100 mV to +20 mV in a step of 5 mV. Arrow points to transient A-type current. (B) Population data showing the amplitude of steady-state KV current (IK) as a function of membrane voltage (VMEMBRANE) for the two neuronal groups. (C) Average percent contribution of KV3-, KV1-, and KV2-mediated currents to total KV current at the membrane voltage of +20 mV. (D and F) Representative membrane responses recorded from mid- to high-frequency NM (D) and NMc (F) neurons to sustained current injection. The amplitude of current injection is 500 and 200 pA, respectively. (E and G) Population data showing the differences in active (E) and passive (G) membrane properties between the two neuronal groups. Reliability is a measure of jitter and was defined as the range of peak occurrences of 30 action potentials (APs). Data were adapted from Hong et al, and Wang et al. Error bar = standard error. NM indicates nucleus magnocellularis; RMP, resting membrane potential; Tau, time constant.
Figure 4.
Figure 4.
Function of KV1- and KV3-containing channels in NM neurons. (A) Representative membrane responses recorded from a mid- to high-frequency NM neuron to sustained current injection (100 ms) in control and with bath application of dendrotoxin (DTx, 0.1 μM). DTx blocks KV1-containing channels. The amplitude of current injection is 440 pA in control and 60 pA with DTx. (B) Representative APs (normalized) recorded from a mid- to high-frequency NM neuron in control and with bath application of TEA (1 mM). TEA mainly blocks KV3-containing channels. (C) Representative membrane responses recorded from a mid- to high-frequency NM neuron to square pulse trains of 200 Hz in control and with TEA. Asterisks denote AP failures. (D) Population data showing the difference in firing probability to 200 Hz input. Firing probability was calculated as the number of APs divided by the number of square pulses. Error bar = standard error. Data were adapted from Hong et al., APs indicates action potentials; Cont, control; NM, nucleus magnocellularis; TEA, tetraethylammonium.
Figure 5.
Figure 5.
Development of KV current properties in NM neurons. (A-C) Population data showing the amplitude of KV current (IK) as a function of membrane voltage (VMEMBRANE) for mid- to high-frequency NM neurons at the age of embryonic (E) days (A) 10-12, (B) 14-16, and (C) 19-21. Fluoxetine (Flx, 100 μM) mainly blocks KV3-containing channels. Insets showing the percent of KV current at +20 mV that is sensitive to Flx. Error bar = standard error. Data were adapted from Hong et al. NM indicates nucleus magnocellularis.
Figure 6.
Figure 6.
Voltage-dependent sodium (NaV) current properties. (A) Representative transient NaV current traces recorded from mid- to high-frequency NM and NMc neurons in response to membrane depolarization at −30 mV. (B) Population data showing the differences in NaV current (INa) amplitude and fall rate at the membrane voltage of −30 mV between the two neuronal groups. Both bar graphs share the same scale in Y-axis. (C) Representative NaV current traces recorded from mid- to high-frequency NM and NMc neurons, in response to depolarization to −30 mV following pre-pulse holding voltages from −90 to −30 mV in a step of 10 mV. (D) Population data showing voltage dependence of NaV channel inactivation for the two neuronal groups. hNa was calculated as the NaV current recorded for each trial normalized to the maximum current across all trials and plotted as a function of the holding voltage. (E) High power images with z-projection showing the immunoreactivity of NaV1.6 subtype in mid- to high-frequency NM and NMc regions. Arrowheads point to NaV1.6-positive axon segments. (F) Population data showing the differences in length and diameter of NaV1.6-positive segments in mid- to high-frequency NM and NMc regions. Error bar = standard error. Data were adapted from Hong et al., NM indicates nucleus magnocellularis.
Figure 7.
Figure 7.
Rapid recovery of transient NaV current in NM neurons. (A) Representative transient NaV currents recorded from a mid- to high-frequency NM neuron in response to double-pulse protocol. Neurons were given a pre-pulse to 0 mV, along with the second pulses after varying amount of recovery time (shown above the traces). Recovery time varied from 1 to 1000 ms. (B) Population data showing the recovery ratio (%) as a function of recovery time. Recovery ratio was calculated as the current amplitude at the second pulse normalized to the pre-pulse. Error bar = standard error. Data were recorded using the methods described in Hong et al.
Figure 8.
Figure 8.
Development of NaV current properties in NM neurons. (A) Representative transient NaV currents recorded from mid- to high-frequency NM neurons at E10-E12, E14-E16, and E19-E21. NaV currents were recorded around the membrane voltage that elicited the maximal current for each age group (−35, −47, and −54 mV, respectively, in this figure). (B-D) Population data showing the development of maximal NaV current amplitude, density, and conductance. (E-G) Population data showing the development of NaV current kinetics, ie, rise rate (E), fall rate (F), and half width (G). (H) Population data showing the development of the voltage dependence of NaV channel inactivation. Error bar = standard error. Data were adapted from Hong et al.
Figure 9.
Figure 9.
Development of NaV1.6 distribution in NM neurons. (A-C) NaV1.6 immunoreactivity at E21, E15, and E11. Left (A1, B1, and C1) and right (A2, B2, and C2) columns are low- and high-magnification confocal images, respectively. Dashed lines indicate the boundary of NM (mid- to high-frequency). Arrows point to NaV1.6-positive axon segments. Scale bars: 50 μm in C1 (left column) and 10 μm in C2 (right column). Data were taken from Hong et al. NM indicates nucleus magnocellularis.
Figure 10.
Figure 10.
Resurgent sodium current properties. (A) Representative current traces recorded from mid- to high-frequency NM and NMc neurons in response to membrane depolarization to +30 mV (duration = 10 ms) followed by repolarization at varying membrane voltages (indicated in different colors). (B) Population data showing the amplitude of resurgent sodium current as a function of repolarizing membrane voltage (VMEMBRANE) for the two neuronal groups. (C) Representative normalized resurgent sodium current traces recorded from mid- to high-frequency NM and NMc neurons. (D) Population data showing the differences in time to peak and decay tau (time constant) of resurgent sodium current between the two neuronal groups. NM indicates nucleus magnocellularis.
Figure 11.
Figure 11.
Resurgent sodium current promotes the recovery of NaV channels. (A and E) Representative current traces recorded from mid- to high-frequency (A) NM and (E) NMc neurons, in response to two voltage-clamp protocols (for details, please refer Hong et al.,). In short, a conditioning step was applied to neurons followed by recovery period at rest for the varying amounts of time. After recovery, a pulse to 0 mV was applied to evoke a transient NaV current. The conditioning step is +30 mV at 5 ms in Open-Block Condition and −30 mV at 40 ms in Inactivation Condition. Recovery time varied from 2 to 50 ms for mid- to high-frequency NM neurons and from 2 to 30 ms for NMc neurons. (B and F) Population data showing the NaV channel availability (%) as a function of recovery time. To calculate NaV channel availability, a reference pulse to 0 mV was applied to neurons (not shown in the figure), and the amplitude of transient NaV current after the recovery was normalized to this “reference amplitude.” The recovery trajectory was fit by a single exponential, to obtain recovery tau (time constant). (C and G) Population data showing the recovery tau under two different condition states. Error bar = standard error. (D and H) Representative NaV current traces taken from respective (A) and (E) were normalized and overlaid for recovery time periods of 2 and 20 ms. Data were adapted from Hong et al., NM indicates nucleus magnocellularis.
Figure 12.
Figure 12.
Resurgent sodium current promotes AP firing in model NM neuron. (A) Simulated membrane responses to square pulse trains of 200 Hz in control and with removal of resurgent sodium current. (B) Enlargement of the simulated membrane responses from (A). Asterisks denote AP failures. (C) Simulated NaV current traces underlying the membrane responses shown in (B). Arrows indicate the generation (left) or elimination (right) of resurgent sodium current.
Figure 13.
Figure 13.
Development of resurgent sodium current in NM neurons. (A and C) Representative current traces recorded from mid- to high-frequency NM neurons at (A) E11-E12 and (C) E14-E16. Repolarizing membrane voltage is (A) −20 mV and (C) −40 mV. (B and D) Population data showing the amplitude of resurgent sodium current as a function of repolarizing membrane voltage (VMEMBRANE) at (B) E11-E12 and (D) E14-E16.
Figure 14.
Figure 14.
Frequency-firing patterns to sinusoidal current injections. (A) Population data showing APs per cycle as a function of sinusoidal frequency for mid- to high-frequency NM and NMc neurons. APs per cycle were calculated as the number of APs divided by the number of sinusoidal cycles. Error bar = standard error. (B) Representative membrane responses recorded from mid- to high-frequency NM and NMc neurons to sinusoidal current injection with varying frequencies. Data were adapted from Hong et al., NM indicates nucleus magnocellularis.
Figure 15.
Figure 15.
KHVA+ and resurgent sodium current promote burst firing in NMc neurons. (A and B) Representative membrane responses recorded from an NMc neuron to 5 Hz sinusoidal current injections in control and during dual-drug application of Guangxitoxin (GxTx, 100 nM) and TEA to block KHVA+ channels (IKHVA blockade). Gray area of the second sinusoidal cycle in (A) was expanded and shown in (B). (C) Simulated membrane responses from model NMc neuron to 5 Hz sinusoidal current injections under three conditions: control (left), with removal of resurgent sodium current (no resurgent INa, middle) and with removal of both resurgent sodium current and KHVA+ conductances (no resurgent INa and IKHVA, right). (D) The expansion of simulated membrane responses to the first cycle of sinusoidal current injections under three conditions. The inter-spike interval (ISI) represents the time difference between the first and second APs. (E) The expansion of simulated NaV currents underlying the burst firing shown in (D). Inset showing the enlargement of first AP. Arrow and green arrowhead point to the generation of resurgent sodium current between APs. Red arrowhead points to zero resurgent sodium current. Blue arrowheads point to the generation of persistent sodium current. AP indicates action potential.

Similar articles

Cited by

References

    1. Shannon RV, Zeng FG, Kamath V, Wygonski J, Ekelid M. Speech recognition with primarily temporal cues. Science. 1995;270:303–304. - PubMed
    1. Anderson S, Skoe E, Chandrasekaran B, Kraus N. Neural timing is linked to speech perception in noise. J Neurosci. 2010;30:4922–4926. doi:10.1523/JNEUROSCI.0107-10.2010. - DOI - PMC - PubMed
    1. Knudsen EI, Konishi M. Mechanisms of sound localization in the barn owl (Tyto alba). J Comp Physiol. 1979;133:13–21. doi:10.1007/bf00663106. - DOI
    1. Knudsen EI, Blasdel GG, Konishi M. Sound localization by the barn owl (Tyto alba) measured with the search coil technique. J Comp Physiol. 1979;133:1–11. doi:10.1007/bf00663105. - DOI
    1. Carr CE, Konishi M. A circuit for detection of interaural time differences in the brain stem of the barn owl. J Neurosci. 1990;10:3227–3246. - PMC - PubMed

LinkOut - more resources