. 2018 Dec 18:7:e39435.
doi: 10.7554/eLife.39435.

The distribution of antibiotic use and its association with antibiotic resistance

Affiliations

The distribution of antibiotic use and its association with antibiotic resistance

Scott W Olesen et al. Elife. .

Abstract

Antibiotic use is a primary driver of antibiotic resistance. However, antibiotic use can be distributed in different ways in a population, and the association between the distribution of use and antibiotic resistance has not been explored. Here, we tested the hypothesis that repeated use of antibiotics has a stronger association with population-wide antibiotic resistance than broadly-distributed, low-intensity use. First, we characterized the distribution of outpatient antibiotic use across US states, finding that antibiotic use is uneven and that repeated use of antibiotics makes up a minority of antibiotic use. Second, we compared antibiotic use with resistance for 72 pathogen-antibiotic combinations across states. Finally, having partitioned total use into extensive and intensive margins, we found that intense use had a weaker association with resistance than extensive use. If the use-resistance relationship is causal, these results suggest that reducing total use and selection intensity will require reducing broadly distributed, low-intensity use.

Keywords: E. coli; S. pyogenes; antibiotic resistance; antimicrobial; epidemiology; global health; infectious disease; microbiology; public health.


Conflict of interest statement

SO, MB, DM, JB, SH, YG No competing interests declared, ML Reviewing editor, eLife

Figures

Figure 1.
Figure 1.. The distribution of antibiotic use within individuals.
Bars indicate the proportion of members in the MarketScan data with different numbers of prescription fills in 2011 for each of the drug groups. TMP/SMX: trimethoprim/sulfamethoxazole.
Figure 1—figure supplement 1.
Figure 1—figure supplement 1.. Cumulative distribution of antibiotic use.
Each point represents a group of people with a certain number of associated claims for any antibiotic, starting at the left with the members with the greatest number of claims. The upper-right line segment shows members with one claim, the next segment shows members with two claims, etc. Colors indicate data years. Panels indicate study population. MarketScan: main data set. Children: MarketScan data including only members 15 and younger.
Figure 2.
Figure 2.. The distribution of antibiotic use across US states.
Each point indicates first use and repeat use of a single drug group in a single US state (averaged over the data years). Points falling on the black line have three times as much first use as repeat use (i.e. repeat use is one-quarter of total use). The curves show the relationships between first use and repeat use expected from the Poisson and geometric distributions. TMP/SMX: trimethoprim/sulfamethoxazole.
Figure 2—figure supplement 1.
Figure 2—figure supplement 1.. Distribution of tetracycline use by age.
Colors indicate data years.
Figure 2—figure supplement 2.
Figure 2—figure supplement 2.. Distribution of antibiotic use by population.
Each point represents average use of a drug group in a state across data years. Children: MarketScan data including only members 15 and younger.
Figure 2—figure supplement 3.
Figure 2—figure supplement 3.. Distribution of antibiotic use by region.
Each point shows use for a drug group in a state, averaged over data years. Colors indicate US Census region (red, South; light red, Midwest; gray, Northeast; black, West). Line shows unweighted linear best fit.
Figure 3.
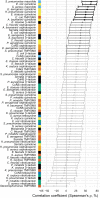
Figure 3.. Correlations between total antibiotic use and resistance are biased toward positive values.
Error bars show 95% confidence intervals. The color strip visually displays the drug groups. Statistical significance is indicated by color of the points (black, significant at FDR = 0.05, two-tailed; dark gray, significant at α = 0.05, two-tailed; light gray, not significant). TMP/SMX: trimethoprim/sulfamethoxazole. CoNS: coagulase-negative Staphylococcus.
Figure 3—figure supplement 1.
Figure 3—figure supplement 1.. Correlations between total antibiotic use and resistance using subsets of the resistance data.
Error bars show 95% confidence intervals. Statistical significance is indicated by color of the points (black, significant at FDR = 0.05, two-tailed; dark gray, significant at α = 0.05, two-tailed; light gray, not significant). IP: inpatient. OP/ER: outpatient/emergency room. TMP/SMX: trimethoprim/sulfamethoxazole. CoNS: coagulase-negative Staphylococcus.
Figure 4.
Figure 4.. Total macrolide use and macrolide resistance among Streptococcus pneumoniae correlate across US states.
Labels indicate selected states. Colors indicate US Census region (red, South; light red, Midwest; gray, Northeast; black, West). Line shows unweighted linear best fit. Southern states have highest macrolide use and resistance.
Figure 5.
Figure 5.. Repeat use tends to be negatively associated with resistance when controlling for first use.
Each point represents a pathogen-antibiotic combination. The position of the point shows the two coefficients from the multiple regression. The units of the coefficients are proportion resistant per annual claim per 1000 people. Color indicates drug group. Error bars show 95% CIs. (a) All data. (b) Same data, showing only the center cluster of points.

Comment in

References

    1. Arason VA, Kristinsson KG, Sigurdsson JA, Stefánsdóttir G, Mölstad S, Gudmundsson S. Do antimicrobials increase the carriage rate of penicillin resistant pneumococci in children? Cross sectional prevalence study. BMJ. 1996;313:387–391. doi: 10.1136/bmj.313.7054.387. - DOI - PMC - PubMed
    1. Arizpe A, Reveles KR, Aitken SL. Regional variation in antibiotic prescribing among medicare part D enrollees, 2013. BMC Infectious Diseases. 2016;16:744. doi: 10.1186/s12879-016-2091-0. - DOI - PMC - PubMed
    1. Bell BG, Schellevis F, Stobberingh E, Goossens H, Pringle M. A systematic review and meta-analysis of the effects of antibiotic consumption on antibiotic resistance. BMC Infectious Diseases. 2014;14:13. doi: 10.1186/1471-2334-14-13. - DOI - PMC - PubMed
    1. Benjamini Y, Hochberg Y. Controlling the False Discovery Rate: A Practical and Powerful Approach to Multiple Testing. Journal of the Royal Statistical Society. 1995;57:289–300. doi: 10.1111/j.2517-6161.1995.tb02031.x. - DOI
    1. Berrington A. Antimicrobial prescribing in hospitals: be careful what you measure. Journal of Antimicrobial Chemotherapy. 2010;65:163–168. doi: 10.1093/jac/dkp399. - DOI - PubMed

Publication types

MeSH terms

Substances