. 2018 Dec 18;9(1):5375.
doi: 10.1038/s41467-018-07787-6.

SCL/TAL1 cooperates with Polycomb RYBP-PRC1 to suppress alternative lineages in blood-fated cells

Affiliations

SCL/TAL1 cooperates with Polycomb RYBP-PRC1 to suppress alternative lineages in blood-fated cells

Hedia Chagraoui et al. Nat Commun. .

Abstract

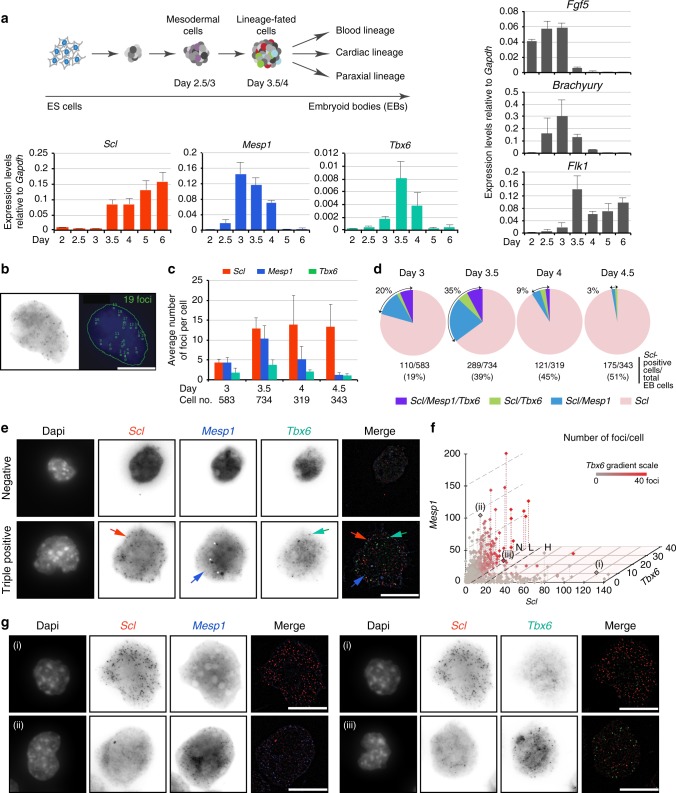
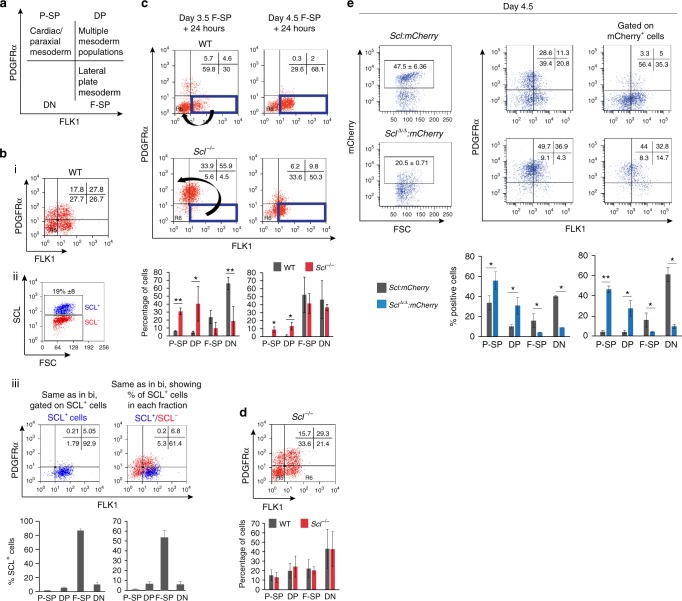
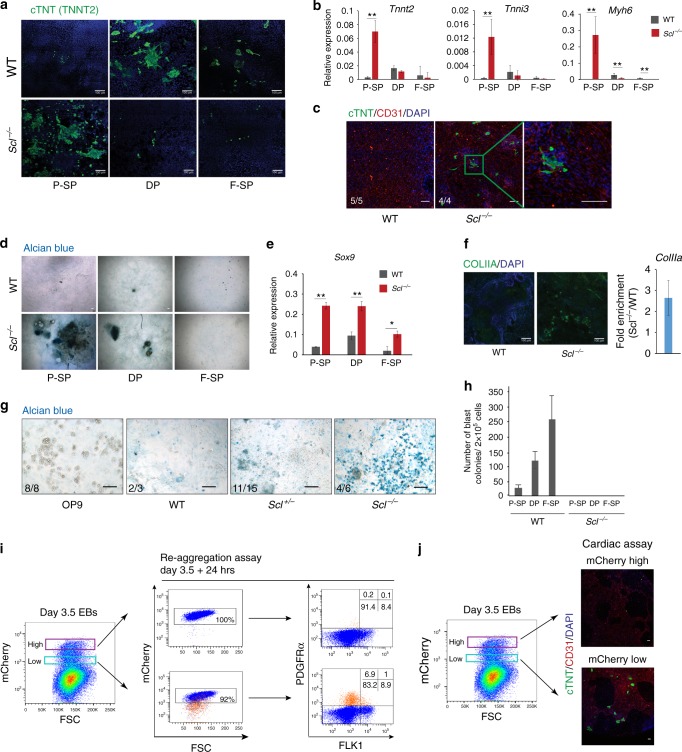
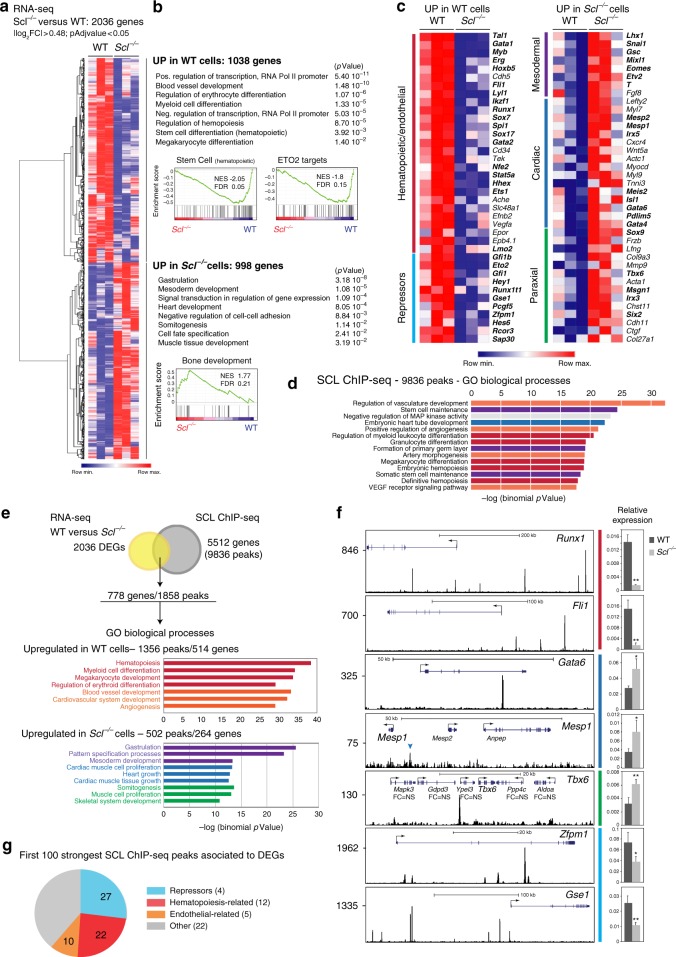
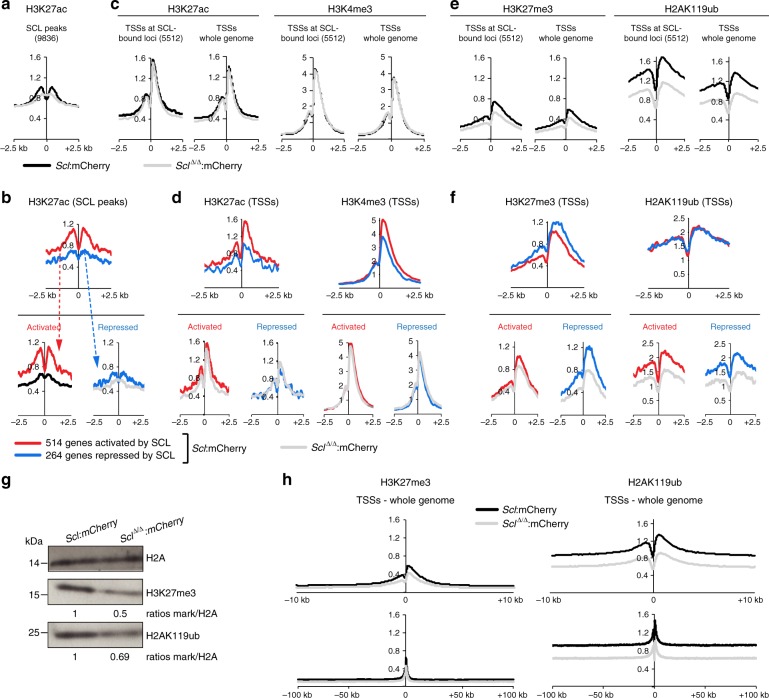
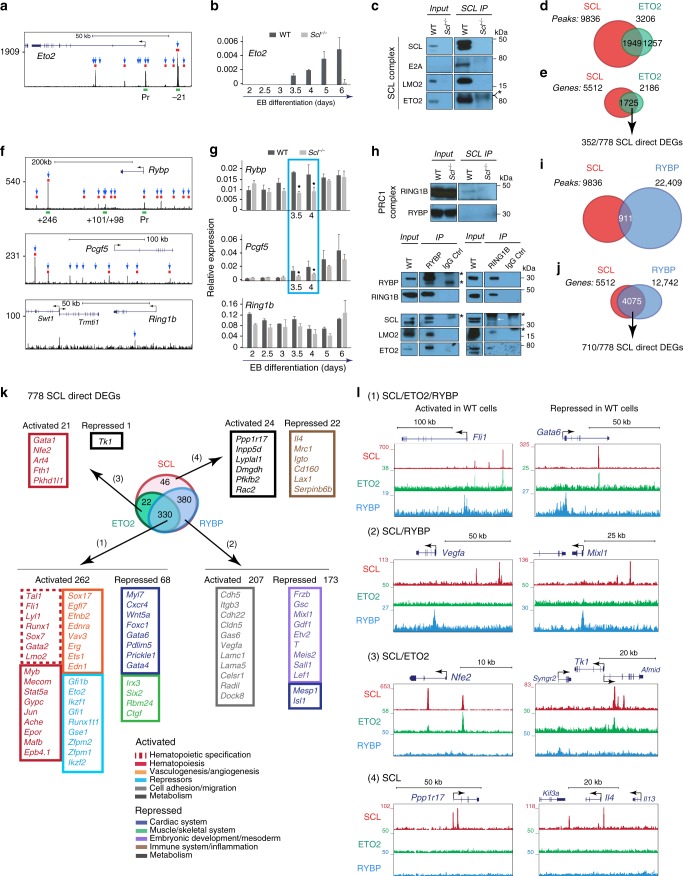
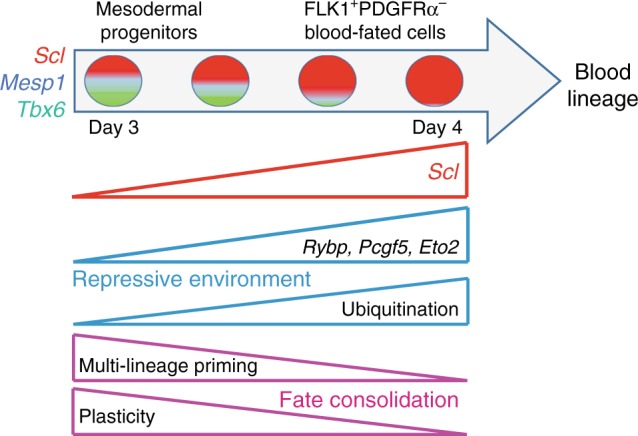
During development, it is unclear if lineage-fated cells derive from multilineage-primed progenitors and whether active mechanisms operate to restrict cell fate. Here we investigate how mesoderm specifies into blood-fated cells. We document temporally restricted co-expression of blood (Scl/Tal1), cardiac (Mesp1) and paraxial (Tbx6) lineage-affiliated transcription factors in single cells, at the onset of blood specification, supporting the existence of common progenitors. At the same time-restricted stage, absence of SCL results in expansion of cardiac/paraxial cell populations and increased cardiac/paraxial gene expression, suggesting active suppression of alternative fates. Indeed, SCL normally activates expression of co-repressor ETO2 and Polycomb-PRC1 subunits (RYBP, PCGF5) and maintains levels of Polycomb-associated histone marks (H2AK119ub/H3K27me3). Genome-wide analyses reveal ETO2 and RYBP co-occupy most SCL target genes, including cardiac/paraxial loci. Reduction of Eto2 or Rybp expression mimics Scl-null cardiac phenotype. Therefore, SCL-mediated transcriptional repression prevents mis-specification of blood-fated cells, establishing active repression as central to fate determination processes.


Conflict of interest statement

The authors declare no competing interests.

Figures

Fig. 1
Fig. 1
Scl, Mesp1 and Tbx6 are transiently co-expressed in single cells. a Top, Schematic of ES/EB in vitro differentiation. Right and bottom, RT-qPCR gene expression analyses from RNA isolated from day 2–6 EB cells (n = 3, mean ± SD). b Example of detection of single mRNA molecules (foci) in a single EB cell by smRNA FISH. Left, raw image. Right, foci detection (green squares) with ImageJ Macro. c Average number of mRNA molecules/cell determined by smRNA FISH for Scl, Mesp1 and Tbx6, from day 3 to 4.5 EBs. Cell no.: number of cells analysed at each time point. d Distribution of Scl-positive cells (Scl/Mesp1/Tbx6, Scl/Tbx6, Scl/Mesp1, Scl-only) in day 3, 3.5, 4, and 4.5 EBs. Total number of EB cells and percentage of Scl-positive cells are indicated for each timepoint. Cells are considered positive for a marker when harbouring 6 or more foci. e smRNA FISH images showing a negative cell (top panel) and a cell positive for Scl, Mesp1 and Tbx6 (bottom panel) from day 3.5 EBs. Arrows indicate typical foci for each mRNA species; white star, background signal. f Significant non-linear negative correlation of expression between Scl and Mesp1 and Scl and Tbx6. Each dot represents a cell from day 3.5 EBs (total cells: 734). X-axis, number of Scl foci per cell; Y-axis, Mesp1 foci; Z-axisTbx6 foci. Numbers of Tbx6 foci are also indicated by a grey-red scale. Examples of Scl/Mesp1 and Scl/Tbx6 negatively correlated cells (i, ii, iii; Fig. 1g) are marked. Correlation coefficients: Scl/Mesp1: −0.2379, p-value < 0.0001, 95% confidence interval (CI): −0.3117/−0.1612; Scl/Tbx6: −0.1504, p-value < 0.002, 95% CI −0.2274/−0.07151. N, L, H: number of Scl foci/cell (N, negative; L, low (6–20 foci); H, high (21–139 foci)). g smRNA FISH images of representative cells showing Sclhigh/Mesp1low (i, left) and Sclhigh/Tbx6low (i, right), Scllow/Mesp1high (ii), Scllow/Tbx6high (iii) mRNA foci. Scale bars: 11.3 μm. See also Supplementary Fig. 2
Fig. 2
Fig. 2
Immunophenotypic conversion of Scl-null FLK1-single positive cells. a Days 3.5/4 ES cell-derived mesodermal populations are functionally defined by expression of cell surface markers FLK1 and PDGFRα. P-SP, PDGFRα single positive; DP, double positive; F-SP, FLK1 single positive; DN, double negative. b (i) Distribution of FLK1- and PDGFRα−positive populations in WT day 3.5 EBs. (ii) SCL protein expression in day 3.5 WT EBs (intra-cellular FACS). (iii) Left, top, distribution of FLK1/PDGFRα-positive cells shown in bi and gated on SCL-positive cells; bottom, mean of 9 independent experiments; Right, top, distribution of SCL+ cells in each FLK1/PDGFRα compartment. Blue events: SCL+ cells, red events: SCL- cells; bottom, mean of 9 independent experiments. c Re-aggregation assays. F-SP populations were FACS-sorted from WT and Scl-/- EBs (left panels, day 3.5; right panels, day 4.5), allowed to re-aggregate for 24 h and analysed for FLK1/PDGFRα expression. The arrows show the different immunophenotypic conversions of WT and Scl-/- cells at day 3.5 + 24 h. Bottom, mean of two independent experiments. d Top, distribution of FLK1-positive and PDGFRα-positive populations in Scl-/- day 3.5 EBs; bottom, comparison with WT cells (shown in bi), mean of 4 independent experiments. e Scl:mCherry and SclΔ/Δ:mCherry reporter lines analysed in day 4.5 EBs. Representative FACS plots of mCherry expression (left), FLK1/PDGFRα expression (middle) and FLK1/PDGFRα plots gated on mCherry-positive cells (right) are shown. Below, mean of 2 independent experiments. Mean ± SD is shown in be; student’s t-test, *p < 0.05, **p < 0.01. Scale bars, 100 μm. See also Supplementary Fig. 3
Fig. 3
Fig. 3
Scl-null cells acquire cardiac and paraxial potentials. ac Cardiac assays. a Day 3.5 WT and Scl-/- P-SP, DP, and F-SP populations were replated in cardiac condition for 7 days and cTNT (cardiac troponin) expression monitored by immunofluorescence (IF); scale bar, 100 μm. b RT-qPCR analysis of cardiac gene expression (Tnnt2, Tnni3 and Myh6) relative to Gapdh in cultures shown in a; n = 3–5. c Day E9.5 WT and Scl-/- mouse yolk sacs replated in cardiac assay for 7 days. IF reveals cardiomyocytes (cTNT, green), endothelium (CD31, red) and nuclei (DAPI, blue). dg Chondrogenic assays. d Day 3.5 WT and Scl-/- P-SP, DP and F-SP populations were replated in chondrogenic condition for 21 days. Alcian blue staining reveals glycosaminoglycan clusters; e RT-qPCR analysis of Sox9 expression relative to Gapdh in cultures shown in d, n = 2. f Collagen IIa (ColIIa) expression following culture of day 3.5 WT and Scl-/- EB cells in chondrogenic condition (left, IF: COLIIA green, DAPI blue; right, RT-qPCR analysis) n = 2. g Alcian blue staining of day 18 chondrogenic cultures from day E9.5 WT, Scl+/- and Scl-/- mouse yolk sacs. OP9, no yolk sac cells. c, g Number of embryos presenting the phenotype shown is indicated for each genotype. h Blast colony assay showing number of endothelial/haematopoietic colonies obtained from day 3.5 WT and Scl-/- purified mesodermal populations (P-SP, DP, F-SP); n = 3. i Left: day 3.5 Scl:mCherry WT cells were FACS-sorted according to the level of mCherry (and therefore SCL) expression into low and high fractions. Right: mCherryhigh and mCherrylow cells were re-aggregated for 24 h, and mCherry (left) and FLK1/PDGFRα (right) expression re-assessed. Note that only the day 3.5 mCherrylow fraction produced a PDFGRα+ population (bottom right panel, orange events). At day 3.5 + 24 h, the majority of the PDGFRα+ cells have lost mCherry expression (bottom left panel, orange events). j Day 3.5 Scl:mCherryhigh and Scl:mCherrylow FACS-sorted cells were replated in cardiac assay. IF reveals cardiomyocytes (cTNT, green), endothelium (CD31, red) and nuclei (DAPI, blue). Mean ± SD is shown (b), (e), (f), (h); student’s t-test, *p < 0.05, **p < 0.01. Scale bars, 100 μm. See also Supplementary Fig. 3
Fig. 4
Fig. 4
SCL controls distinct gene regulatory networks in day 3.5 FLK1+ cells. a Hierarchical clustering of RNA-seq data from day 3.5 WT and Scl-/- FLK1+ EB cells. b Gene ontology (GO) processes associated to differentially expressed genes (DEGs) (PANTHER and GSEA analyses). c Heatmap showing selected DEGs associated to GO processes identified in b. In bold, transcriptional regulators. d The top more significant GO biological processes associated to SCL-bound loci (GREAT analysis). e Integration of SCL ChIP-seq and RNA-seq data reveals 778 SCL direct differentially expressed target genes. Below, GO terms attributed to DEG-associated peaks (GREAT analysis). f Left, SCL ChIP-seq tracks of selected direct DEGs; FC = NS, fold-change in expression in Scl-/- cells is not significant (RNA-seq data). Tbx6 locus: the SCL peak was attributed to Tbx6, the closet DEG. Right, RT-qPCR gene expression analysis relative to Gapdh from WT and Scl-/- day 3.5 FLK1+ cells. n = 3, mean ± SD; student’s t-test, *p < 0.05, **p < 0.01. Colour code, same as in c. g Biological functions attributed to the 100 strongest DEG-associated SCL ChIP-seq peaks. In brackets, numbers of genes in each category. See also Supplementary Data 1, 2
Fig. 5
Fig. 5
SCL loss-of-function affects the epigenetic landscape of blood-fated progenitors. a, c, e Distribution plots of normalised histone mark ChIP-seq signals in mCherry+ cells purified from Scl:mCherry and SclΔ/Δ:mCherry day 4 EBs. Signals are sorted on SCL ChIP-seq peaks (a H3K27ac only), TSSs of SCL-bound 5512 genes and TSSs across the whole genome, ±2.5 kb, (c activation associated-marks H3K27ac and H3K4me3; e repression associated-marks H3K27me3 and H2AK119ub). b, d, f Distribution plots of normalised histone mark ChIP-seq signals in mCherry+ cells purified from Scl:mCherry and SclΔ/Δ:mCherry day 4 EBs on SCL direct DEGs (514 activated genes (red) and 264 repressed genes (blue)). Signals are sorted on SCL ChIP-seq peaks associated to SCL direct DEGs (b H3K27ac only) and TSSs of SCL direct DEGs, ± 2.5 kb (d, activation associated-marks; f repression associated-marks). Top, Scl:mCherry EB cells; bottom, Scl:mCherry and SclΔ/Δ:mCherry EB cells. g Western blot analysis of H3K27me3 and H2AK119ub levels in mCherry+ cells purified from Scl:mCherry and SclΔ/Δ:mCherry day 4 EBs. H2A, loading control. Relative levels of each histone mark over H2A in mutant versus control cells are indicated. n = 2. h Distribution plots of normalised H3K27me3 and H2AK119ub ChIP-seq signals in mCherry+ cells purified from Scl:mCherry and SclΔ/Δ:mCherry day 4 EBs. Signals are sorted on TSSs across the whole genome; top, ±10 kb, bottom, ±100 kb. See also Supplementary Figs. 4, 8
Fig. 6
Fig. 6
Genome-wide binding of SCL, ETO2 and RYBP in FLK1+ cells. a SCL ChIP-seq track of Eto2 locus in day 3.5 FLK1+ EB cells. Blue arrows, SCL peaks associated to Eto2; red rectangles, ATAC peaks; green rectangles, SCL-bound cis-elements further detailed in Supplementary Fig. 5. b RT-qPCR analyses of Eto2 mRNA expression from WT and Scl-/- EB differentiation kinetics (day 2–day 6) relative to Gapdh. n = 3–5, mean ± SD; student’s t-test *p < 0.05. c Western blot analysis of day 4.5 WT EB nuclear extracts immunoprecipitated (IP) with anti-SCL antibodies. Members of SCL complex are detected as indicated. n = 3. d Overlap between SCL and ETO2 ChIP-seq peaks. e Overlap between SCL-bound and ETO2-bound genes. 352 of these are SCL direct DEGs. f SCL ChIP-seq track of Rybp, Pcgf5 and Ring1b loci in day 3.5 FLK1+ EB cells. Blue arrows, SCL peaks associated to the genes; red rectangles, ATAC peaks; green rectangles, SCL-bound cis-elements further detailed in Supplementary Fig. 5. g RT-qPCR analyses of Rybp, Pcgf5 and Ring1b mRNA expression from WT and Scl-/- EB differentiation kinetics (day 2–day 6) relative to Gapdh. n = 3–5, mean ± SD; student’s t-test *p < 0.05. h Western blot analysis of day 4.5 WT EB nuclear extracts immunoprecipitated (IP) with anti-SCL antibodies (top), -RYBP (bottom, left) and -RING1B (bottom, right) antibodies. Members of PRC1 complex (RING1B, RYBP) and SCL complex (LMO2, ETO2) are detected as indicated. Asterisk (*) indicates heavy or light IgG chain. White arrow indicates SCL band in RING1B IP. i Overlap between SCL and RYBP ChIP-seq peaks. j Overlap between SCL-bound and RYBP-bound genes. Seven hundred and ten of these are SCL direct DEGs. k Overlap between SCL-bound, ETO2-bound, and RYBP-bound 778 SCL direct DEGs. Number and representative examples of SCL direct target genes in the four categories defined by SCL, ETO2, and RYBP binding are shown. l UCSC tracks showing SCL, ETO2 and RYBP binding on examples of activated and repressed SCL direct DEGs in the four categories defined by SCL, ETO2, and RYBP binding. See also Supplementary Figs. 4–6 and 9, Supplementary Data 3
Fig. 7
Fig. 7
Rybp and Eto2 knock-down phenocopies Scl-/- cardiac phenotype. a Outline of functional assays. be siRNA-mediated Eto2 (siEto2) and Rybp (siRybp) knock-down in day 3.5 EBs. b qRT-PCR analysis of Eto2 and Rybp mRNA levels. Analysis from day 3.5 WT and Scl-/- EB cells is shown for comparison. siNeg, siRNA negative control; n = 4. c Western blot analysis of RYBP and H2AK119ub levels. mSIN3A and H2A, loading controls; n = 2. d, e Day 3.5 WT, Scl-/-, siEto2-treated, siRybp-treated and siNeg-treated EB cells were plated in cardiac condition. cTNT expression was monitored at day 7 by IF (d, top) and intra-cellular FACS (d, bottom). Quantitation of FACS data from Scl-/-, siEto2- and siRybp-treated cultures is shown as Scl-/-/WT, siEto2/siNeg and siRybp/siNeg ratios (e); n = 2. Scale bars, 100 μm. f qRT-PCR analysis of Rybp expression in day 3.5 untreated (UN), tamoxifen- (TAM) and ethanol (EtOH)-treated CreERT2:Rybpfl/fl EBs; n = 2. g Day 3.5 untreated, EtOH-treated or TAM-treated CreERT2:Rybpfl/fl cells were plated in cardiac condition. cTNT expression was assessed at day 7 by IF (green, left) and qRT-PCR analysis (Tnnt2, shown as TAM/ETOH fold increase, right). Scale bar, 100 μm. n = 2. h Day 3.5 WT, Scl-/-, siEto2-treated, siRybp-treated and siNeg-treated EB cells were plated in blast colony assay; n = 2. i Western blot analysis of H2AK119ub in day 3.5 EB cells treated with increasing concentrations of PRC1 inhibitor (PRT4165). UNT, untreated; αTubulin and H2A, loading controls, n = 2. j PRC1 inhibitor or DMSO-treated EBs were plated in cardiac assay, and cTNT expression assessed at day 7 by IF (green, top), FACS (bottom) and qRT-PCR (Tnnt2, right); n = 3. k Western blot analysis of H3K27me3 in day 3.5 EB cells treated with increasing concentrations of PRC2 inhibitor or analogue. mSIN3A, loading control, n = 2. l Day 3.5 EB cells treated with PRC2 inhibitor or analogue were plated in cardiac condition, and cTNT expression assessed at day 7 by IF (green, left) and qRT-PCR (Tnnt2, right). n = 2. Scale bars, 100 μm. Mean ± SD is shown in b, f, h, j, l; mean of ratios of mutant samples versus controls ± SD is shown in e, g; student’s t-test, *p < 0.05. See also Supplementary Fig. 8
Fig. 8
Fig. 8
Model of SCL’s functions in blood lineage specification. Single mesodermal cells co-express blood (Scl), cardiac (Mesp1) and paraxial (Tbx6)-affiliated transcriptional regulators at low levels, establishing multi-lineage priming and cellular plasticity. As differentiation progresses, Scl levels increase in FLK1+PDGFRα cells. SCL establishes a global repressive environment by activating potent transcriptional repressors (Rybp/Pcgf5/Eto2) and ensuring genome-wide, high H2AK119Ub levels. This leads to decreased Mesp1 and Tbx6 levels and repression of alternative fates. Activation of blood/endothelial gene expression programmes together with decreased plasticity allows consolidation of the blood fate and specification of the hematopoietic lineage

References

    1. Arnold SJ, Robertson EJ. Making a commitment: cell lineage allocation and axis patterning in the early mouse embryo. Nat. Rev. Mol. Cell Biol. 2009;10:91–103. doi: 10.1038/nrm2618. - DOI - PubMed
    1. Robertson EJ. Dose-dependent Nodal/Smad signals pattern the early mouse embryo. Semin. Cell. Dev. Biol. 2014;32:73–79. doi: 10.1016/j.semcdb.2014.03.028. - DOI - PubMed
    1. Tam PP, Parameswaran M, Kinder SJ, Weinberger RP. The allocation of epiblast cells to the embryonic heart and other mesodermal lineages: the role of ingression and tissue movement during gastrulation. Development. 1997;124:1631–1642. - PubMed
    1. Kinder SJ, et al. The orderly allocation of mesodermal cells to the extraembryonic structures and the anteroposterior axis during gastrulation of the mouse embryo. Development. 1999;126:4691–4701. - PubMed
    1. Porcher C, Chagraoui H, Kristiansen MS. SCL/TAL1: a multifaceted regulator from blood development to disease. Blood. 2017;129:2051–2060. doi: 10.1182/blood-2016-12-754051. - DOI - PubMed

Publication types

MeSH terms