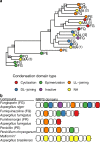
Uncovering secondary metabolite evolution and biosynthesis using gene cluster networks and genetic dereplication
- PMID: 30560908
- PMCID: PMC6298953
- DOI: 10.1038/s41598-018-36561-3
Uncovering secondary metabolite evolution and biosynthesis using gene cluster networks and genetic dereplication
Abstract
The increased interest in secondary metabolites (SMs) has driven a number of genome sequencing projects to elucidate their biosynthetic pathways. As a result, studies revealed that the number of secondary metabolite gene clusters (SMGCs) greatly outnumbers detected compounds, challenging current methods to dereplicate and categorize this amount of gene clusters on a larger scale. Here, we present an automated workflow for the genetic dereplication and analysis of secondary metabolism genes in fungi. Focusing on the secondary metabolite rich genus Aspergillus, we categorize SMGCs across genomes into SMGC families using network analysis. Our method elucidates the diversity and dynamics of secondary metabolism in section Nigri, showing that SMGC diversity within the section has the same magnitude as within the genus. Using our genome analysis we were able to predict the gene cluster responsible for biosynthesis of malformin, a potentiator of anti-cancer drugs, in 18 strains. To proof the general validity of our predictions, we developed genetic engineering tools in Aspergillus brasiliensis and subsequently verified the genes for biosynthesis of malformin.
Conflict of interest statement
The authors declare no competing interests.
Figures


Similar articles
-
Recent advances in reconstructing microbial secondary metabolites biosynthesis in Aspergillus spp.Biotechnol Adv. 2018 May-Jun;36(3):739-783. doi: 10.1016/j.biotechadv.2018.02.001. Epub 2018 Feb 5. Biotechnol Adv. 2018. PMID: 29421302 Review.
-
Gene regulatory network resource aids in predicting trans-acting regulators of biosynthetic gene clusters in Aspergillus fumigatus.mBio. 2025 Mar 12;16(3):e0387424. doi: 10.1128/mbio.03874-24. Epub 2025 Feb 18. mBio. 2025. PMID: 39964163 Free PMC article.
-
Current status of secondary metabolite pathways linked to their related biosynthetic gene clusters in Aspergillus section Nigri.Nat Prod Rep. 2023 Feb 22;40(2):237-274. doi: 10.1039/d1np00074h. Nat Prod Rep. 2023. PMID: 35587705 Review.
-
Comprehensive annotation of secondary metabolite biosynthetic genes and gene clusters of Aspergillus nidulans, A. fumigatus, A. niger and A. oryzae.BMC Microbiol. 2013 Apr 26;13:91. doi: 10.1186/1471-2180-13-91. BMC Microbiol. 2013. PMID: 23617571 Free PMC article.
-
Comparative genomics reveals high biological diversity and specific adaptations in the industrially and medically important fungal genus Aspergillus.Genome Biol. 2017 Feb 14;18(1):28. doi: 10.1186/s13059-017-1151-0. Genome Biol. 2017. PMID: 28196534 Free PMC article.
Cited by
-
Ancient Antibiotics, Ancient Resistance.EcoSal Plus. 2021 Mar;9(2):eESP-0027-2020. doi: 10.1128/ecosalplus.ESP-0027-2020. EcoSal Plus. 2021. PMID: 33734062 Free PMC article. Review.
-
An interpreted atlas of biosynthetic gene clusters from 1,000 fungal genomes.Proc Natl Acad Sci U S A. 2021 May 11;118(19):e2020230118. doi: 10.1073/pnas.2020230118. Proc Natl Acad Sci U S A. 2021. PMID: 33941694 Free PMC article.
-
Bidirectional histone-gene promoters in Aspergillus: characterization and application for multi-gene expression.Fungal Biol Biotechnol. 2019 Dec 9;6:24. doi: 10.1186/s40694-019-0088-3. eCollection 2019. Fungal Biol Biotechnol. 2019. PMID: 31867115 Free PMC article.
-
Metagenomics Shines Light on the Evolution of "Sunscreen" Pigment Metabolism in the Teloschistales (Lichen-Forming Ascomycota).Genome Biol Evol. 2023 Feb 3;15(2):evad002. doi: 10.1093/gbe/evad002. Genome Biol Evol. 2023. PMID: 36634008 Free PMC article.
-
A New Pathway for Mannitol Metabolism in Yeasts Suggests a Link to the Evolution of Alcoholic Fermentation.Front Microbiol. 2019 Nov 1;10:2510. doi: 10.3389/fmicb.2019.02510. eCollection 2019. Front Microbiol. 2019. PMID: 31736930 Free PMC article.
References
-
- Martínez-Núñez MA, et al. Nonribosomal peptides synthetases and their applications in industry. Sustainable Chemical Processes. 2016;4:13. doi: 10.1186/s40508-016-0057-6. - DOI
Publication types
MeSH terms
Grants and funding
LinkOut - more resources
Full Text Sources
Research Materials

