. 2018 Dec 18;9(1):5372.
doi: 10.1038/s41467-018-07788-5.

Hidden heterogeneity and circadian-controlled cell fate inferred from single cell lineages

Affiliations

Hidden heterogeneity and circadian-controlled cell fate inferred from single cell lineages

Shaon Chakrabarti et al. Nat Commun. .

Abstract

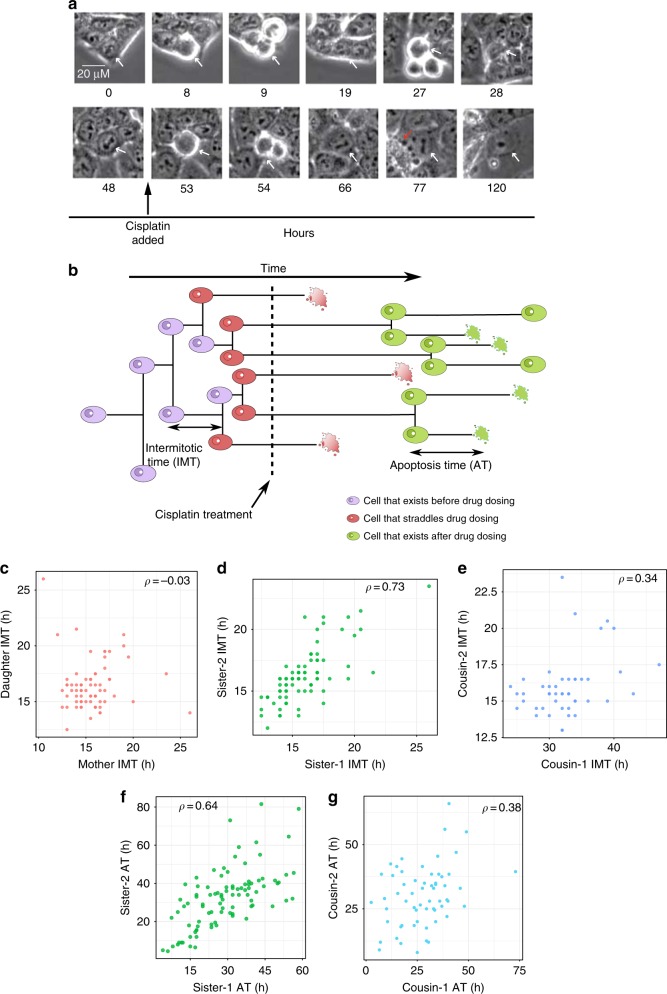
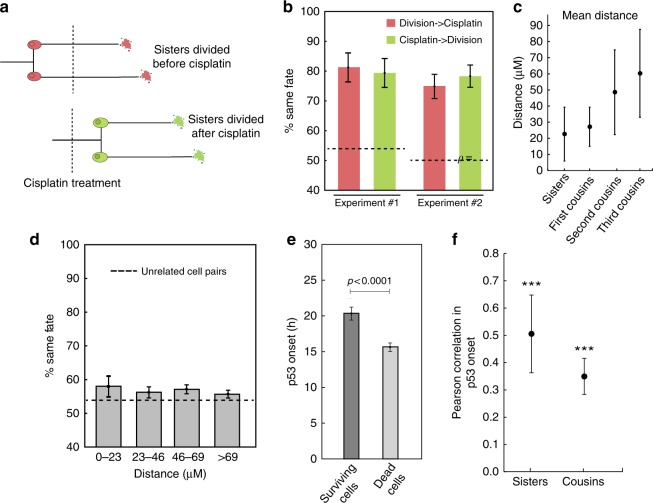
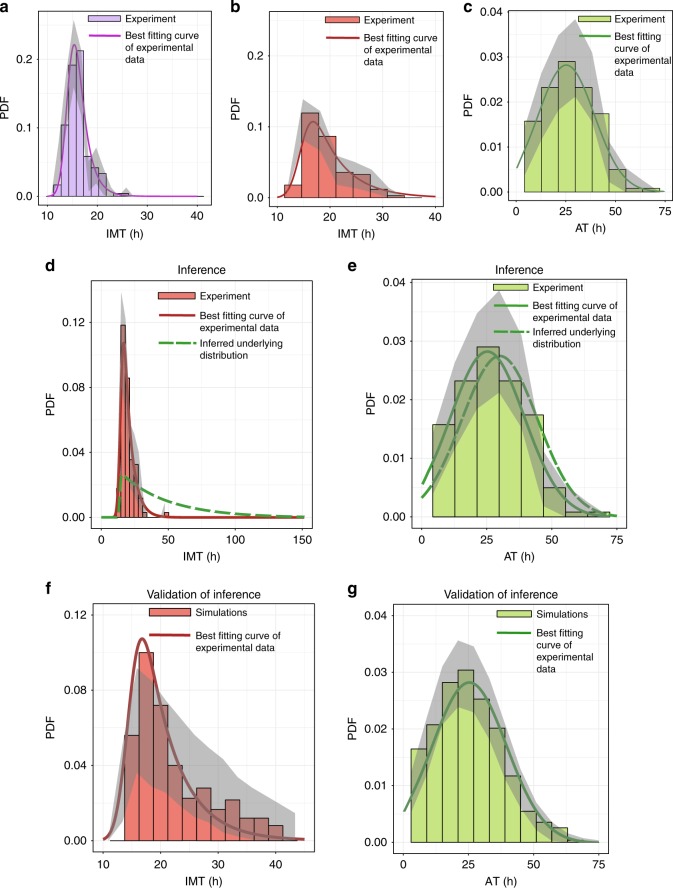
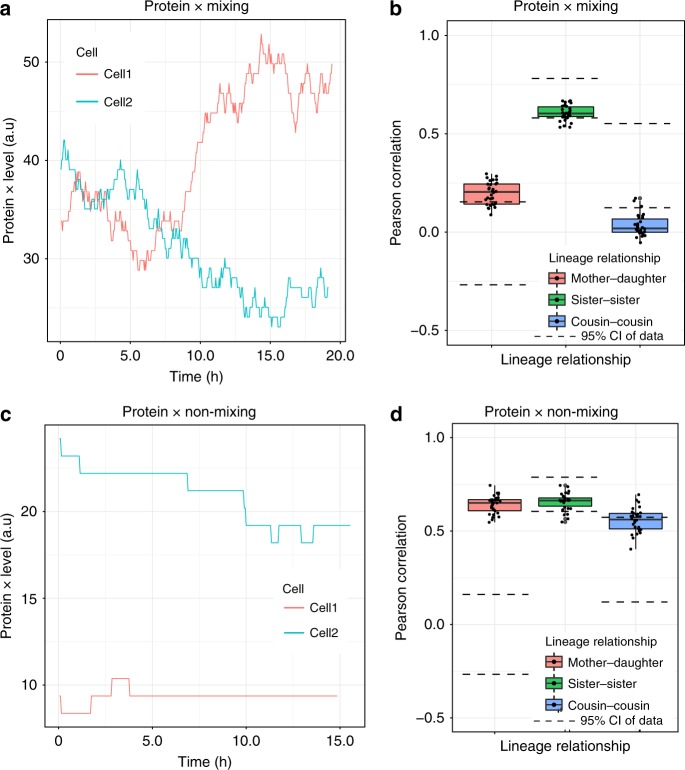
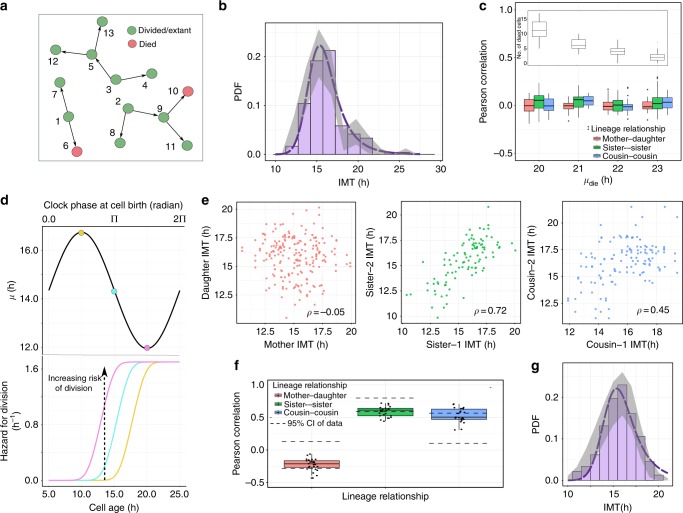
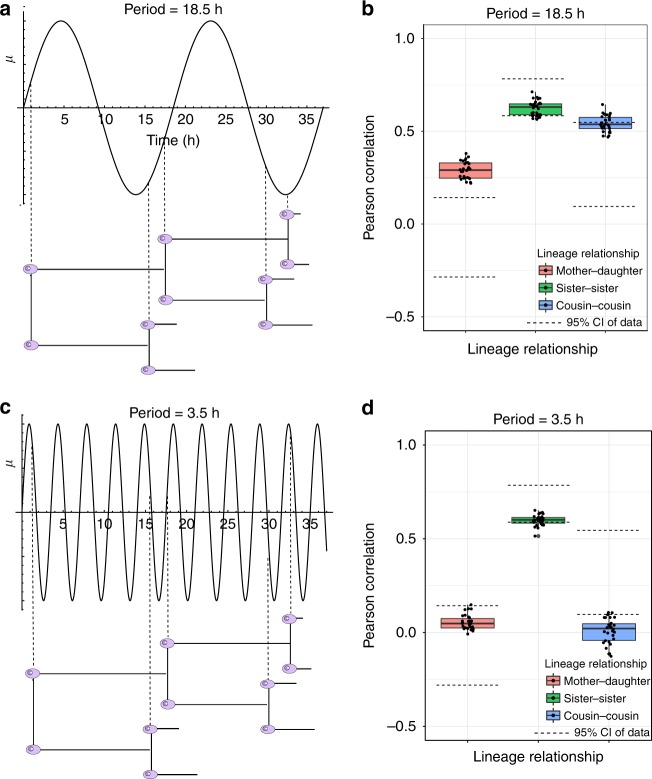
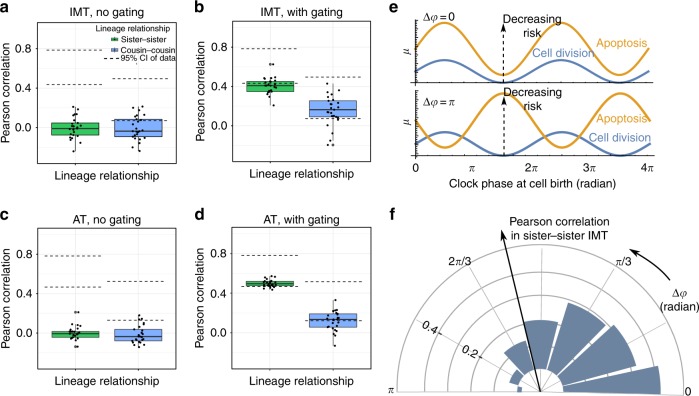
The origin of lineage correlations among single cells and the extent of heterogeneity in their intermitotic times (IMT) and apoptosis times (AT) remain incompletely understood. Here we developed single cell lineage-tracking experiments and computational algorithms to uncover correlations and heterogeneity in the IMT and AT of a colon cancer cell line before and during cisplatin treatment. These correlations could not be explained using simple protein production/degradation models. Sister cell fates were similar regardless of whether they divided before or after cisplatin administration and did not arise from proximity-related factors, suggesting fate determination early in a cell's lifetime. Based on these findings, we developed a theoretical model explaining how the observed correlation structure can arise from oscillatory mechanisms underlying cell fate control. Our model recapitulated the data only with very specific oscillation periods that fit measured circadian rhythms, thereby suggesting an important role of the circadian clock in controlling cellular fates.


Conflict of interest statement

The authors declare no competing interests.

Figures

Fig. 1
Fig. 1
Correlations in HCT116 cells before and after cisplatin treatment in a single cell lineage-tracking experiment. a Example of live-cell imaging of a single cell before and after cisplatin. The white arrow points to the cell tracked. The red arrow at hour 77 highlights an apoptotic cell. Images are shown for each cell division. Scale in top left image is 20 μm. b Cartoon representation of the time-lapse microscopy experiment. Cells that are born and divide before cisplatin addition are colored purple, cells born before cisplatin treatment that eventually divide or die after treatment are red, and cells that exist purely after cisplatin administration are in green. ce Lineage correlations in inter-mitotic times of cells existing before cisplatin treatment (purple cells in b). Pearson correlations (ρ) are shown on top of each panel, and colors for lineage correlations are maintained throughout the text. The mother–daughter correlation is ρ=-0.03 for 71 pairs, P-val = 0.7, 95% CI [−0.26, 0.16]. The sister correlation is ρ=0.73 for 80 pairs, P-val = 2.9 × 10−14, 95% CI [0.6, 0.8]. The cousin correlation is ρ = 0.34 for 46 pairs, P-val = 0.02, 95% CI [0.1, 0.57]. Cousin correlations are higher than the mother–daughter correlation, a phenomenon called the cousin–mother inequality. f, g Lineage correlations in times to death of cells treated with cisplatin (red and green cells in b). Note that by definition mother–daughter pairs do not exist for cells that die. ρ~0.64 for 93 sister pairs, P-val = 3.09 × 10−12, 95% CI [0.48, 0.78]; ρ~0.38 for 60 cousin pairs, P-val = 0.001, 95% CI [0.15, 0.54]. Statiistical significance of the correlations was computed by a t-test (Supplementary section 1)
Fig. 2
Fig. 2
Cell fate and p53 dynamics are correlated in sisters and cousins. a Sister cell pairs were divided into two groups: those that divided before or after cisplatin treatment. b The percentage of sisters in each group that share the same fate. Experiment #1 N = 61, N = 108, for experiment #2 N = 150, N = 150. The dashed lines represent the % of unrelated cells that share the same fate. c Mean distance separating cells when cisplatin was added by relationship N = 61, 259, 414, 533. The centroid of the nucleus was used for the location of each cell. Euclidean distances were computed for every pair of cells. d % of unrelated cell pairs that share the same fate grouped by distance separating cells when cisplatin was added. N = 243, 896, 1341, 1791. Sister cells were on average 23 μM apart. The dashed line is the same as in b Error bars for c, d are standard deviation. e p53 onset in apoptotic cells was faster than in surviving cells. N = 144, 250. Error bars represent standard error of the mean. Significance by t-test (f) p53 onset was correlated among sister and cousin cells. ***P < .0001. See methods for calculations of significance
Fig. 3
Fig. 3
Quantifying hidden heterogeneity induced by cisplatin. The color code follows Fig. 1b. a Probability density function (PDF) of the IMT before cisplatin treatment, with a mean of 16.1 h. b IMT PDF of cells straddling the cisplatin administration event. Mean time is 20 h, indicating a slowing down of the cell cycle after cisplatin administration. As explained in the main text, this is a biased estimate of the mean cell cycle time. c Apoptosis time PDF measured directly from the data. The experimental data in ac are shown as histograms derived from 160, 104, and 186 data points respectively. The corresponding best-fitting Exponentially Modified Gaussian (EMG) distributions are shown as solid curves. Gray shaded areas represent 95% confidence intervals generated from 1000 bootstrapped samples of the data. Parameters for the curves are given in Supplementary section 4. d, e Experimental data and inferences from our algorithm. d The inferred IMT distribution after cisplatin addition is shown as a green dashed curve. The inferred heterogeneity using our statistical model (standard deviation of the green dashed curve) is 33.05 h while existing inference techniques using the red histogram would have incorrectly concluded 5.65 h. e The inferred apoptosis time distribution after cisplatin is shown as a green dashed curve. As expected for a scenario where the average death rate is higher than the division rate, the inferred time to death distribution is not heavily biased, unlike the inferred IMT distribution in d. fg Validation of our inferences using birth-death process simulations. f The histogram represents one example of the observed IMT distribution from our birth-death process simulations, using the data generating the green dashed lines from panels d and e as inputs. The close match between the histogram and the red solid line representing the data validates our inference procedure and inferred IMT distribution. g Similar to f, but for the apoptosis time distribution. Parameters for the inferred distributions (dashed lines) are given in Supplementary Table 5 and parameters obtained from fits to the data (solid red or green lines) are given in the Supplementary section 4. The gray shaded areas in f, g denote 95% confidence intervals generated from 500 simulations
Fig. 4
Fig. 4
A simple model of cell division control by fluctuating protein levels cannot recapitulate the cousin-mother inequality. a Levels of protein X as a function of time during the lifetimes of two cells. The protein is said to be “mixing” since the production and degradation rates are high, leading to loss of memory of the initial protein level over the cellular lifetime. b Lineage correlations from 30 simulations (shown as black dots) generated by a model where the Protein X level passed on from mother to daughter cells control the hazard function for division of the daughters. As can be seen, the cousin-mother inequality cannot be recapitulated by this model and the mixing property of Protein X leads to negligible cousin correlations. c Protein X levels as functions of time in two cells when the protein is “non-mixing”: in this case, the production and degradation rates are low and hence the memory of the initial protein level is retained at the end of the cell’s lifetime. d Lineage correlations from 30 simulations (black dots) for the case of non-mixing Protein X. Once again the cousin–mother inequality cannot be explained, and the non-mixing property of Protein X leads to very large mother–daughter correlations. Parameters for the models in both b and d were chosen to recapitulate the correct sister correlation as observed in our experimental data (details in Supplementary section 6). The boxplots represent the 1st, 2nd, and 3rd quartiles of the lineage correlations generated in the simulations
Fig. 5
Fig. 5
Coupling of the cell cycle to the circadian rhythm is required to explain correlations in the absence of cisplatin. a Birth-death process simulations keeping track of lineage relationships. Three ancestor cells and their progeny are shown here as examples. Directed edges represent mother–daughter relationships. b, c Results of a null model with no circadian gating. b The IMT distribution before cisplatin (purple dashed line, EMG parameters in Supplementary Table 4) is almost identical to the experimental data (histogram, EMG parameters in Supplementary section 4). The gray shaded area represents 95% confidence intervals generated from 1000 bootstrap samples of the data. c Pearson correlations between cell pairs as μdie of the EMG function is varied. The inset shows the number of dead cells in 25 simulation runs, for different values of μdie. dg Model incorporating circadian gating of the cell cycle and results. d A model for the coupling of the circadian clock to the cell cycle. As the phase of the clock at cell birth varies between 0 and 2π, the parameter μ of the EMG function for division varies, thereby controlling the hazard for cell division (top). Three hazard functions corresponding to three phases of the clock are shown in matched colors (bottom), modeling different division risks for three cells born at different phases of the clock. e Instances of Pearson correlations in IMT (ρ) generated from the model with circadian gating of the cell cycle. f The cousin–mother inequality and the magnitude of all lineage correlations are recapitulated with the model for circadian gating of the cell cycle. The dashed lines indicate the 95% confidence intervals of the IMT correlations as measured from the data. g The histogram represents one example of the IMT distribution generated by our simulations incorporating circadian gating. Gray shaded area represents 95% confidence intervals generated from 500 simulation runs. The dashed line represents the inferred IMT distribution, as in b. All parameters used for simulated results in eg are provided in Supplementary section 6. All boxplots represent the 1st, 2nd, and 3rd quartiles of the lineage correlations generated from 25 simulation runs
Fig. 6
Fig. 6
Most oscillator time periods fail to capture the correlation structure in intermitotic times. a Schematic of an oscillator with an 18.5 h gating of the cell cycle. The inter-mitotic times shown are ~16 h, as observed in the pre-cisplatin HCT116 cells. The standard deviation was chosen as ~2 h to mimic the inferred width of the IMT distribution in Fig. 5b. The dashed vertical lines indicate the phase of the oscillator when a particular cell was born. Similar phases at cell birth result in positively correlated cell division times. This schematic provides an intuitive explanation for the correlation structure obtained from simulations shown in b. b Lineage correlations obtained from simulations when the oscillator has a time period of 18.5 h. The mother–daughter correlations are larger than observed in the data. c Similar to a but for an oscillator with a 3.5 h period. The rapid oscillations and IMT heterogeneity combine to result in random phases at which cousins are born, leading to negligible cousin-correlations as seen in d. d Similar to b but for an oscillator with a 3.5 h period. The cousin correlation is negligible and hence does not recapitulate the experimental data. Parameters used to generate these plots were chosen to generate observed sister correlations (details in Supplementary section 6). All boxplots represent the 1st, 2nd, and 3rd quartiles of the lineage correlations generated from 30 simulation runs
Fig. 7
Fig. 7
In-phase gating of cell cycle and apoptosis pathways by the circadian clock. a Analysis of correlations in IMT generated by the model with no circadian gating and b with circadian gating of both the cell cycle and apoptosis pathways. c Analysis of correlations in apoptosis times (AT) generated by the model with no circadian gating and d with circadian gating of both the cell cycle and apoptosis pathways. Note that the high correlations observed in d cannot be obtained with a model that has only circadian gating of the cell cycle, and no coupling to cell death (see Supplementary Figure 11). In ad the dashed lines represent the 95% confidence intervals of the respective correlations as calculated from the data while the boxplots represent the 1st, 2nd, and 3rd quartiles of the lineage correlations generated from 25 simulation runs. The fraction of simulation runs resulting in correlation values within the 95% confidence intervals remains approximately the same when increasing the number of simulations from 25 to 150 in b and d. e Two extreme examples of completely in phase gating (top) and completely out of phase gating (bottom) of the cell cycle and apoptosis pathways. The curves represent the parameter μ of the EMG function. Blue represents μ for cell division while yellow is the corresponding μ for cell death. Note that increasing μ corresponds to decreasing risk, for both division and death. f Effect of increasing the phase difference Δφ between gating of cell cycle and cell death pathways on the sister correlations in IMT. The concentric rings indicate correlation levels and the blue bars denote the median correlations in IMT generated from 25 simulation runs, for different values of Δφ. Parameters used to generate the simulated results are given in Supplementary section 6

References

    1. Hartwell LH, Culotti J, Pringle JR, Reid BJ. Genetic control of the cell division cycle in yeast. Science. 1974;183:46–51. doi: 10.1126/science.183.4120.46. - DOI - PubMed
    1. Nurse P. Genetic control of cell size at cell division in yeast. Nature. 1975;256:547–551. doi: 10.1038/256547a0. - DOI - PubMed
    1. Hartwell LH, Weinert TA. Checkpoints: controls that ensure the order of cell cycle events. Science. 1989;246:629–634. doi: 10.1126/science.2683079. - DOI - PubMed
    1. Milestones in cell division. Nat. Cell Biol. 3, E265–E265 (2001). - PubMed
    1. Cardone L, Sassone-Corsi P. Timing the cell cycle. Nat. Cell Biol. 2003;5:859–861. doi: 10.1038/ncb1003-859. - DOI - PubMed

Publication types