Comparative Study
. 2018 Dec 18;7(24):e010711.
doi: 10.1161/JAHA.118.010711.

Metabolomic Fingerprinting of Infants Undergoing Cardiopulmonary Bypass: Changes in Metabolic Pathways and Association With Mortality and Cardiac Intensive Care Unit Length of Stay

Affiliations
Comparative Study

Metabolomic Fingerprinting of Infants Undergoing Cardiopulmonary Bypass: Changes in Metabolic Pathways and Association With Mortality and Cardiac Intensive Care Unit Length of Stay

Jesse A Davidson et al. J Am Heart Assoc. .

Abstract

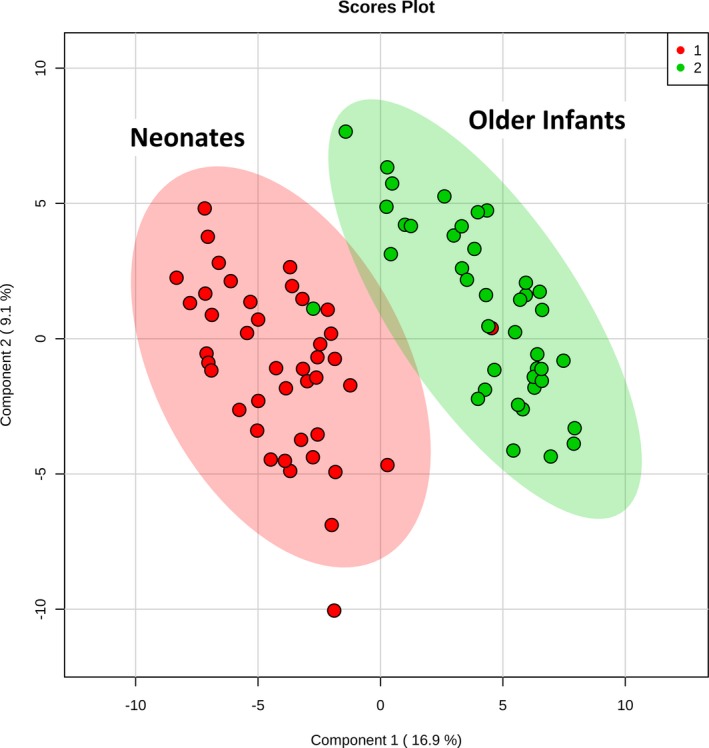
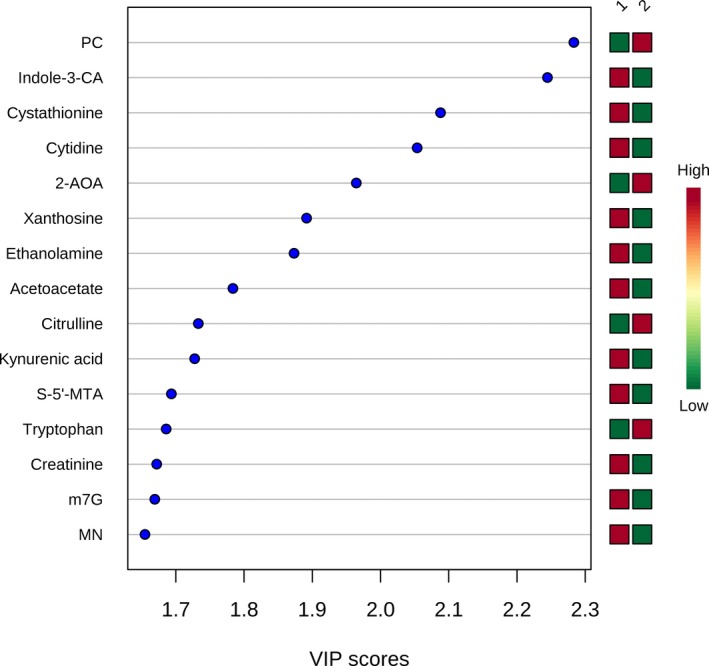
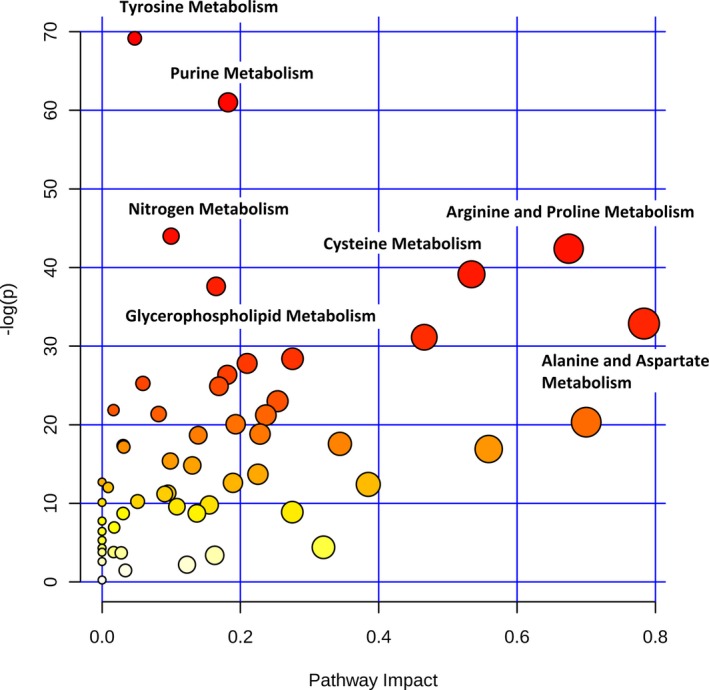
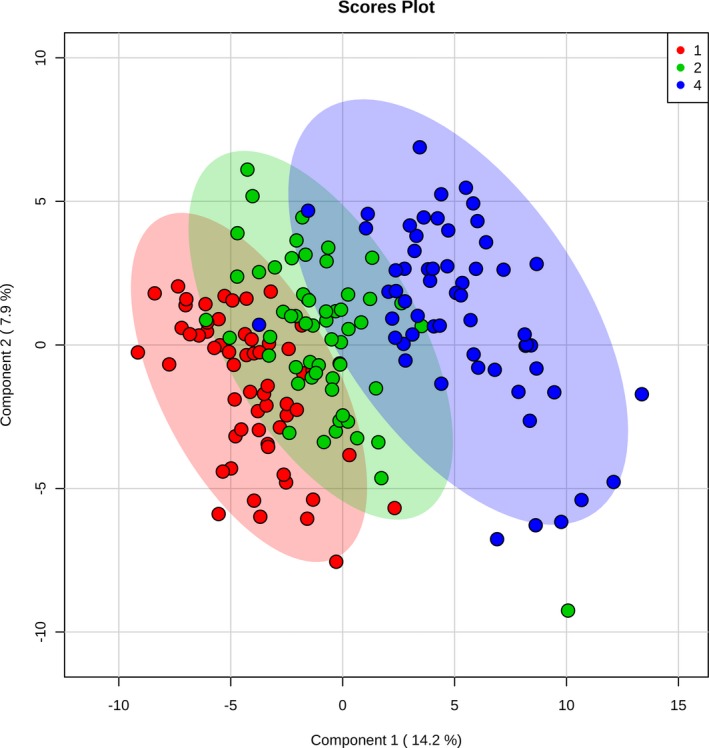
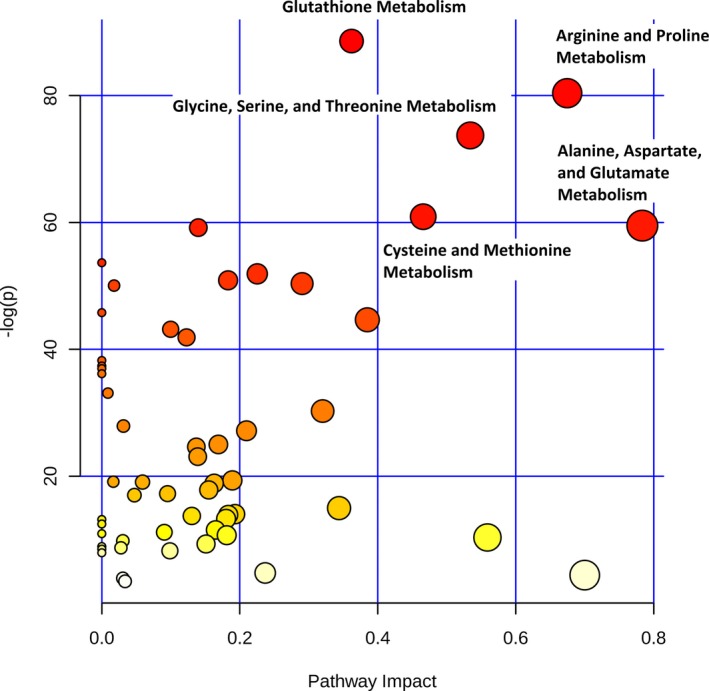
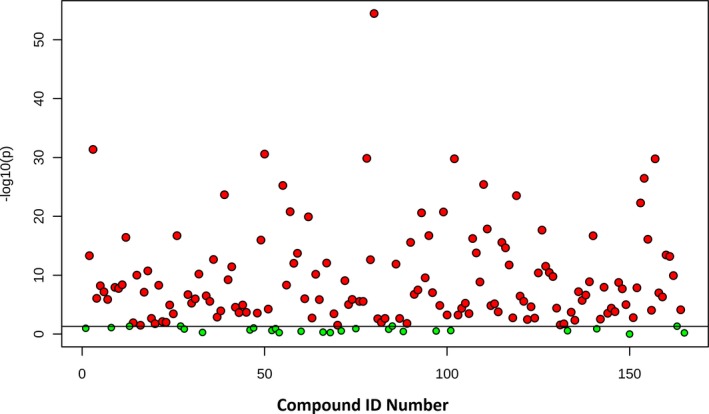
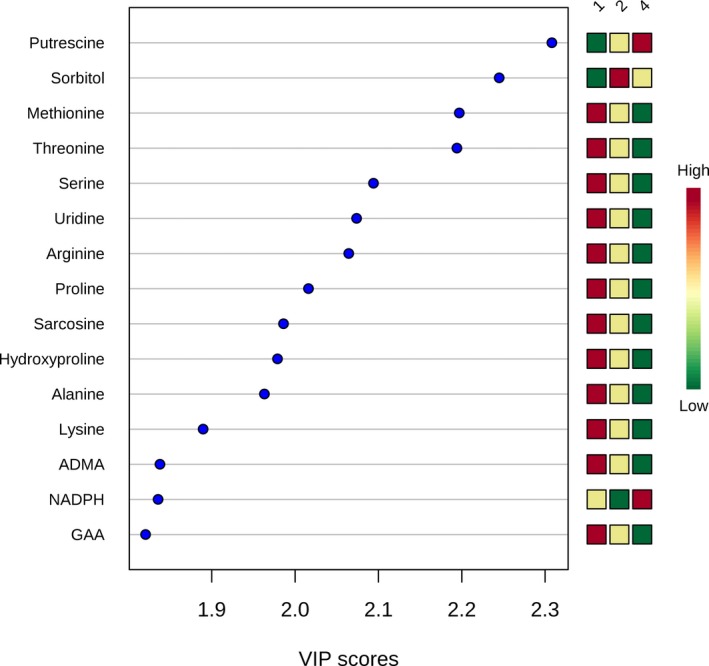
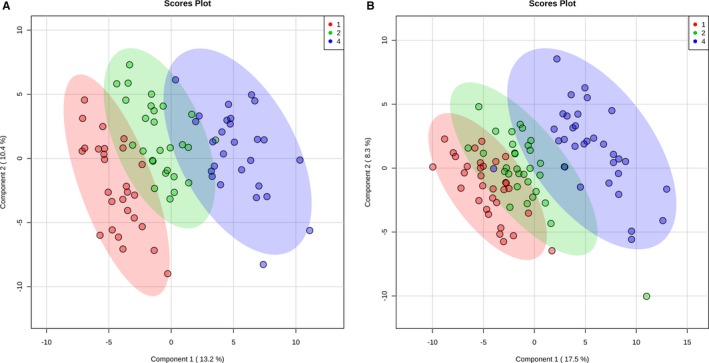
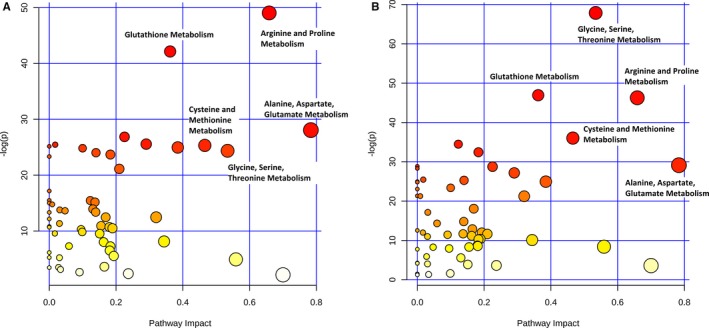
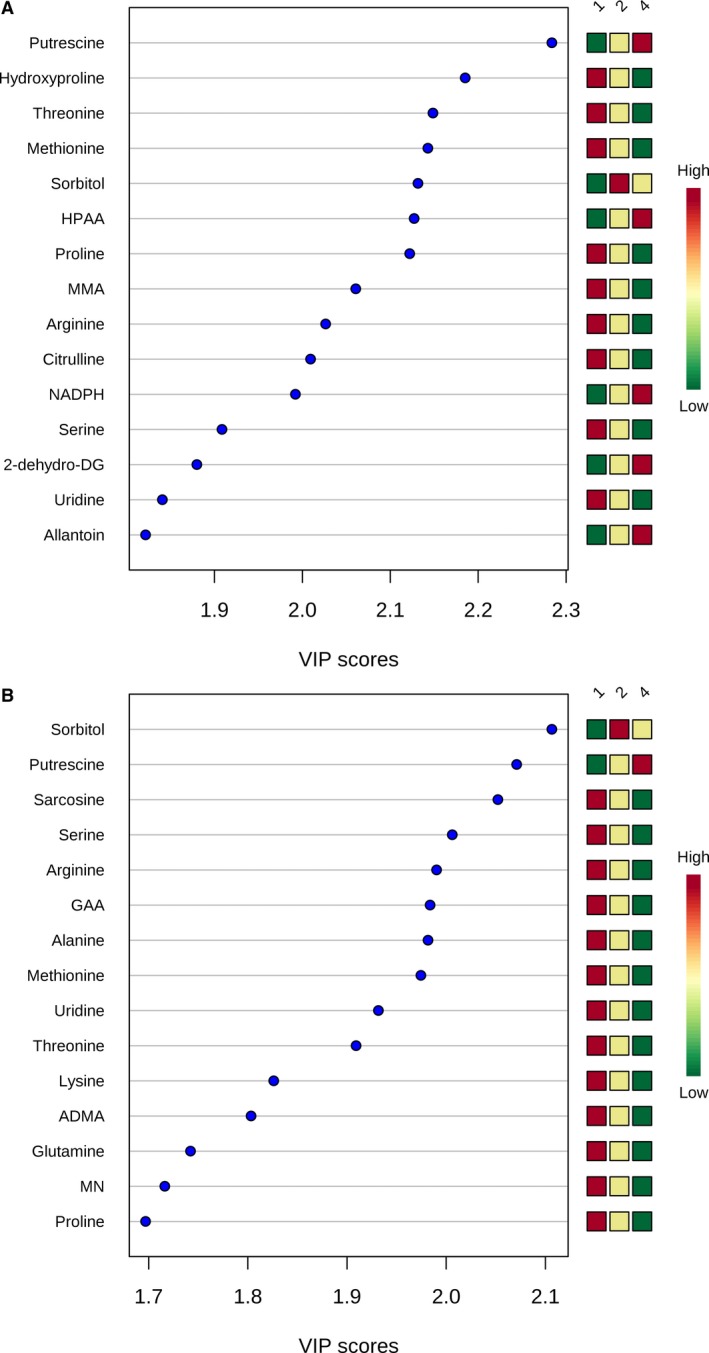
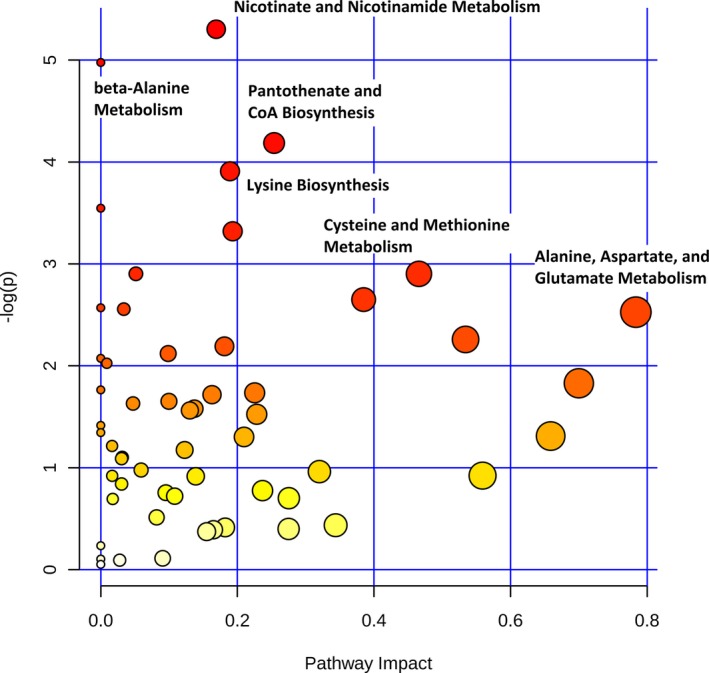
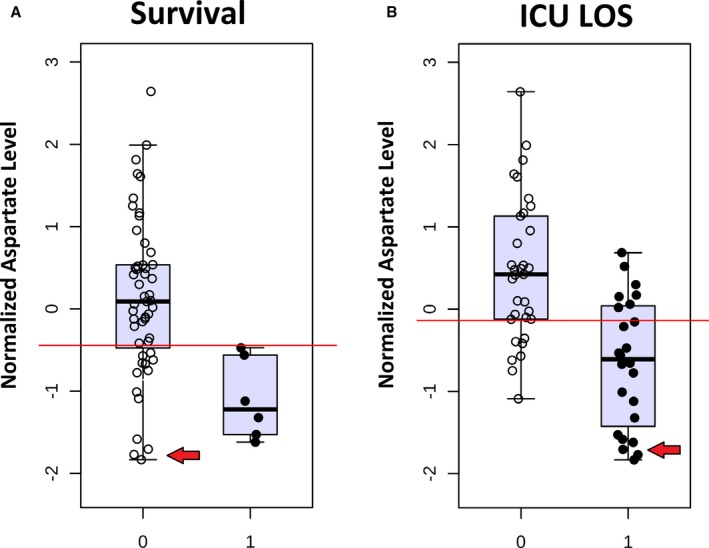
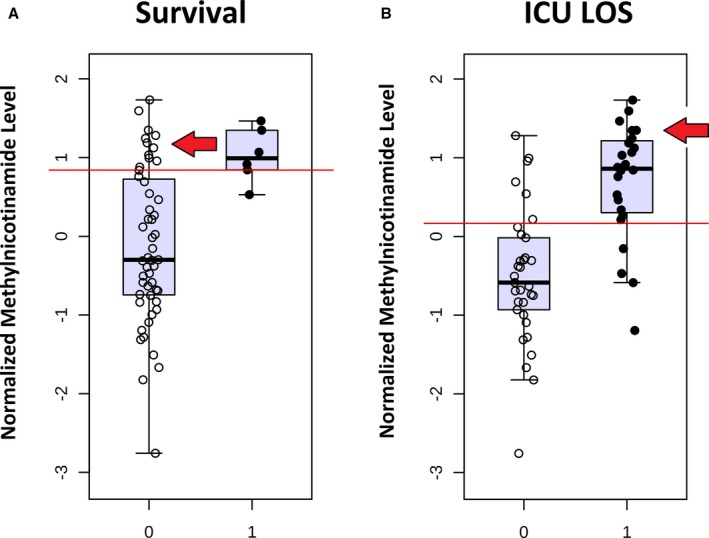
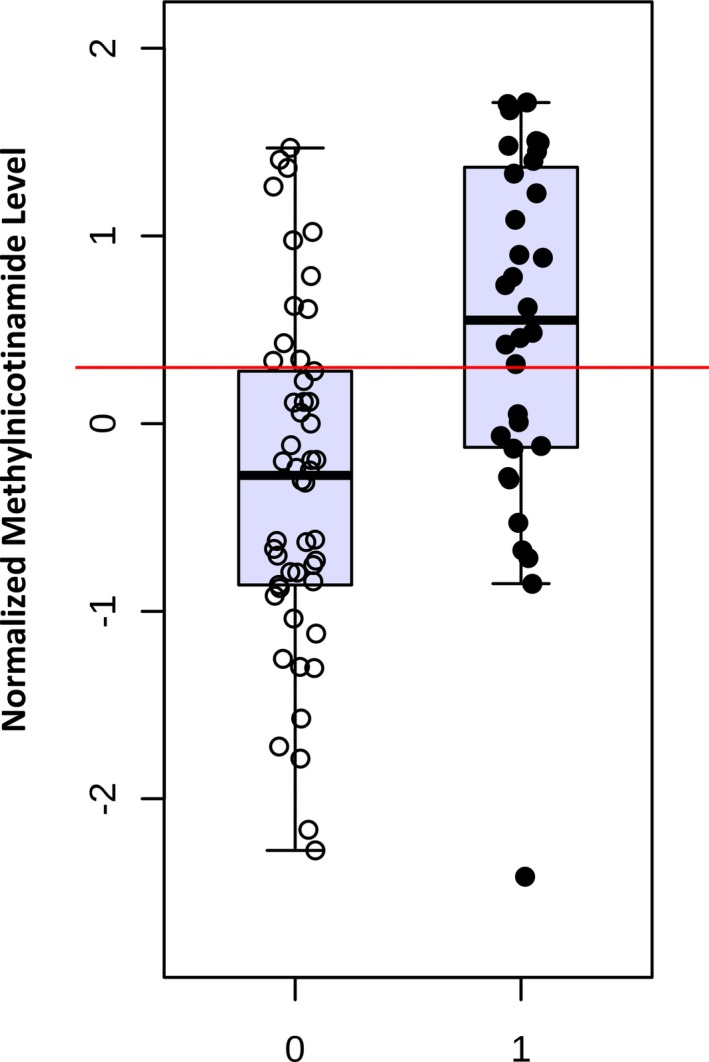
Background Mortality for infants undergoing complex cardiac surgery is >10% with a 30% to 40% risk of complications. Early identification and treatment of high-risk infants remains challenging. Metabolites are small molecules that determine the minute-to-minute cellular phenotype, making them ideal biomarkers for postsurgical monitoring and potential targets for intervention. Methods and Results We measured 165 serum metabolites by tandem mass spectroscopy in infants ≤120 days old undergoing cardiopulmonary bypass. Samples were collected prebypass, during rewarming, and 24 hours after surgery. Partial least squares-discriminant analysis, pathway analysis, and receiver operator characteristic curve analysis were used to evaluate changes in the metabolome, assess altered metabolic pathways, and discriminate between survivors/nonsurvivors as well as upper/lower 50% intensive care unit length of stay. Eighty-two infants had preoperative samples for analysis; 57 also had rewarming and 24-hour samples. Preoperation, the metabolic fingerprint of neonates differed from older infants ( R2=0.89, Q2=0.77; P<0.001). Cardiopulmonary bypass resulted in progressive, age-independent metabolic disturbance ( R2=0.92, Q2=0.83; P<0.001). Multiple pathways demonstrated changes, with arginine/proline ( P=1.2×10⁻³⁵), glutathione ( P=3.3×10-39), and alanine/aspartate/glutamate ( P=1.4×10⁻²⁶) metabolism most affected. Six subjects died. Nonsurvivors demonstrated altered aspartate ( P=0.007) and nicotinate/nicotinamide metabolism ( P=0.005). The combination of 24-hour aspartate and methylnicotinamide identified nonsurvivors versus survivors (area under the curve, 0.86; P<0.01), as well as upper/lower 50% intensive care unit length of stay (area under the curve, 0.89; P<0.01). Conclusions The preoperative metabolic fingerprint of neonates differed from older infants. Large metabolic shifts occurred after cardiopulmonary bypass, independent of age. Nonsurvivors and subjects requiring longer intensive care unit length of stay showed distinct changes in metabolism. Specific metabolites, including aspartate and methylnicotinamide, may differentiate sicker patients from those experiencing a more benign course.

Keywords: congenital heart disease; critical care; kynurenic acid; metabolite; metabolome; methylnicotinamide; neonate.


Figures

Figure 1
Figure 1
Two‐dimensional partial least squares–discriminant analysis comparing preoperative metabolic fingerprints of neonates (red) vs older infants (green).
Figure 2
Figure 2
Variable importance in projection (VIP) scores for the top 15 metabolites contributing to variation in metabolic fingerprints of neonates (group 1) vs older infants (group 2). 2‐AOA indicates 2‐aminooctanoic acid; Indole‐3‐CA, indole‐3‐carboxylic acid; m7G, 7‐methylguanosine; S‐5′‐MTA, S‐methyl‐5′‐thioadenosine.
Figure 3
Figure 3
Differences in metabolic pathways between neonates and older infants (preoperative). The x axis and size of circles represent importance of differential metabolites within the pathway. The y axis and color of circles represent statistical significance of the overall metabolic changes within the pathway.
Figure 4
Figure 4
Two‐dimensional partial least squares–discriminant analysis comparing metabolic fingerprints of the complete cohort at baseline (red), rewarming from cardiopulmonary bypass (green), and 24 hours (blue).
Figure 5
Figure 5
Difference in metabolic pathways among preoperative, rewarming, and 24‐hour time points across the full cohort. The x axis and size of circles represent impact of differential metabolites within the pathway. The y axis and color of circles represent statistical significance of the overall metabolic changes within the pathway.
Figure 6
Figure 6
Differences in individual metabolites among preoperative, rewarming, and 24‐hour samples by 1‐way ANOVA. Red=statistically significant at an adjusted P=0.05.
Figure 7
Figure 7
Variable importance in projection (VIP) scores for the top 15 metabolites contributing to variation in postoperative changes in metabolic fingerprint (whole cohort). ADMA indicates asymmetric dimethylarginine; GAA, guanidoacetic acid; NADPH, nicotinamide adenine dinucleotide phosphate.
Figure 8
Figure 8
Two‐dimensional partial least squares–discriminant analysis comparing metabolic fingerprints of older infants (A) and neonates (B) at baseline (red), rewarming from cardiopulmonary bypass (green), and 24 hours (blue).
Figure 9
Figure 9
Difference in metabolic pathways among preoperative, rewarming, and 24‐hour time points in older infants (A) and neonates (B).
Figure 10
Figure 10
Variable importance in projection (VIP) scores for the top 15 metabolites contributing to variation in postoperative changes in metabolic fingerprint in older infants (A) and neonates (B). 2‐dehydro‐DG indicates 2‐dehydro‐d‐gluconate; ADMA, asymmetric dimethylarginine; GAA, guanidoacetic acid; HPAA, hydroxyphenylacetic acid; MMA, methylmalonic acid; NADPH, nicotinamide adenine dinucleotide phosphate.
Figure 11
Figure 11
Difference in metabolic pathways between survivors and nonsurvivors.
Figure 12
Figure 12
Normalized aspartate levels at 24 hours in survivors (0) vs nonsurvivors (1) (A) and lower (0) vs upper (1) 50% of intensive care unit length of stay (ICU LOS) (B). Red arrows indicate subjects with low aspartate levels who survived but with extended ICU LOS.
Figure 13
Figure 13
Normalized methylnicotinamide levels at 24 hours in survivors (0) vs nonsurvivors (1) (A) and lower (0) vs upper (1) 50% of intensive care unit length of stay (ICU LOS) (B). Red arrows indicate subjects with high methylnicotinamide levels who survived but with extended ICU LOS.
Figure 14
Figure 14
Normalized preoperative methylnicotinamide levels in subjects with lower (0) vs upper (1) 50% intensive care unit length of stay.

References

    1. Bujak R, Struck‐Lewicka W, Markuszewski MJ, Kaliszan R. Metabolomics for laboratory diagnostics. J Pharm Biomed Anal. 2015;113:108–120. - PubMed
    1. McGarrah RW, Crown SB, Zhang GF, Shah SH, Newgard CB. Cardiovascular metabolomics. Circ Res. 2018;122:1238–1258. - PMC - PubMed
    1. Correia GD, Wooi Ng K, Wijeyesekera A, Gala‐Peralta S, Williams R, MacCarthy‐Morrogh S, Jimenez B, Inwald D, Macrae D, Frost G, Holmes E, Pathan N. Metabolic profiling of children undergoing surgery for congenital heart disease. Crit Care Med. 2015;43:1467–1476. - PMC - PubMed
    1. Slaughter AL, Nunns GR, D'Alessandro A, Banerjee A, Hansen KC, Moore EE, Silliman CC, Nemkov T, Moore HB, Fragoso M, Leasia K, Peltz ED. The metabolopathy of tissue injury, hemorrhagic shock, and resuscitation in a rat model. Shock. 2018;49:580–590. - PMC - PubMed
    1. Tomic V, Russwurm S, Moller E, Claus RA, Blaess M, Brunkhorst F, Bruegel M, Bode K, Bloos F, Wippermann J, Wahlers T, Deigner HP, Thiery J, Reinhart K, Bauer M. Transcriptomic and proteomic patterns of systemic inflammation in on‐pump and off‐pump coronary artery bypass grafting. Circulation. 2005;112:2912–2920. - PubMed

Publication types

MeSH terms