. 2019 Jan;25(1):82-91.
doi: 10.3201/eid2501.180835.

Zoonotic Source Attribution of Salmonella enterica Serotype Typhimurium Using Genomic Surveillance Data, United States

Zoonotic Source Attribution of Salmonella enterica Serotype Typhimurium Using Genomic Surveillance Data, United States

Shaokang Zhang et al. Emerg Infect Dis. 2019 Jan.

Abstract

Increasingly, routine surveillance and monitoring of foodborne pathogens using whole-genome sequencing is creating opportunities to study foodborne illness epidemiology beyond routine outbreak investigations and case-control studies. Using a global phylogeny of Salmonella enterica serotype Typhimurium, we found that major livestock sources of the pathogen in the United States can be predicted through whole-genome sequencing data. Relatively steady rates of sequence divergence in livestock lineages enabled the inference of their recent origins. Elevated accumulation of lineage-specific pseudogenes after divergence from generalist populations and possible metabolic acclimation in a representative swine isolate indicates possible emergence of host adaptation. We developed and retrospectively applied a machine learning Random Forest classifier for genomic source prediction of Salmonella Typhimurium that correctly attributed 7 of 8 major zoonotic outbreaks in the United States during 1998-2013. We further identified 50 key genetic features that were sufficient for robust livestock source prediction.

Keywords: Salmonella; Salmonella enterica serotype Typhimurium; United States; bacteria; machine learning; population structure; source attribution; whole-genome sequencing; zoonoses.


Figures

Figure 1
Figure 1
Phylogenetic structure of 1,267 Salmonella enterica serotype Typhimurium isolates. A) Maximum-likelihood phylogeny from 46 US states and 39 other countries. The tree was rooted at midpoint. Ten major population groups (G1–G10) were delineated. Each dashed line shows the division of subgroups in G2, G3, G4, and G5 (e.g., G2a and G2b). Each isolate is color coded by source. Arrowheads indicate isolates selected for metabolic profiling using Phenotype Microarrays (Biolog, https://biolog.com). Scale bar indicates number of single-nucleotide polymorphisms. B) Circular cladogram of the same maximum-likelihood phylogeny of the 1,267 isolates. Colored circles indicate internal nodes that had a squared coefficient (R2) of the Spearman or Pearson correlation between isolation years and branch lengths >0.4. The sizes of the circle are proportional to the values of R2 (0.0–0.9). Clades identified to exhibit temporal signals of single-nucleotide polymorphisms accumulation are shaded in gray. The inferred MRCA age of each clade is shown. HPD, highest posterior density; MRCA, most recent common ancestor.
Figure 2
Figure 2
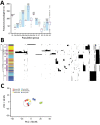
Pseudogene accumulation and metabolic acclimation of Salmonella enterica serotype Typhimurium. A) Abundance of putative pseudogenes in each individual population group or subgroup. Colors indicate each pair of recently diverged clades: light blue indicates source-associated clade; light green indicates diverse-source clade. B) Distribution of putative pseudogenes among Salmonella Typhimurium genomes by source. Cyan, bovine; yellow, poultry; light green, wild bird; blue, swine; dark green, miscellaneous food; red, human; gray, other sources. Purple bars delineate different population groups; black lines within these bars indicate subgroup divisions: G2a and G2b, G3a and G3b, G4a and G4b, and G5a and G5b. The presence of a pseudogene in an isolate is shown as a black spot in the corresponding location. Horizontally, these pseudogenes are hierarchically clustered on the basis of their distribution among analyzed isolates. C) Principal component analysis of metabolic profiles of selected isolates. Results from 2 replicate Phenotype Microarray (Biolog, https://biolog.com) analyses are shown for each isolate. PC, principal component.
Figure 3
Figure 3
Source prediction by Random Forest classifier. A) Predicted source probabilities for zoonotic Salmonella enterica serotype Typhimurium isolates. Each vertical line in a panel is color coded by predicted source probabilities to proportion: cyan, bovine; yellow, poultry; blue, swine; light green, wild bird. B) Comparison of SDIs of predicted probabilities between BPSW and non-BPSW isolates. For each isolate, SDI was calculated among predicted probabilities of the 4 sources. Red horizontal lines indicate median SDI values; blue box tops and bottoms indicate interquartile ranges; whiskers indicate maximum and minimum SDI values. C) Receiver operating characteristics (ROC) curve of differentiating BPSW and non-BPSW isolates using SDI of predicted source probabilities. The AUC was 0.8, suggesting good binary classification. Red line indicates ROC curve; dotted line indicates diagonal line across the ROC space. D) Summary of source prediction results of 1,473 Salmonella Typhimurium isolates. Rectangles with solid and dashed lines represent precise (SDI <0.45) and imprecise (SDI >0.45) predictions, respectively. Dark gray rectangles, BPSW isolates; light gray rectangles, non-BPSW isolates. The number in each enclosed area is the number of isolates in the category. The sizes of enclosed and gray areas are in proportion to the numbers of isolates they represent. The 70 precisely but incorrectly predicted BPSW isolates are shown with outline. The 51 precisely predicted human isolates were attributed to zoonotic sources: cyan, bovine; yellow, poultry; blue, swine; light green, wild bird. The sizes of source colored rectangles are proportional to the numbers of isolates in the predicted source classes. AUC, area under the ROC curve; BPSW, bovine, poultry, swine, or wild bird; SDI, Simpson diversity index.
Figure 4
Figure 4
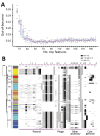
Key genetic features for zoonotic source prediction of Salmonella enterica serotype Typhimurium using Random Forest classifier. A) Change of out-of-bag prediction error rate as incremental inclusion of top ranking genetic features for source prediction. Red lines indicate median values; blue boxes indicate interquartile ranges. Upper and lower whiskers indicate maximum and minimum values. Circles indicate outliers. B) Distribution of top 50 source predicting features among Salmonella Typhimurium isolates on the basis of their location. Cyan, bovine; yellow, poultry; light green, wild bird; blue, swine; dark green, miscellaneous food; red, human; gray, other sources. The presence of a feature in an isolate is shown as a horizontal line in the corresponding location, with its grayscale representing the level of the MD of prediction accuracy through randomly permuting values of the feature. The higher the MD, the more important the feature is for source prediction. MD, mean decrease.

References

    1. Scallan E, Hoekstra RM, Angulo FJ, Tauxe RV, Widdowson MA, Roy SL, et al. Foodborne illness acquired in the United States—major pathogens. Emerg Infect Dis. 2011;17:7–15. 10.3201/eid1701.P11101 - DOI - PMC - PubMed
    1. Hoffmann S, Maculloch B, Batz M. Economic burden of major foodborne illnesses acquired in the United States [cited 2018 Oct 8]. https://www.ers.usda.gov/webdocs/publications/43984/52807_eib140.pdf
    1. Hendriksen RS, Vieira AR, Karlsmose S, Lo Fo Wong DM, Jensen AB, Wegener HC, et al. Global monitoring of Salmonella serovar distribution from the World Health Organization Global Foodborne Infections Network Country Data Bank: results of quality assured laboratories from 2001 to 2007. Foodborne Pathog Dis. 2011;8:887–900. 10.1089/fpd.2010.0787 - DOI - PubMed
    1. Rabsch W, Andrews HL, Kingsley RA, Prager R, Tschäpe H, Adams LG, et al. Salmonella enterica serotype Typhimurium and its host-adapted variants. Infect Immun. 2002;70:2249–55. 10.1128/IAI.70.5.2249-2255.2002 - DOI - PMC - PubMed
    1. Helms M, Ethelberg S, Mølbak K; DT104 Study Group. International Salmonella Typhimurium DT104 infections, 1992-2001. Emerg Infect Dis. 2005;11:859–67. 10.3201/eid1106.041017 - DOI - PMC - PubMed