. 2019 Apr 15;28(8):1286-1297.
doi: 10.1093/hmg/ddy431.

FOXF2 is required for cochlear development in humans and mice

Affiliations

FOXF2 is required for cochlear development in humans and mice

Guney Bademci et al. Hum Mol Genet. .

Abstract

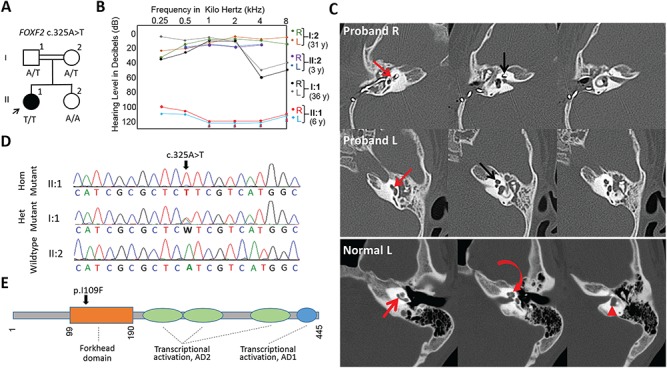
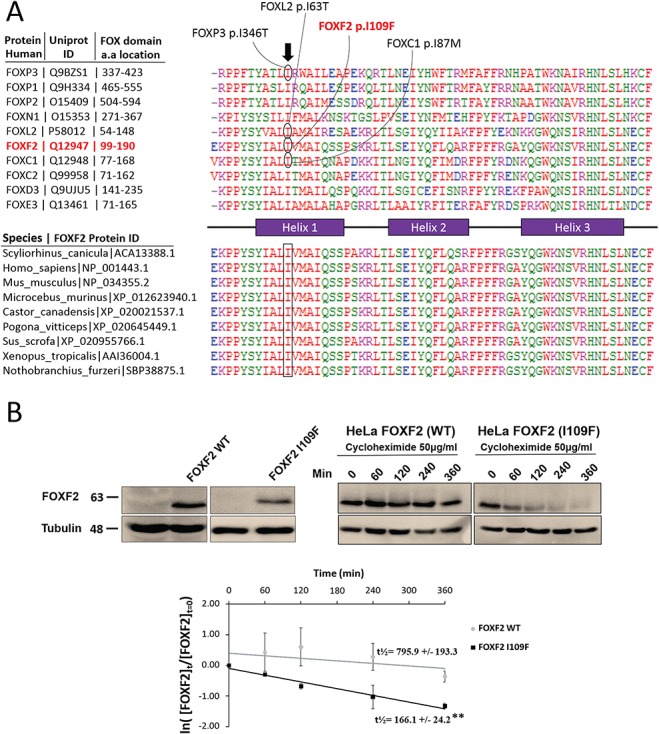
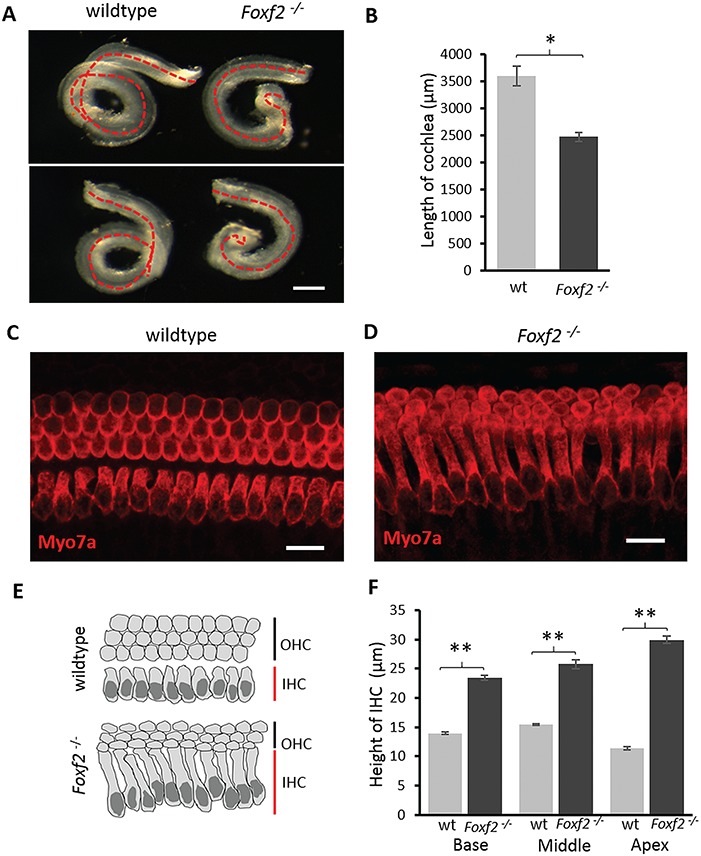
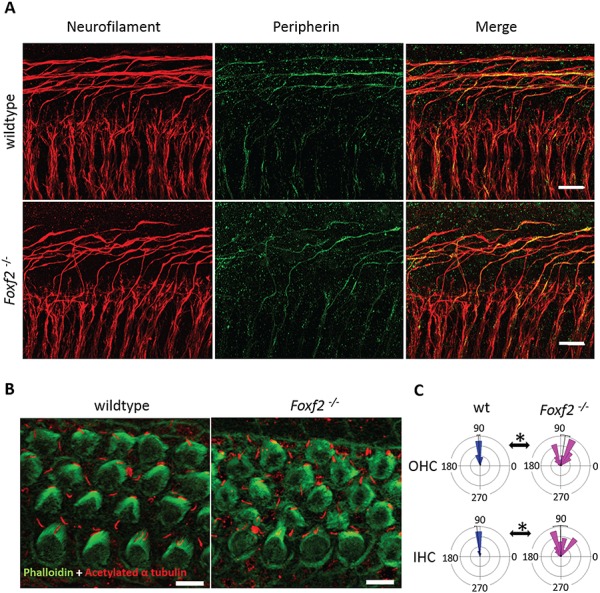
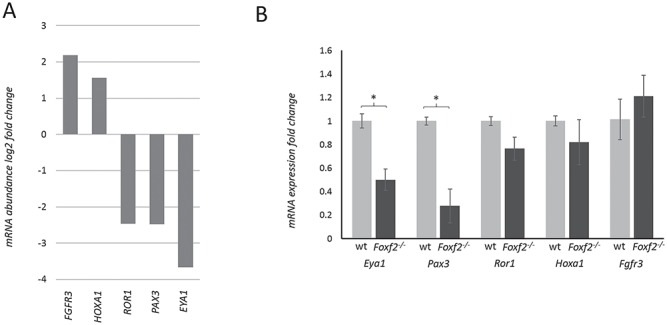
Molecular mechanisms governing the development of the human cochlea remain largely unknown. Through genome sequencing, we identified a homozygous FOXF2 variant c.325A>T (p.I109F) in a child with profound sensorineural hearing loss (SNHL) associated with incomplete partition type I anomaly of the cochlea. This variant is not found in public databases or in over 1000 ethnicity-matched control individuals. I109 is a highly conserved residue in the forkhead box (Fox) domain of FOXF2, a member of the Fox protein family of transcription factors that regulate the expression of genes involved in embryogenic development as well as adult life. Our in vitro studies show that the half-life of mutant FOXF2 is reduced compared to that of wild type. Foxf2 is expressed in the cochlea of developing and adult mice. The mouse knockout of Foxf2 shows shortened and malformed cochleae, in addition to altered shape of hair cells with innervation and planar cell polarity defects. Expressions of Eya1 and Pax3, genes essential for cochlear development, are reduced in the cochleae of Foxf2 knockout mice. We conclude that FOXF2 plays a major role in cochlear development and its dysfunction leads to SNHL and developmental anomalies of the cochlea in humans and mice.


Figures

Figure 1
Figure 1
Phenotype and genetic studies of the family. (A) Pedigree of the family and segregation of the variant. (B) Hearing thresholds of the proband and family members: R, right; L, left. (C) Computerized tomography showing incomplete partition type I anomaly bilaterally (upper row, right ear; middle row, left ear). Cochlea is dysplastic. A structure compatible with basilar turn (red arrow) is visible but cochlear apex is cystic (black arrow). There is a cochlear implant on the right side. Please note the bilateral soft tissue in the middle ear cavity (otitis media). Lower row belongs to a normal computerized tomography image of left temporal bone. Normal cochlea with basal turn (red arrow) and apex (curved arrow) along with the vestibule (arrowhead) is shown. (D) Electropherogram of the FOXF2 c.325A>T (p.I109F) variant. Hom, homozygous; Het, heterozygous. (E) Localization of the p.I109F variant in FOXF2.
Figure 2
Figure 2
Conservation of FOXF2 I109 and stability of the F109 variant. (A) Comparison of the variant residue along with flanking amino acids in paralogs (upper panel) and orthologs (lower panel). (B) FOXF2 (WT)- and FOXF2 (I109F)-transfected HeLa cells were treated with cycloheximide (50 μg/ml) and then immunoblotting experiments were performed to measure FOXF2 protein levels after cycloheximide treatment for the indicated time points. Band intensities were normalized to α-tubulin then scaled to the 0 min cycloheximide time point. Error bars represent standard deviation (SD). The decay of FOXF2 followed first-order kinetics. The slope of the decay line was calculated by standard linear regression, and the protein half-life was determined accordingly. FOXF2 (WT), t1/2 = 795.9 min; FOXF2 (I109F), t1/2 = 166.1 min. **P < 0.01 (n = 3; two-tailed t-test).
Figure 3
Figure 3
Cochlear length and hair cell morphology of Foxf2−/− mice. (A) Representative images from dissected cochleae at E18.5 for WT (left) and Foxf2−/− mice (right), showing an altered morphology and length in the mutant one. Scale bar: 300 μm. (B) Total length measurements of WT and Foxf2−/− E18.5 cochleae. Values are represented as average ± Standard Error of the Mean (SEM). *P < 0.05 (n = 3 each genotype; two-tailed t-test). (C and D) Representative single plane confocal images showing the morphology of auditory hair cells from WT and Foxf2−/− whole-mount cochleae at E18.5. An anti-Myo7a (red) was used to stain auditory hair cell morphology. Scale bars c,d: 15 μm. (E) Schematic representation of hair cells morphology, depicting IHCs and OHCs, of WT and Foxf2−/− mice. (F) Height measurements of 100 IHCs in different parts of the cochlea are compared to WT (grey columns) and Foxf2 −/− (black columns). Values are represented as the average ± SEM. **P < 0.01 (n = 4 each genotype; two-tailed t-test).
Figure 4
Figure 4
Innervation and planar cell polarity of hair cells in the cochleae of WT and Foxf2−/− mice at E18.5. (A) Representative images of the total innervation pattern (z-stack images) of E18.5 cochleae by immunostaining with anti-neurofilament (red) and type II SGN fibers stained with anti-peripherin (green) antibodies are shown for WT and Foxf2−/− mice. Scale bar:15 μm. (B) Representative single plane confocal images of apical stereocilia in cochlear whole mounts derived from WT and Fofx2−/− E18.5 mice. Anti-acetylated α-tubulin antibody was used to label the kinocilium (red), and Alexa Fluor 488 phalloidin (green) was used for F-actin staining of the stereocilia. Scale bar: 5 μm. (C) Representative results of individual stereociliary bundle orientations for IHCs and OHCs located in middle portion of the cochlea are presented as circular histograms for WT (blue) and Foxf2−/− (magenta) E18.5 embryos. Histograms represent stereociliary bundle orientation angles with 90 degrees indicating the normal angle formed between the longitudinal axis and mediolateral axis. Bundle orientation plots were generated using Oriana 4 circular graphing software. Deviations (>5 degrees) from the mediolateral axis were more frequent in stereociliary bundles from IHCs and OHCs of Foxf2−/− mice when compared to WT animals. The number of hair cells represented by each histogram is at least 50. Black bars and associated error bars show the mean ± SD of stereociliary bundle orientation. *P < 0.05 (cochleae derived from n = 4 WT and n = 6 knockouts, χ2 test).
Figure 5
Figure 5
Transcriptome analysis of mutant human fibroblasts and mouse knockout gene expression studies. (A) Relative mRNA levels of five genes known to cause cochlear malformations in humans are shown from transcriptome sequencing of the fibroblasts from the proband (FOXF2 p.I109F) compared to a WT control. (B) Transcription levels of deregulated five genes shown in Fig. 5A were evaluated using quantitative polymerase chain reaction (qPCR) assays in the cochleae of E18.5 Foxf2−/− mice compared to those of WT animals. Eya1 and Pax3 gene expression values in Foxf2−/− mice were reduced [*P < 0.05 (n = 6, two-tailed t-test)], while there was no difference for Fgfr3, Hoxa1 and Ror1.

Similar articles

Cited by

References

    1. Morton C.C. and Nance W.E. (2006) Newborn hearing screening—a silent revolution. N. Engl. J. Med., 354, 2151–2164. - PubMed
    1. Jackler R.K., Luxford W.M. and House W.F. (1987) Congenital malformations of the inner ear: a classification based on embryogenesis. Laryngoscope, 97, 2–14. - PubMed
    1. Adibelli Z.H., Isayeva L., Koc A.M., Catli T., Adibelli H. and Olgun L. (2017) The new classification system for inner ear malformations: the INCAV system. Acta Otolaryngol., 137, 246–252. - PubMed
    1. Sennaroglu L. and Saatci I. (2002) A new classification for cochleovestibular malformations. Laryngoscope, 112, 2230–2241. - PubMed
    1. Wu D.K. and Kelley M.W. (2012) Molecular mechanisms of inner ear development. Cold Spring Harb. Perspect. Biol., 4, a008409. - PMC - PubMed

Publication types

MeSH terms