. 2019 Mar 1;316(3):E464-E474.
doi: 10.1152/ajpendo.00302.2018. Epub 2018 Dec 18.

Arsenic modifies serotonin metabolism through glucuronidation in pancreatic β-cells

Affiliations

Arsenic modifies serotonin metabolism through glucuronidation in pancreatic β-cells

Christopher M Carmean et al. Am J Physiol Endocrinol Metab. .

Abstract

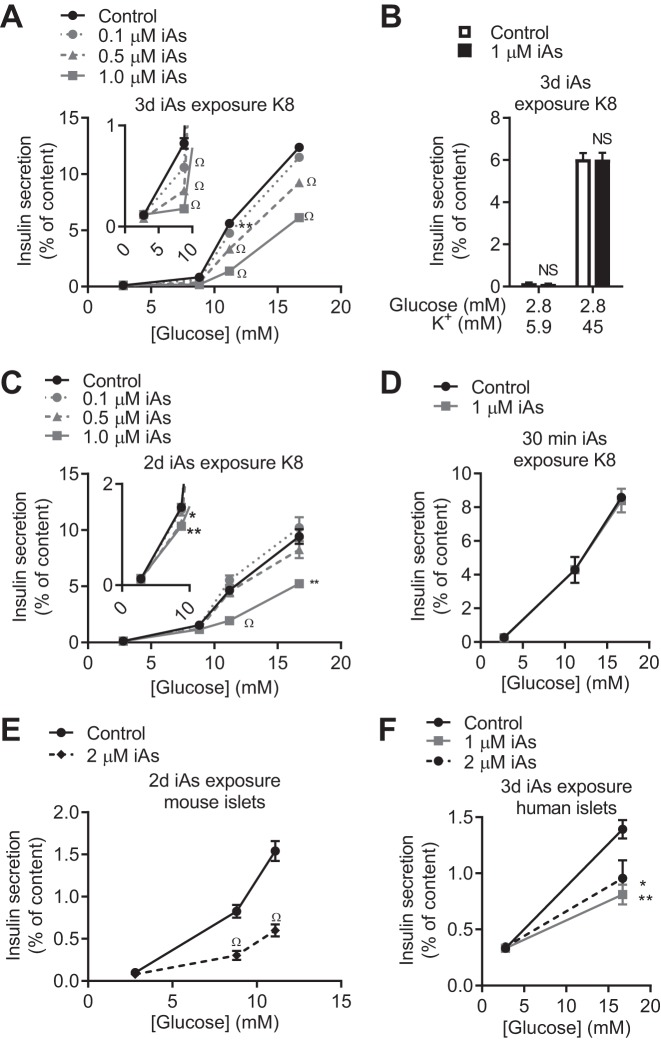
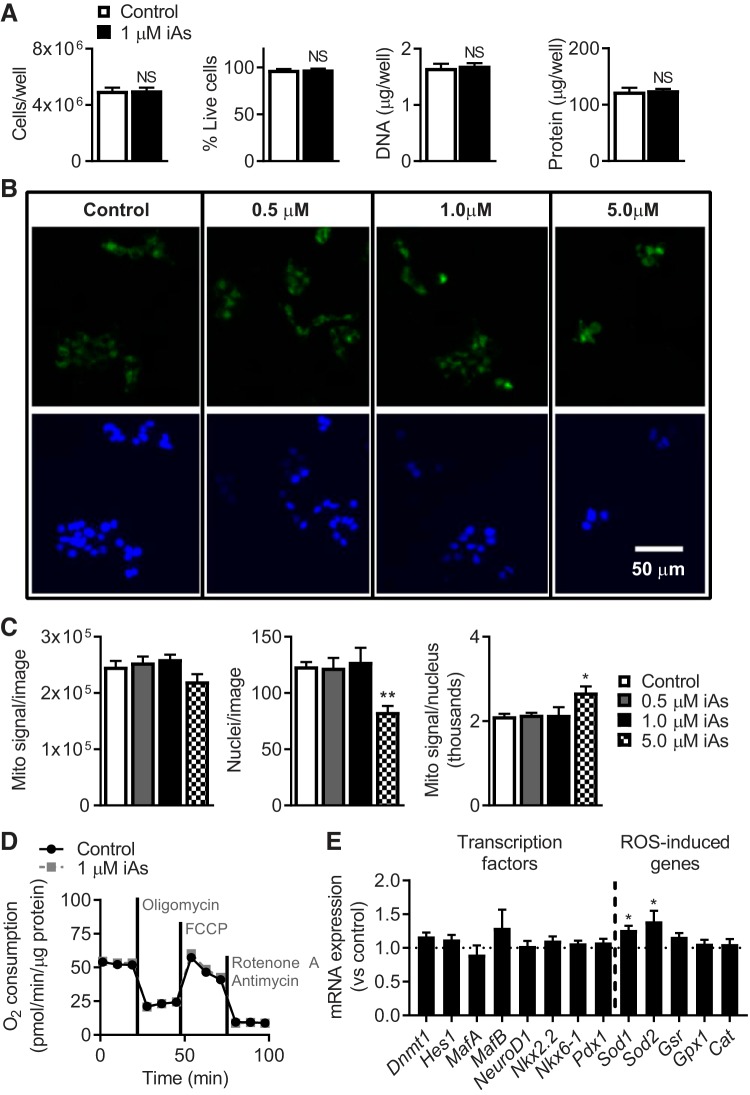
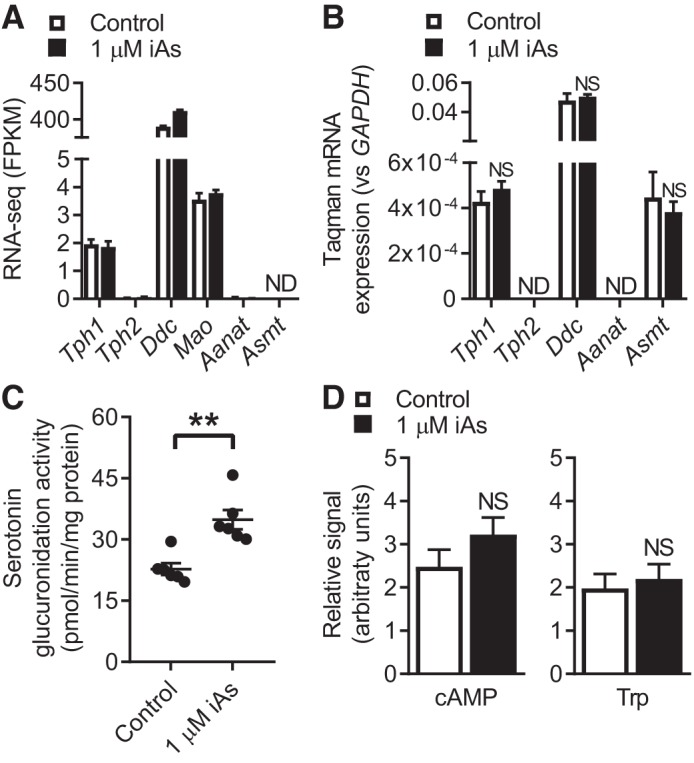
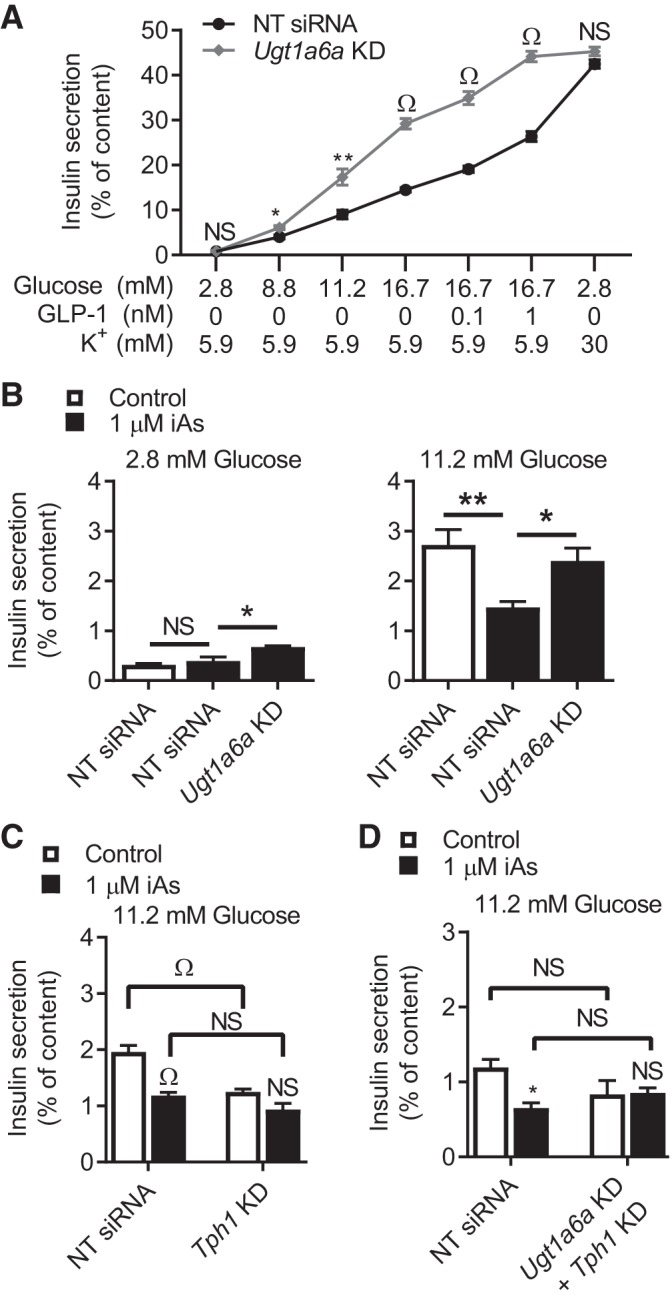
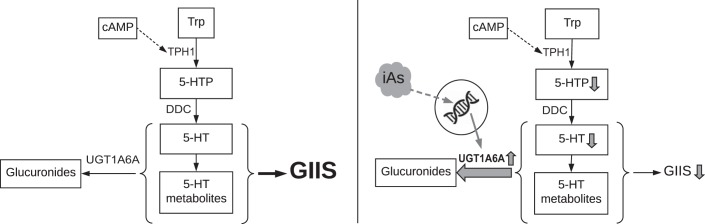
In arsenic-endemic regions of the world, arsenic exposure correlates with diabetes mellitus. Multiple animal models of inorganic arsenic (iAs, as As3+) exposure have revealed that iAs-induced glucose intolerance manifests as a result of pancreatic β-cell dysfunction. To define the mechanisms responsible for this β-cell defect, the MIN6-K8 mouse β-cell line was exposed to environmentally relevant doses of iAs. Exposure to 0.1-1 µM iAs for 3 days significantly decreased glucose-induced insulin secretion (GIIS). Serotonin and its precursor, 5-hydroxytryptophan (5-HTP), were both decreased. Supplementation with 5-HTP, which loads the system with bioavailable 5-HTP and serotonin, rescued GIIS, suggesting that recovery of this pathway was sufficient to restore function. Exposure to iAs was accompanied by an increase in mRNA expression of UDP-glucuronosyltransferase 1 family, polypeptide a6a (Ugt1a6a), a phase-II detoxification enzyme that facilitates the disposal of cyclic amines, including serotonin, via glucuronidation. Elevated Ugt1a6a and UGT1A6 expression levels were observed in mouse and human islets, respectively, following 3 days of iAs exposure. Consistent with this finding, the enzymatic rate of serotonin glucuronidation was increased in iAs-exposed cells. Knockdown by siRNA of Ugt1a6a during iAs exposure restored GIIS in MIN6-K8 cells. This effect was prevented by blockade of serotonin biosynthesis, suggesting that the observed iAs-induced increase in Ugt1a6a affects GIIS by targeting serotonin or serotonin-related metabolites. Although it is not yet clear exactly which element(s) of the serotonin pathway is/are most responsible for iAs-induced GIIS dysfunction, this study provides evidence that UGT1A6A, acting on the serotonin pathway, regulates GIIS under both normal and pathological conditions.

Keywords: arsenic; diabetes; glucuronidation; insulin secretion; serotonin.


Conflict of interest statement

R. M. Sargis has received honoraria from CVS/Health. S. Seino has consulted for JCR Pharmaceuticals and held scientific advisory positions with Kansai Electric Power Medical Research Institute and Servier Laboratories. S. Seino has served on speaker’s bureaus for Novo Nordisk Pharma K.K. and Sumitomo Dainippon Pharma, Co., Ltd., and Novartis Pharma K.K. None of the other authors has any conflicts of interest, financial or otherwise, to disclose.

Figures

Fig. 1.
Fig. 1.
Effects of inorganic arsenite (iAs) on insulin secretion. A and B: glucose-induced insulin secretion (GIIS) (n = 5–6) (A) and potassium-induced insulin secretion (n = 3–4) (B) in MIN6-K8 cells following 3 days of iAs exposure. C: GIIS following 2 days of iAs exposure (n = 5–6). D: GIIS following 30 min of iAs exposure (iAs included in stimulation buffer only) (n = 3–4). E and F: 2 days of iAs exposure in mouse islets (E) and 3 days of iAs exposure in human islets (F). AC, E and F: 3 independent experiments were performed. D: 2 independent experiments were performed. Statistics: A, C, and F: for each glucose concentration, one-way ANOVA was performed comparing iAs exposure groups to the control group. B, D, and E: Student’s t-tests were performed for each stimulation concentration. *P < 0.05, **P < 0.01, ΩP < 0.0001.
Fig. 2.
Fig. 2.
Markers of cell and mitochondrial health. A, left to right: cells per well (n = 12) and percentage of cells alive as determined by trypan blue staining (n = 12), total DNA (n = 4), and total protein (n = 5) per well. B: fluorescence microscopy showing total mitochondrial staining with MitoTracker Green (top) and Hoechst 33342 staining of nuclei (bottom) following 3 days of inorganic arsenite (iAs) exposure (3 images/well and 3 wells/condition were examined). C: total mitochondrial signal detected in each image, number of nuclei counted per image, and mitochondrial mass calculated as the ratio of mitochondrial signal to the number of nuclei. D: O2 consumption during mitochondrial stress test as measured by the SeaHorse Analyzer, normalized to total protein per well (n = 5). E: Taqman qPCR of β-cell identity-regulating transcription factors and antioxidant genes (n = 6–12). NS, not significant. AD: 3 independent experiments were performed. E: 2 independent experiments were performed. Statistics: A and D: Student’s t-tests. C and E: one-way ANOVA between each iAs exposure and the control. *P < 0.05, **P < 0.01.
Fig. 3.
Fig. 3.
Metabolomics and 5-hydroxytryptophan (5-HTP) intervention following 3 days of inorganic arsenite (iAs) exposure. A: 5-HTP measured by unbiased metabolomics analysis as described in materials and methods (n = 11). B: serotonin in lysates measured by ELISA (n = 3–4). C: insulin secretion following supplementation with 5-HTP during 30 min of preincubation plus glucose stimulation. A and B: 2 independent experiments were performed. C: 3 independent experiments were performed. Statistics: A: analysis detailed in materials and methods. B: Student’s t-test. C: one-way ANOVA between each condition and each of the two 0-µM 5-HTP conditions. *P < 0.05, ***P < 0.001, ΩP < 0.0001.
Fig. 4.
Fig. 4.
RNA sequencing (RNA-seq) and gene candidate confirmation following inorganic arsenite (iAs) exposure. A: volcano plot of RNA-seq results. Gray boundaries marked by dotted lines represent thresholds for candidate gene identification as described in materials and methods (n = 3). B: relative gene expression derived from (top) RNA-seq fragments per kilobase of transcript per million mapped reads (FPKM) values and (bottom) independent Taqman qPCR gene expression measurements for candidate genes following 3 days of iAs exposure (n = 4). C: original FPKM values of Ugt1a6a and other Ugt1a family member genes from the same data set used in A (n = 3). D: Taqman qPCR of Ugt1a6a following 2 days (left) or iAs exposure in mouse islets and 3 days (right) of iAs exposure in human islets. NS, not significant; ND, not detected in control and/or iAs-exposure groups. AC: RNA-seq was performed on samples collected during 1 experiment. B and D: 3 independent experiments were performed for Taqman analyses. Statistics: A and B: analysis detailed in materials and methods. C: no separate statistical analyses were performed aside from the unbiased assessment of all RNA-seq data as described in materials and methods. D: one-way ANOVA was performed for mouse islet Ugt1a6a gene expression; however, human islet data were not subjected to statistical analysis. *P < 0.05, ΩP < 0.0001.
Fig. 5.
Fig. 5.
Serotonin metabolism characteristics. A and B: RNA sequencing (RNA-seq) (A) or Taqman (B) expression values for genes related to serotonin metabolism. C: the rate of serotonin glucuronidation in MIN6-K8 lysates following 3 days of inorganic arsenite (iAs) exposure, normalized to total protein. This assay is described in more detail in materials and methods. (n = 6). D: cyclic AMP (cAMP) and tryptophan (Trp) content quantified by metabolomics as described previously (n = 11). NS, not significant; ND, not detected. A: RNA-seq was performed on samples collected during 1 experiment. B: 3 independent experiments. C and D: 2 independent experiments. Statistics: A: RNA-seq data were analyzed as described in materials and methods. B and C: Student’s t-test. D: analysis detailed in materials and methods. **P < 0.01.
Fig. 6.
Fig. 6.
Glucose-induced insulin secretion (GIIS) following gene knockdown. A: effects of Ugt1a6a knockdown on insulin secretion in response to glucose, incretin, or potassium stimuli in the absence of arsenic exposure (n = 4). B: effects of Ugt1a6a knockdown on 2.8 and 11.2 mM glucose after 2 days of 1 µM inorganic arsenite (iAs) exposure (n = 4). C and D: 11.2 mM GIIS following 3 days of 1 µM iAs exposure and knockdown (KD) of the indicated gene(s). NS, not significant. A and B: 4 independent experiments were performed. C and D: 2 independent experiments were performed. Statistics: A: 1 Student’s t-test between knockdown and control results was performed for each stimulation condition. B: one-way ANOVA was performed between Scramble KD + 1 µM iAs and other conditions. *P < 0.05, **P < 0.01, ΩP < 0.0001. B and C: one-way ANOVA was performed comparing targeted knockdown to nontarget (NT siRNA) knockdown within each iAs exposure condition and between iAs exposure conditions within each knockdown group. All statistical comparisons performed are indicated.
Fig. 7.
Fig. 7.
Model of endogenous- and inorganic arsenite (iAs)-induced serotonin metabolism. Left: UGT1A6A negatively regulates glucose-induced insulin secretion (GIIS) by glucuronidation of serotonin (and potentially its metabolites). Right: iAs exposure increases Ugt1a6a expression, raising the rate of glucuronidation, decreasing serotonin metabolites, ultimately lowering GIIS.

References

    1. Almaça J, Molina J, Menegaz D, Pronin AN, Tamayo A, Slepak V, Berggren PO, Caicedo A. Human beta cells produce and release serotonin to inhibit glucagon secretion from alpha cells. Cell Rep 17: 3281–3291, 2016. doi: 10.1016/j.celrep.2016.11.072. - DOI - PMC - PubMed
    1. Argos M, Kalra T, Rathouz PJ, Chen Y, Pierce B, Parvez F, Islam T, Ahmed A, Rakibuz-Zaman M, Hasan R, Sarwar G, Slavkovich V, van Geen A, Graziano J, Ahsan H. Arsenic exposure from drinking water, and all-cause and chronic-disease mortalities in Bangladesh (HEALS): a prospective cohort study. Lancet 376: 252–258, 2010. doi: 10.1016/S0140-6736(10)60481-3. - DOI - PMC - PubMed
    1. Bennet H, Balhuizen A, Medina A, Dekker Nitert M, Ottosson Laakso E, Essén S, Spégel P, Storm P, Krus U, Wierup N, Fex M. Altered serotonin (5-HT) 1D and 2A receptor expression may contribute to defective insulin and glucagon secretion in human type 2 diabetes. Peptides 71: 113–120, 2015. doi: 10.1016/j.peptides.2015.07.008. - DOI - PubMed
    1. Bock KW. Roles of human UDP-glucuronosyltransferases in clearance and homeostasis of endogenous substrates, and functional implications. Biochem Pharmacol 96: 77–82, 2015. doi: 10.1016/j.bcp.2015.04.020. - DOI - PubMed
    1. Bock KW, Köhle C. UDP-glucuronosyltransferase 1A6: structural, functional, and regulatory aspects. Methods Enzymol 400: 57–75, 2005. doi: 10.1016/S0076-6879(05)00004-2. - DOI - PubMed

Publication types

MeSH terms