. 2019 Mar;67(3):185-202.
doi: 10.1369/0022155418819481. Epub 2018 Dec 18.

Factors Affecting Ultrastructural Quality in the Prefrontal Cortex of the Postmortem Human Brain

Affiliations

Factors Affecting Ultrastructural Quality in the Prefrontal Cortex of the Postmortem Human Brain

Jill R Glausier et al. J Histochem Cytochem. 2019 Mar.

Abstract

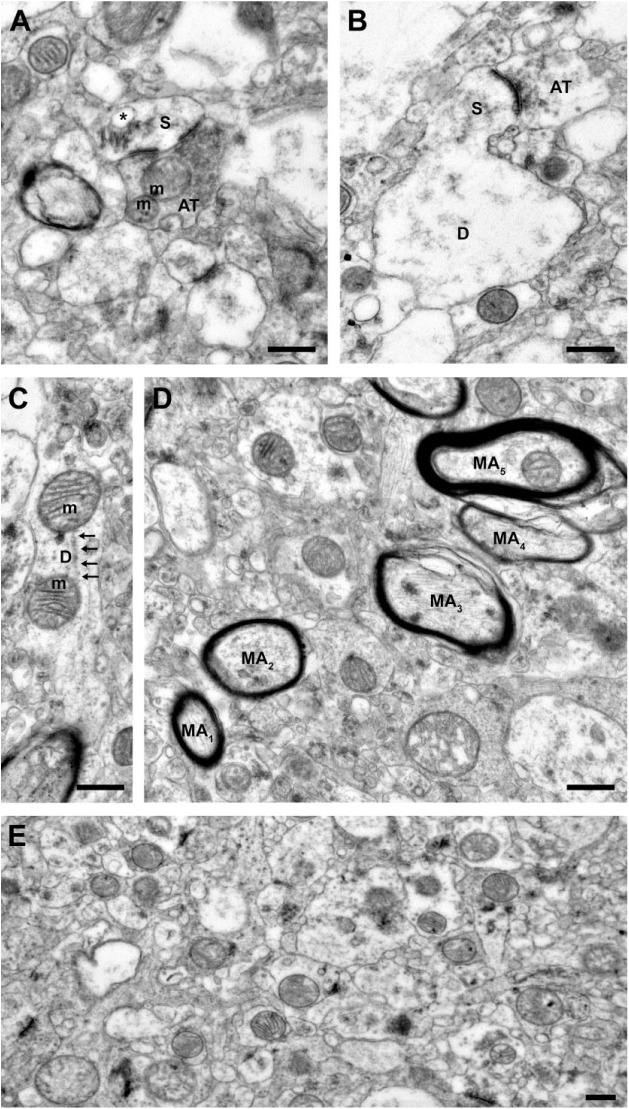
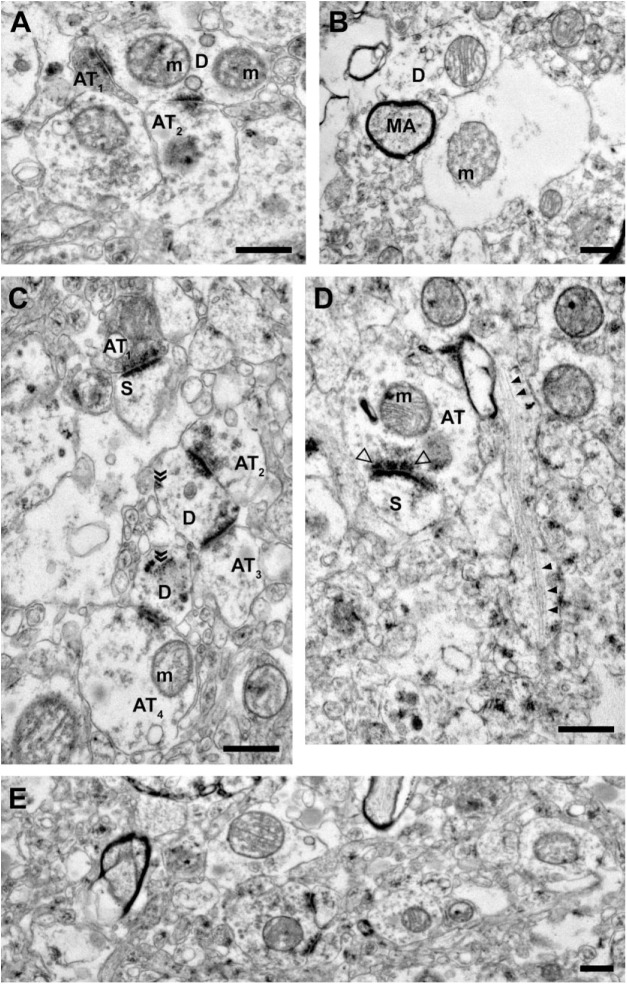
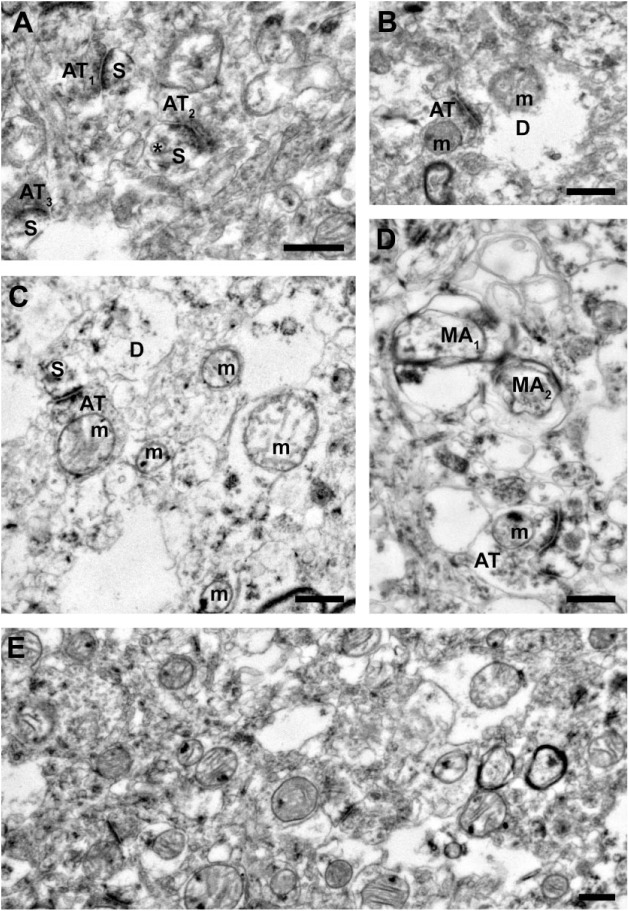
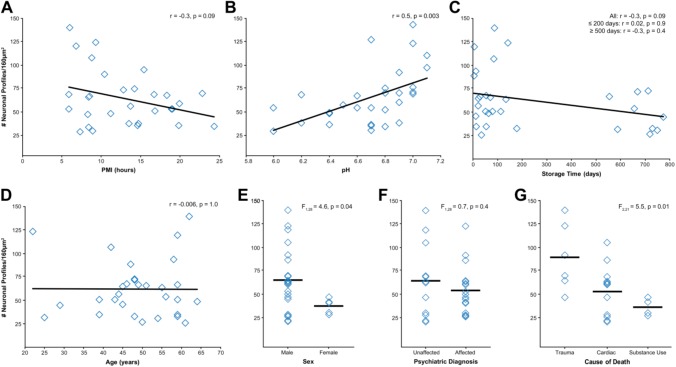
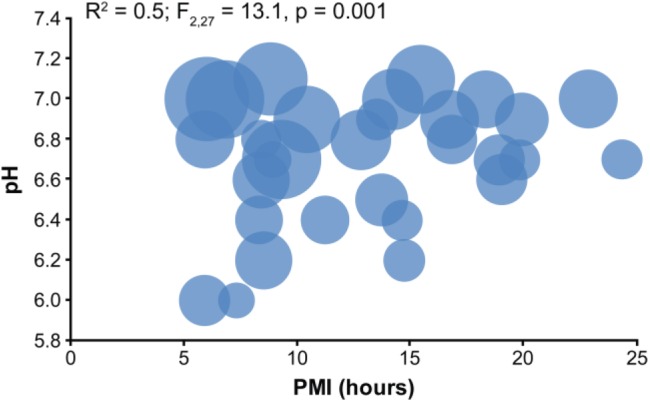
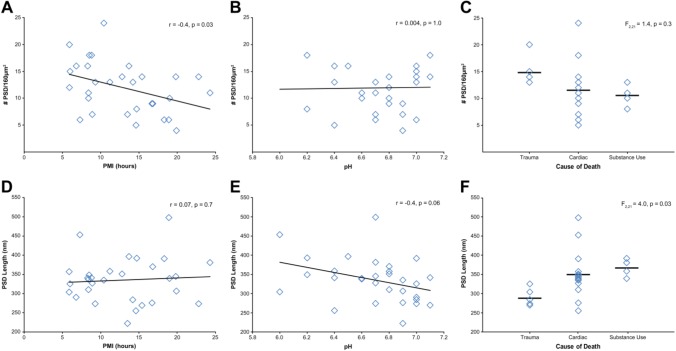
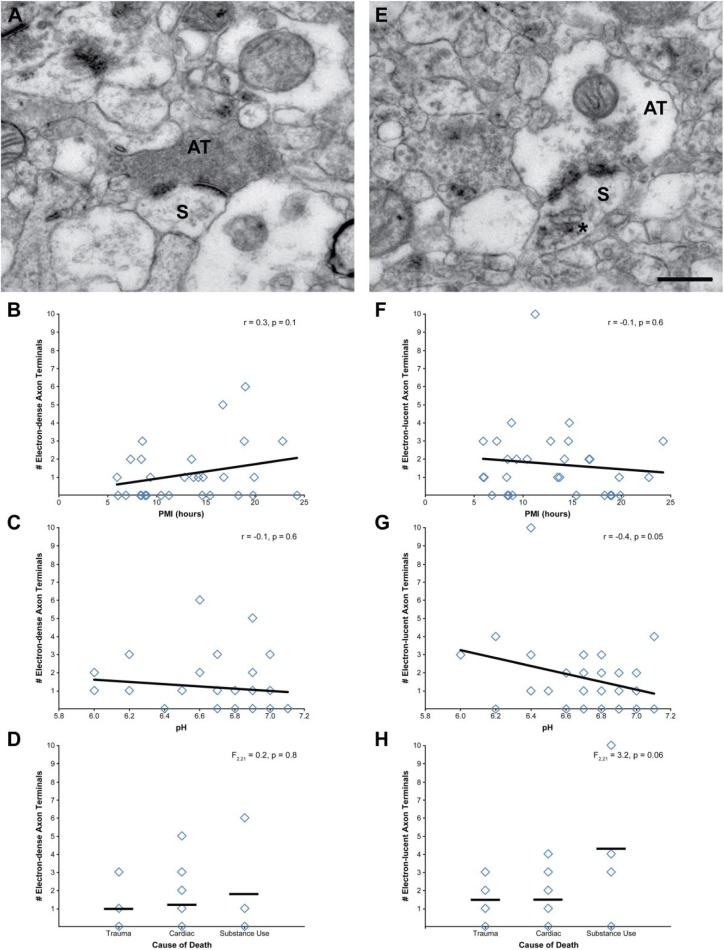
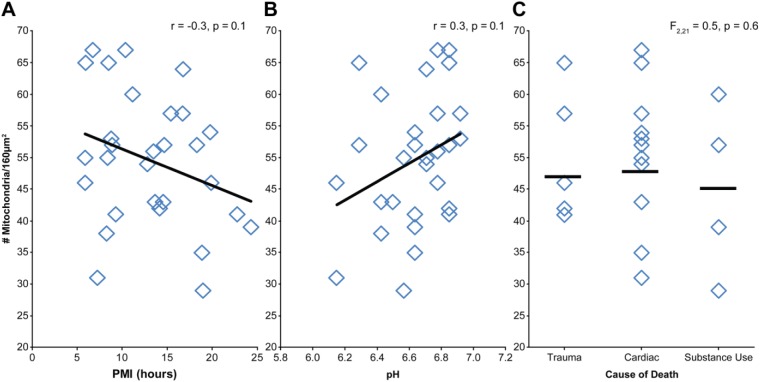
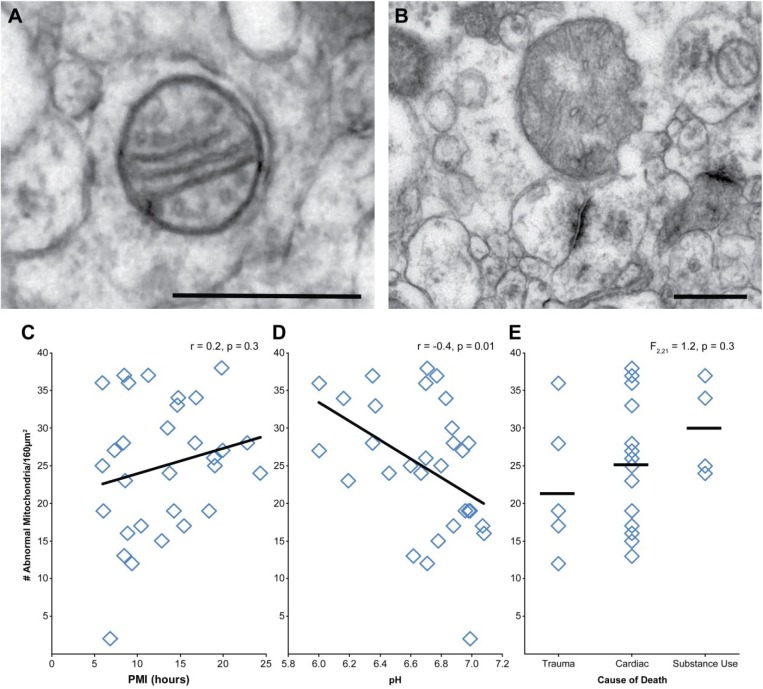
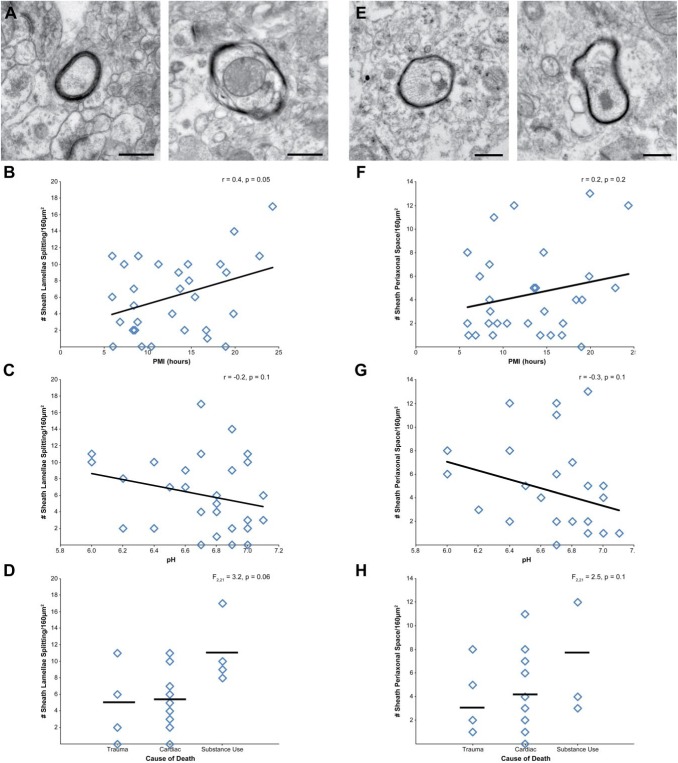
Electron microscopy (EM) studies of the postmortem human brain provide a level of resolution essential for understanding brain function in both normal and disease states. However, processes associated with death can impair the cellular and organelle ultrastructural preservation required for quantitative EM studies. Although postmortem interval (PMI), the time between death and preservation of tissue, is thought to be the most influential factor of ultrastructural quality, numerous other factors may also influence tissue preservation. The goal of the present study was to assess the effects of pre- and postmortem factors on multiple components of ultrastructure in the postmortem human prefrontal cortex. Tissue samples from 30 subjects were processed using standard EM histochemistry. The primary dependent measure was number of identifiable neuronal profiles, and secondary measures included presence and/or integrity of synapses, mitochondria, and myelinated axonal fibers. Number of identifiable neuronal profiles was most strongly affected by the interaction of PMI and pH, such that short PMIs and neutral pH values predicted the best preservation. Secondary measures were largely unaffected by pre- and postmortem factors. Together, these data indicate that distinct components of the neuropil are differentially affected by PMI and pH in postmortem human brain.

Keywords: G-ratio; acidosis; cause of death; degeneration; gray matter; mitochondria; neuropil; oligodendrocyte; postsynaptic density; psychiatric disorder.


Conflict of interest statement

Competing Interests: The author(s) declared the following potential conflicts of interest with respect to the research, authorship, and/or publication of this article: J.R.G. and A.K. declare they have no competing interests. D.A.L. currently receives investigator-initiated research support from Pfizer. In 2016–2018, he served as a consultant in the areas of target identification and validation and new compound development to Merck.

Figures

Figure 1.
Figure 1.
Representative images from tissue with good ultrastructural preservation. (A) A dendritic spine receiving a Type 1, presumably glutamatergic, synapse from an axon terminal containing numerous vesicles and two mitochondria exhibiting normal morphology. Note the perforated postsynaptic density and the extensive spine apparatus (asterisk) within the spine. (B) A dendritic spine protruding from the parent dendrite and receiving a Type 1 synapse from an axon terminal. The parent dendrite shows some signs of swelling. (C) Dendrite containing two mitochondria with normal morphology and organized microtubules (arrows). (D) Myelinated axons. Note that the ultrastructure of the central axons is preserved, but the integrity of the myelin sheaths varies. Myelin sheaths surrounding axons 1 and 2 are intact, while myelin sheaths surrounding axons 3 to 5 show some evidence of lamellae splitting. (E) A representative field of neuropil. Scale bars are 500 nm. Abbreviations: S, spine; m, mitochondrion; AT, axon terminal; D, dendrite; MA, myelinated axon.
Figure 2.
Figure 2.
Representative images from tissue with intermediate ultrastructural preservation. (A) Two axon terminals forming Type 1 synapses onto a dendritic shaft containing two mitochondria with abnormal morphology. (B) The central profile is unidentifiable as a glial process or swollen dendrite and contains a mitochondrion with abnormal morphology. The myelinated axon has an intact central axon and myelin sheath. (C) Axon terminals forming Type 1 synapses onto dendritic spines and shafts. The presence of free ribosomes (indicated by chevrons) and vesicles suggest these dendritic shaft profiles are proximal to the cell body. (D) An unmyelinated axon, cut longitudinally, containing organized neurofilaments (filled arrowheads). An axon terminal forming a Type 1 synapse onto a spine has a visible presynaptic specialization (open arrowheads). (E) A representative field of neuropil. Scale bars are 500 nm. Abbreviations: AT, axon terminal; m, mitochondrion; D, dendrite; MA, myelinated axon; S, spine.
Figure 3.
Figure 3.
Representative images from tissue with poor ultrastructural preservation. (A) Three axon terminals forming Type 1 synapses onto dendritic spines. Although sections of the plasma membranes for each spine are not preserved, each profile is still identifiable, as is a spine apparatus (asterisk). Many of the surrounding profiles cannot be identified due to poor preservation of membranes and cytoplasm swelling. (B) An axon terminal forming a Type 1 synapse onto a swollen dendrite containing a mitochondrion with abnormal morphology. (C) An axon terminal forming a Type 1 synapse onto a dendritic spine. Due to the poor membrane preservation, it is unclear whether this spine is connected to the adjacent dendrite. Although the mitochondrion in the axon terminal exhibits a normal morphology, all surrounding mitochondria are abnormal. Many of the surrounding profiles show pronounced swelling and are largely unidentifiable. (D) An axon terminal forming a Type 1 synapse onto an unknown postsynaptic profile. The two identifiable myelinated axons show profound defects in the central axons and myelinated sheaths. The remaining components of the neuropil are largely unidentifiable due to cytoplasm component depletion and swelling. (E) A representative field of neuropil. Scale bars are 500 nm. Abbreviations: AT, axon terminal; S, spine; m, mitochondrion; D, dendrite; MA, myelinated axon.
Figure 4.
Figure 4.
Assessment of pre- and postmortem factors on neuronal profile preservation in total examined neuropil area. (A) PMI and number of neuronal profiles showed a negative correlation that did not reach statistical significance. (B) pH and number of neuronal profiles showed a significant positive correlation. (C) Storage time and number of neuronal profiles showed a negative correlation that did not reach statistical significance. These two measures were not correlated in subjects with storage times ≤200 days or ≥500 days. (D) Age at time of death and number of neuronal profiles were not correlated. (E) Sex had a statistically significant effect on number of neuronal profiles; however, this finding likely reflects sex differences in tissue pH. (F) History of a psychiatric diagnosis did not affect number of neuronal profiles. (G) Cause of death had a significant effect on number of neuronal profiles. Subsequent Tukey’s test revealed significant differences between the trauma group and the cardiac and substance use groups (all p≤0.03). Abbreviation: PMI, postmortem interval.
Figure 5.
Figure 5.
PMI and pH significantly interact to affect neuronal profile preservation. Each marker represents the values of an individual subject, and the size of the circle represents the relative number of neuronal profiles identified in 160 µm2. The largest number of neuronal profiles identified was in subjects with higher pH values and shorter PMIs. Abbreviation: PMI, postmortem interval.
Figure 6.
Figure 6.
Assessment of PMI, pH, and cause of death on PSD number and length. (A) PMI and number of PSD showed a significant negative correlation. (B) Tissue pH and number of PSD were not correlated. (C) Cause of death had no effect on number of PSD identified. PSD length was not significantly correlated with PMI (D) or tissue pH (E). (F) Cause of death had a significant main effect on PSD length. Subsequent Tukey’s test revealed statistically nonsignificant differences between the trauma group and the cardiac and substance use groups (all p≥0.05). Abbreviations: PMI, postmortem interval; PSD, postsynaptic density.
Figure 7.
Figure 7.
Assessment of PMI, pH, and cause of death on degenerating axon terminals forming Type 1 asymmetric synapses. (A) Representative example of an electron-dense axon terminal. The number of electron-dense axon terminals was not significantly correlated with PMI (B) or tissue pH (C). (D) Cause of death had no effect on the number of electron-dense axon terminals. (E) Representative example of an electron-lucent axon terminal. The number of electron-lucent axon terminals was not significantly correlated with PMI (F) or tissue pH (G). (H) Cause of death had a statistically nonsignificant effect on number of electron-lucent axon terminals. Scale bar is 500 nm for panels A and E. Abbreviations: PMI, postmortem interval; AT, axon terminal; S, spine.
Figure 8.
Figure 8.
Assessment of PMI, pH, and cause of death on mitochondrial number. Neither PMI (A) nor tissue pH (B) were significantly correlated with number of mitochondria. (C) Cause of death had no significant effect on number of mitochondria. Abbreviation: PMI, postmortem interval.
Figure 9.
Figure 9.
Assessment of PMI, pH, and cause of death on mitochondrial integrity. (A) Representative example of mitochondria with normal morphology. (B) Representative example of mitochondria with abnormal morphology. (C) PMI and the number of abnormal mitochondria were not correlated. (D) Tissue pH and number of abnormal mitochondria showed a significant negative correlation. (E) Cause of death had no significant effect on number of abnormal mitochondria. Scale bars are 500 nm. Abbreviation: PMI, postmortem interval.
Figure 10.
Figure 10.
Assessment of PMI, pH, and cause of death on myelin sheath integrity. (A) Representative examples of intact myelin sheath (left) and myelin sheath with lamellae splitting (right). (B) PMI and number of myelin sheaths with lamellae splitting showed a statistically nonsignificant correlation. (C) Tissue pH and number of myelin sheaths with lamellae splitting were not correlated. (D) Cause of death had a statistically nonsignificant effect on number of myelin sheaths with lamellae splitting. (E) Representative examples of intact myelin sheath (left) and myelin sheath with expanded periaxonal space (right). Neither PMI (F) nor tissue pH (G) were correlated with the number of myelin sheaths with expanded periaxonal space (H) Cause of death had no significant effect on number of myelin sheaths with expanded periaxonal space. Scale bars are 500 nm. Abbreviation: PMI, postmortem interval.

References

    1. Gonzalez-Riano C, Tapia-Gonzalez S, Garcia A, Munoz A, DeFelipe J, Barbas C. Metabolomics and neuroanatomical evaluation of post-mortem changes in the hippocampus. Brain Struct Funct. 2017;222(6):2831–53. - PMC - PubMed
    1. Lewis DA, Glausier JR. Alterations in prefrontal cortical circuitry and cognitive dysfunction in schizophrenia. In: Li M, Spaulding WD. editors. The neuropsychopathology of schizophrenia. Vol. 63 Switzerland: Springer; 2016. p. 31–75. - PubMed
    1. Beneyto M, Sibille E, Lewis DA. Human postmortem brain research in mental illness syndromes. In: Charney DS, Nestler EJ. editors. Neurobiology of mental illness. Vol. 3e New York: Oxford University Press; c2009. p. 202–14.
    1. Bianchi D, Gordon J, Koroshetz W. The NIH NeuroBioBank: addressing the urgent need for brain donation. 2017. https://www.nimh.nih.gov/news/science-news/2017/the-nih-neurobiobank-add....
    1. Peters A, Palay SL, Webster DF. The fine structure of the nervous system. New York: Oxford University Press; 1991.

Publication types

MeSH terms

LinkOut - more resources