

Supermarket policies on less-healthy food at checkouts: Natural experimental evaluation using interrupted time series analyses of purchases
- PMID: 30562349
- PMCID: PMC6298641
- DOI: 10.1371/journal.pmed.1002712
Supermarket policies on less-healthy food at checkouts: Natural experimental evaluation using interrupted time series analyses of purchases
Abstract
Background: In response to public concerns and campaigns, some United Kingdom supermarkets have implemented policies to reduce less-healthy food at checkouts. We explored the effects of these policies on purchases of less-healthy foods commonly displayed at checkouts.
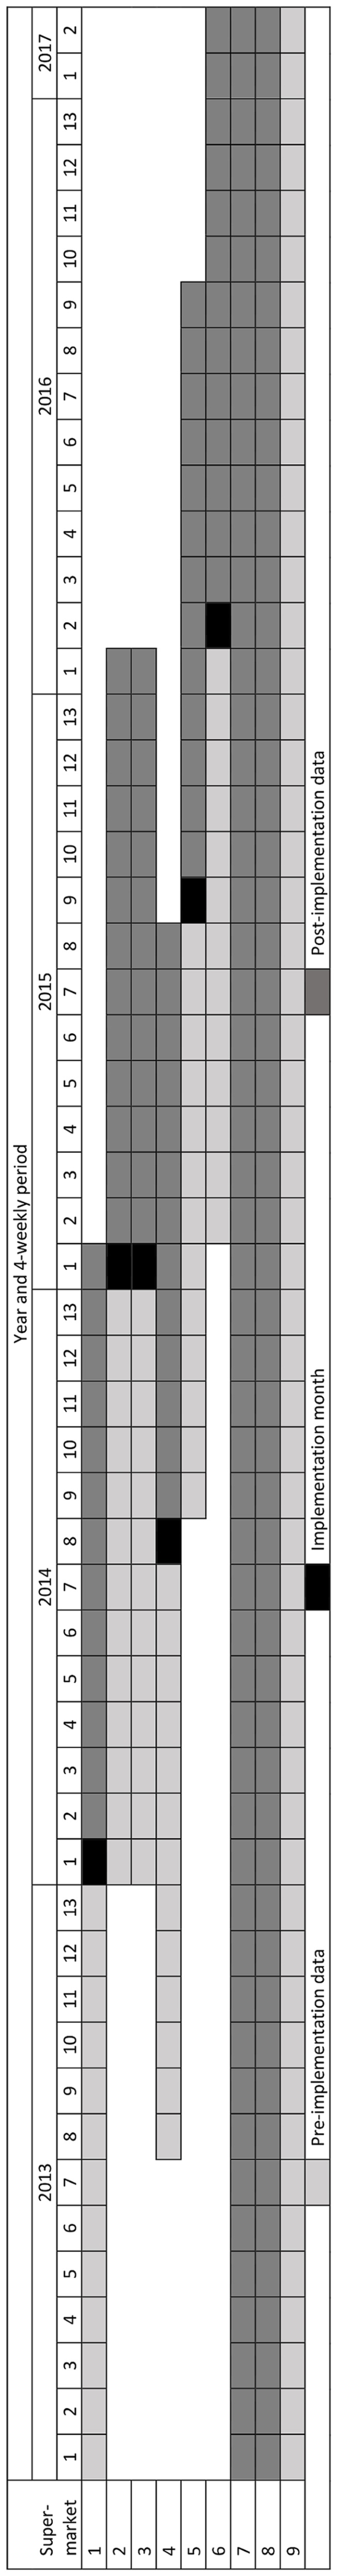
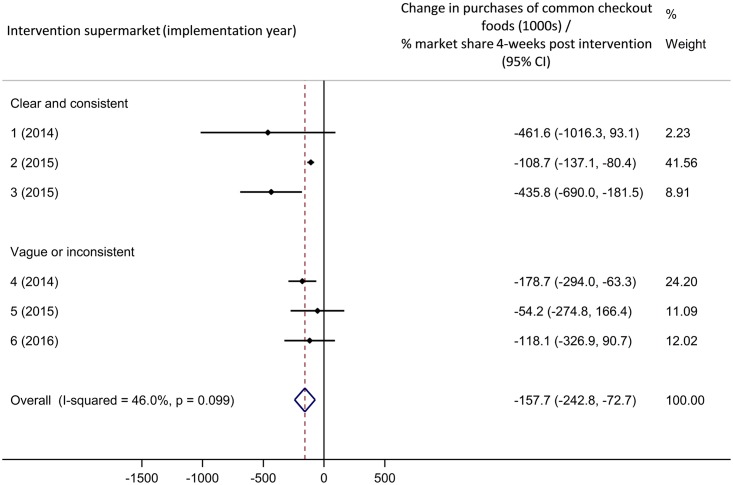
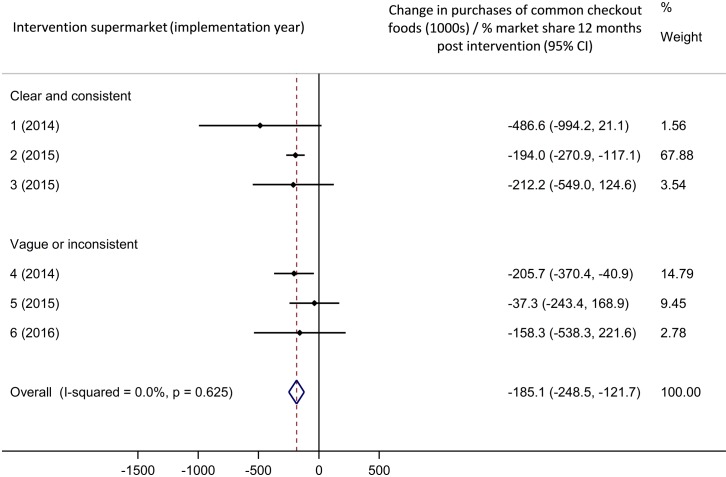
Methods and findings: We used a natural experimental design and two data sources providing complementary and unique information. We analysed data on purchases of small packages of common, less-healthy, checkout foods (sugary confectionary, chocolate, and potato crisps) from 2013 to 2017 from nine UK supermarkets (Aldi, Asda, Co-op, Lidl, M&S, Morrisons, Sainsbury's, Tesco, and Waitrose). Six supermarkets implemented a checkout food policy between 2013 and 2017 and were considered intervention stores; the remainder were comparators. Firstly, we studied the longitudinal association between implementation of checkout policies and purchases taken home. We used data from a large (n ≈ 30,000) household purchase panel of food brought home to conduct controlled interrupted time series analyses of purchases of less-healthy common checkout foods from 12 months before to 12 months after implementation. We conducted separate analyses for each intervention supermarket, using others as comparators. We synthesised results across supermarkets using random effects meta-analyses. Implementation of a checkout food policy was associated with an immediate reduction in four-weekly purchases of common checkout foods of 157,000 (72,700-242,800) packages per percentage market share-equivalent to a 17.3% reduction. This decrease was sustained at 1 year with 185,100 (121,700-248,500) fewer packages purchased per 4 weeks per percentage market share-equivalent to a 15.5% reduction. The immediate, but not sustained, effect was robust to sensitivity analysis. Secondly, we studied the cross-sectional association between checkout food policies and purchases eaten without being taken home. We used data from a smaller (n ≈ 7,500) individual purchase panel of food bought and eaten 'on the go'. We conducted cross-sectional analyses comparing purchases of common checkout foods in 2016-2017 from supermarkets with and without checkout food policies. There were 76.4% (95% confidence interval 48.6%-89.1%) fewer annual purchases of less-healthy common checkout foods from supermarkets with versus without checkout food policies. The main limitations of the study are that we do not know where in the store purchases were selected and cannot determine the effect of changes in purchases on consumption. Other interventions may also have been responsible for the results seen.
Conclusions: There is a potential impact of checkout food polices on purchases. Voluntary supermarket-led activities may have public health benefits.
Conflict of interest statement
The authors have declared that no competing interests exist.
Figures

References
-
- Hawkes C. Dietary Implications of Supermarket Development: A Global Perspective. Development Policy Review. 2008;26(6): 657–92.
-
- Dawson J. Retailer activity in shaping food choice. Food Quality and Preference. 2013;28(1): 339–47.
-
- Hastings G, Stead M. Social marketing In: Macdowall W, Bonell C, Davies M, editors. Health Promot Pract. Maidenhead, UK: Open University Press; 2006. p. 139–51.
Publication types
MeSH terms
Grants and funding
LinkOut - more resources
Full Text Sources
Miscellaneous
