. 2018 Dec 17;8(12):1065.
doi: 10.3390/nano8121065.

Polydopamine/Transferrin Hybrid Nanoparticles for Targeted Cell-Killing

Affiliations

Polydopamine/Transferrin Hybrid Nanoparticles for Targeted Cell-Killing

Daniel Hauser et al. Nanomaterials (Basel). .

Abstract

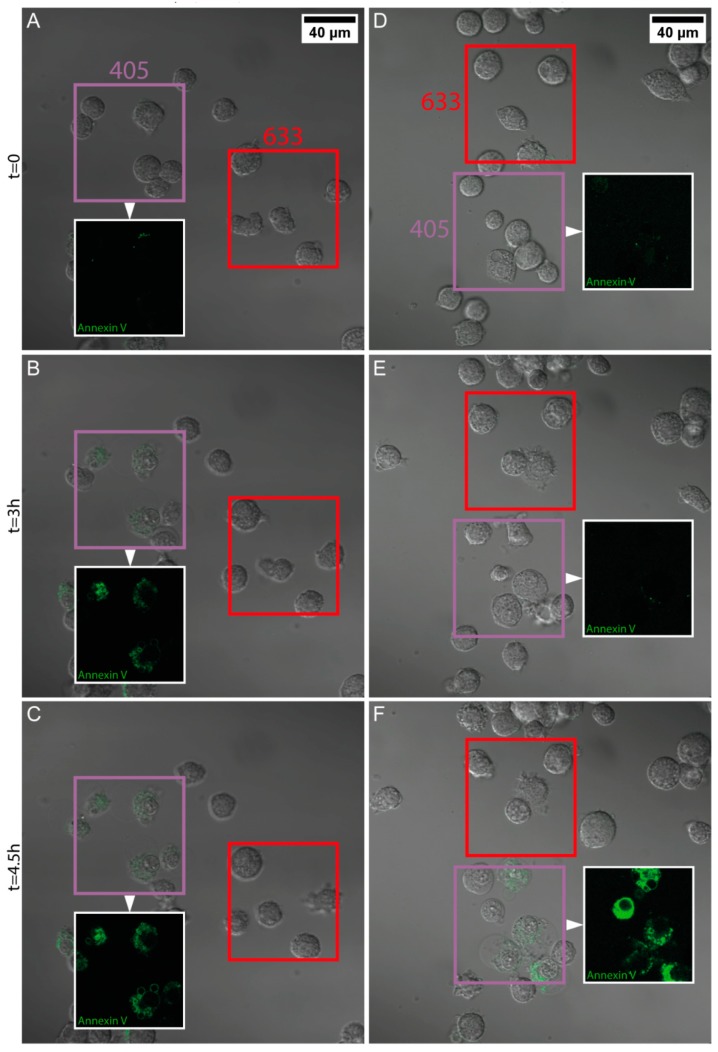
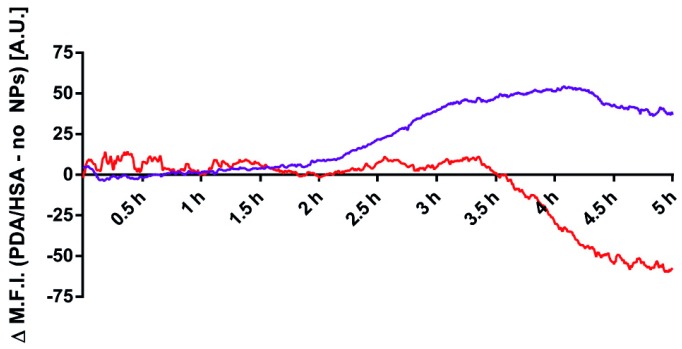
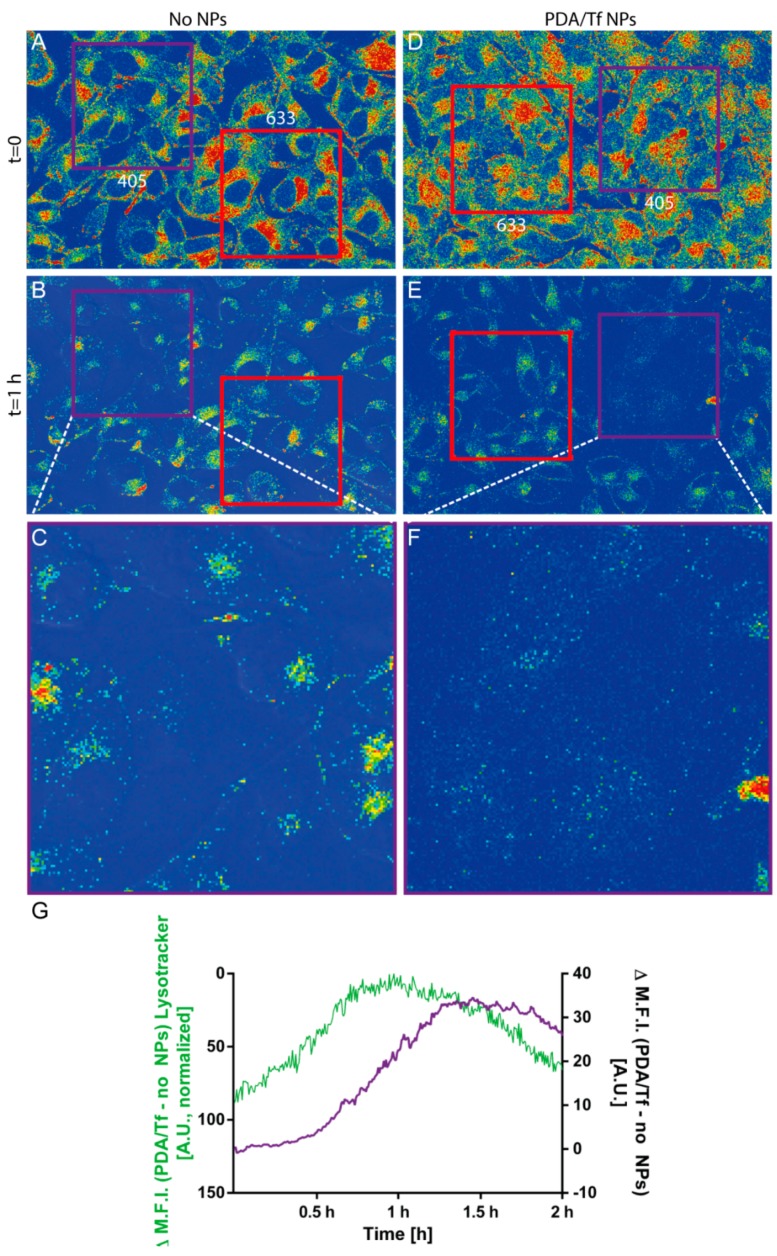
Polydopamine can form biocompatible particles that convert light into heat. Recently, a protocol has been optimized to synthesize polydopamine/protein hybrid nanoparticles that retain the biological function of proteins, and combine it with the stimuli-induced heat generation of polydopamine. We have utilized this novel system to form polydopamine particles, containing transferrin (PDA/Tf). Mouse melanoma cells, which strongly express the transferrin receptor, were exposed to PDA/Tf nanoparticles (NPs) and, subsequently, were irradiated with a UV laser. The cell death rate was monitored in real-time. When irradiated, the melanoma cells exposed to PDA/Tf NPs underwent apoptosis, faster than the control cells, pointing towards the ability of PDA/Tf to mediate UV-light-induced cell death. The system was also validated in an organotypic, 3D-printed tumor spheroid model, comprising mouse melanoma cells, and the exposure and subsequent irradiation with UV-light, yielded similar results to the 2D cell culture. The process of apoptosis was found to be targeted and mediated by the lysosomal membrane permeabilization. Therefore, the herein presented polydopamine/protein NPs constitute a versatile and stable system for cancer cell-targeting and photothermal apoptosis induction.

Keywords: 3D cell printing; cell targeting; live cell imaging; lysosomal membrane permeabilization; polydopamine/transferrin nanoparticles; spheroids; targeted apoptosis in vitro.


Conflict of interest statement

The authors declare no conflict of interest and the funders had no role in the design of the study; in the collection, analyses, or interpretation of data; in the writing of the manuscript, or in the decision to publish the results.

Figures

Figure 1
Figure 1
Characterization of the polydopamine particles, containing transferrin (PDA/Tf), polydopamine/human serum albumin (PDA/HSA), and PDA/Tf-A488 nanoparticles (NPs). (A) Photograph of an aqueous suspension of PDA/HSA NPs, and (B) absorbance spectra of the PDA/HSA with the subtracted background of bare PDA NPs (black line), and absorbance spectra of the HSA alone (green line). (C) The absorbance spectra of the PDA/Tf with subtracted background of the bare PDA NPs (black line), absorbance spectra of the Tf alone (green line), and (D) the absorbance spectra of the PDA/Tf-A488 (black line). The dotted lines represent typical absorbance maxima for the proteins (270–280 nm) and the Alexa 488 fluorophore (495 nm), in panels (B,C). (E) The absorbance measurement of the bare PDA NPs, PDA/HSA NPs, and PDA/Tf NPs, at 280 nm. The difference in absorbance of the bare PDA NPs and the PDA/protein NPs can be attributed to the proteins present. (F) Scanning electron micrograph of the drop-casted PDA/Tf NPs, and (G) scanning electron micrograph of the drop-casted PDA/HSA NPs. Scale bar = 500 nm.
Figure 2
Figure 2
Comparison of the heat dissipation of the PDA/TF and the PDA/HSA, at 100 μg/mL (A). 2D amplitude heat map of the same measurement, recorded with lock-in thermography (LIT) (PDA/Tf left, PDA/HSA right) (B). A higher amplitude signal corresponds to a more intense heat generation. N = 5.
Figure 3
Figure 3
Rate of apoptosis induction in the J774A.1 mouse macrophages exposed to the PDA/HSA NPs, upon light irradiation. The macrophages were exposed to 20 μg/mL PDA/HSA NPs (AC and Supplementary Video 2) or media only (DF and Supplementary Video 3). Subsequently, two separate regions were defined in the field of view; one was irradiated with UV-light (405 nm, purple square), and the other with red light (633 nm, red square). The addition of the Annexin V stain (green fluorescence) allowed for real-time visualization of the onset of apoptosis. Snapshots taken throughout the duration of the experiment are presented, i.e., at t = 0 h (A and D), t = 3 h (B,E), and t = 4.5 h (C,F). For better visibility, only the Annexin V signal channel in the regions irradiated with UV-light is shown (insets).
Figure 4
Figure 4
The Δ mean fluorescent intensity (M.F.I.) of the green fluorescent signals shown in Figure 3 are presented as the normalized mean fluorescent intensity, per region, and the values from the negative control results were subtracted.
Figure 5
Figure 5
Rate of apoptosis induction in the B16F10 mouse melanoma cells exposed to the PDA/protein NPs, upon light irradiation. The melanoma cells were exposed to 20 μg/mL PDA/Tf NPs (AC and Supplementary Video 4), PDA/HSA NPs (DF and Supplementary Video 5), or media only (GI and Supplementary Video 6). Similar to Figure 3, two regions, per field, were defined, one irradiated by 405 nm light (purple square) and one with 633 nm light (red square). The addition of the Annexin V dye allowed for the analysis of the apoptosis onset. Different time points are presented: t = 0 (A,D,G), t = 1 h (B,E,H), and t = 2 h (C,F,I). All datasets have an n value of at least three.
Figure 6
Figure 6
Analysis of the apoptosis rate in the B16F10 mouse melanoma cells, by UV-light irradiation dependent on NP exposure. The rate obtained for the cells not exposed to NPs was subtracted from the rate measured when the cells were exposed to the PDA/HSA NPs, for both regions, independently, yielding the Δ mean fluorescent intensity (M.F.I.) value (A). For the 405 nm results, a negative trend could be observed, whereas, the cell death rate in the 633 nm region increased as expected. Additionally, the effect of PDA/Tf NPs versus the negative control was evaluated by subtracting the negative control from the PDA/Tf NP data (B). The apoptosis rate of cells exposed to the PDA/Tf NPs was faster than the negative control, manifesting itself in an increasing ΔM.F.I. Finally, the ΔM.F.I. of the 405 nm regions of PDA/Tf vs. the negative control (dotted line) and the PDA/Tf vs the PDA/Tf blocked (solid line) were compared (C). There is an observable shift of the effect to a later time-point, indicating a successful blocking of the transferrin receptor. ★ The sudden drop in the 633 nm signal was due to a faulty recording in one of the frames of the repetitions. N = 3–4.
Figure 7
Figure 7
Visualization of the lysosomal marker in the B16F10 mouse melanoma cells exposed to no NPs (A) or the PDA/Tf NPs (B), and then irradiated with 405 nm and 633 nm light. After 1 h, less fluorescence of the lysosomal marker was observed in the cells exposed to the PDA/Tf NPs, irradiated with 405 nm light, than those exposed to the 633 nm light (E,F, and Supplementary Video 7), as well as to the non-particle-exposed cells (B,C and Supplementary Video 8). The decrease in the fluorescence signal of the Lysotracker® was analyzed and plotted together with the signal corresponding to the apoptosis induction, in cells exposed to the PDA/Tf NPs, and irradiated with the UV-light (G). N = 3.
Figure 8
Figure 8
Light-induced apoptosis using melanoma spheroid models. The development of the spheroid model is depicted in the representative images in panel (A), corresponding to the increasing time-points during their growth. Representative phase contrast image of the spheroid model with the selected regions of elevated irradiation with 405 nm (violet) and 633 nm (red) laser light (B). Rendered cLSM z-stack of the stained B16F10 assembled into the spheroid model, after 24 h of development (C). Analyzed frames of the videos showing the B16F10 spheroids, exposed to the PDA/Tf NPs, at time point 0 (D), after 2.5 h (E), and 4.5 h (F), and spheroids exposed to the PDA/HSA NPs, at time point 0 (G), after 2.5 h (H), and 4.5 h (I). Every frame of the videos was analyzed and the Annexin V intensity per irradiated area, either 405 (violet) or 633 (red), was recorded and is shown in panel (J). The blue line represents the cell-death rate of the samples treated with the PDA/Tf NPs, the violet line is that of the samples treated with the PDA/HSA NPs, and both were irradiated with a 405 nm laser light. The red line represents the cell-death rate of the samples treated with the PDA/Tf NPs, the green line shows the samples treated with the PDA/HSA NPs (both irradiated with 633 nm laser light). N of PDA/Tf = 2 and N of PDA/HSA = 3.

References

    1. Lehner R., Wang X., Marsch S., Hunziker P. Intelligent nanomaterials for medicine: Carrier platforms and targeting strategies in the context of clinical application. Nanomed. Nanotechnol. Biol. Med. 2013;9:742–757. doi: 10.1016/j.nano.2013.01.012. - DOI - PubMed
    1. Mura S., Nicolas J., Couvreur P. Stimuli-responsive nanocarriers for drug delivery. Nat. Mater. 2013;12:991–1003. doi: 10.1038/nmat3776. - DOI - PubMed
    1. Lehner R., Wang X., Wolf M., Hunziker P. Designing switchable nanosystems for medical application. J. Control. Release. 2012;161:307–316. doi: 10.1016/j.jconrel.2012.04.040. - DOI - PubMed
    1. Riehemann K., Schneider S.W., Luger T.A., Godin B., Ferrari M., Fuchs H. Nanomedicine—Challenge and perspectives. Angew. Chem. Int. Ed. 2009;48:872–897. doi: 10.1002/anie.200802585. - DOI - PMC - PubMed
    1. Buckiová D., Ranjan S., Newman T.A., Johnston A.H., Sood R., Kinnunen P.K.J., Popelář J., Chumak T., Syka J. Minimally invasive drug delivery to the cochlea through application of nanoparticles to the round window membrane. Nanomedicine. 2012;7:1339–1354. doi: 10.2217/nnm.12.5. - DOI - PubMed

LinkOut - more resources