

A mathematical model of neuroinflammation in severe clinical traumatic brain injury
- PMID: 30563537
- PMCID: PMC6299616
- DOI: 10.1186/s12974-018-1384-1
A mathematical model of neuroinflammation in severe clinical traumatic brain injury
Abstract
Background: Understanding the interdependencies among inflammatory mediators of tissue damage following traumatic brain injury (TBI) is essential in providing effective, patient-specific care. Activated microglia and elevated concentrations of inflammatory signaling molecules reflect the complex cascades associated with acute neuroinflammation and are predictive of recovery after TBI. However, clinical TBI studies to date have not focused on modeling the dynamic temporal patterns of simultaneously evolving inflammatory mediators, which has potential in guiding the design of future immunomodulation intervention studies.
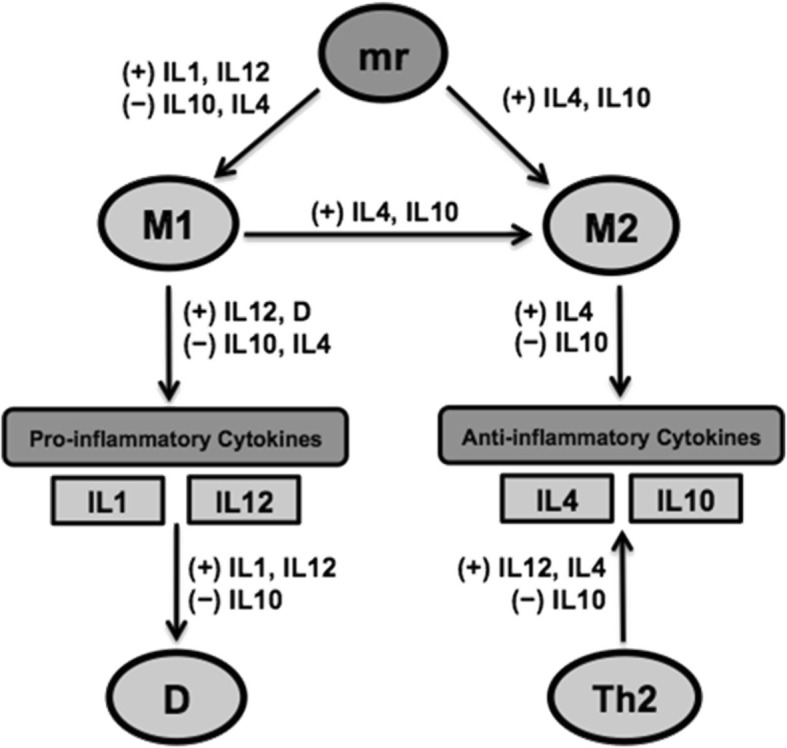
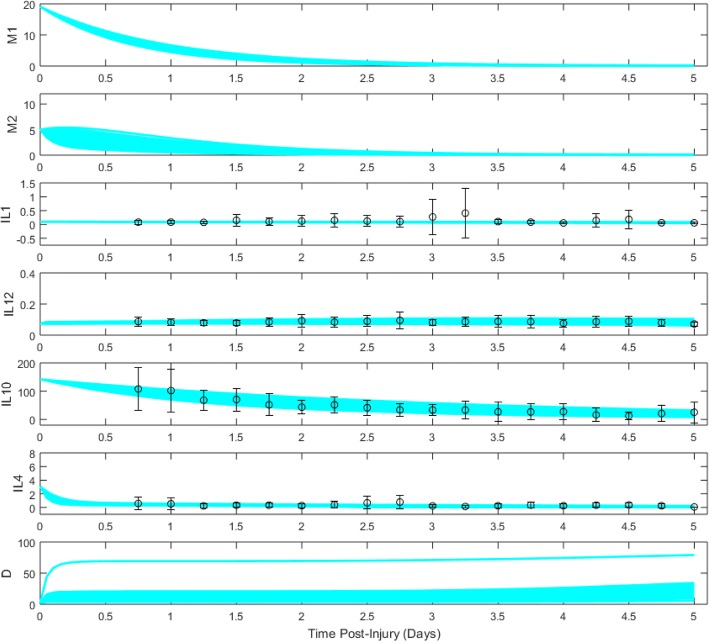
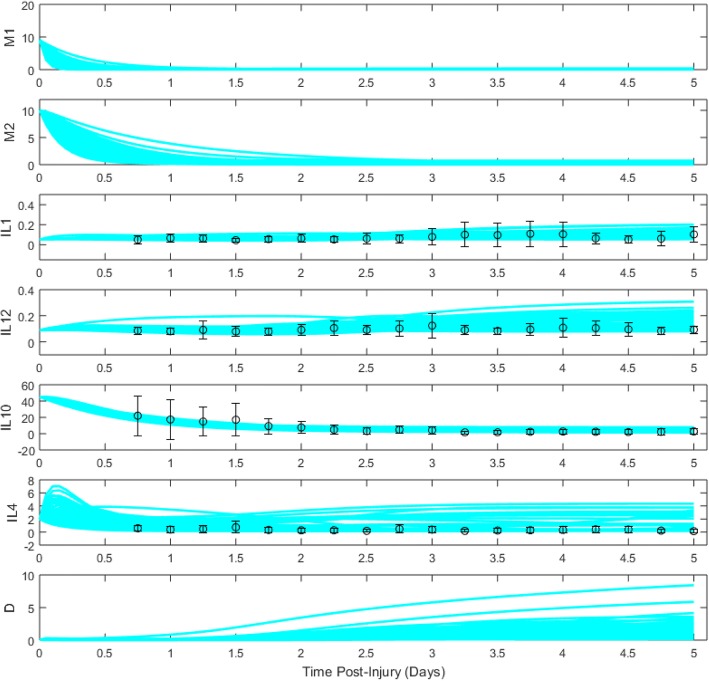
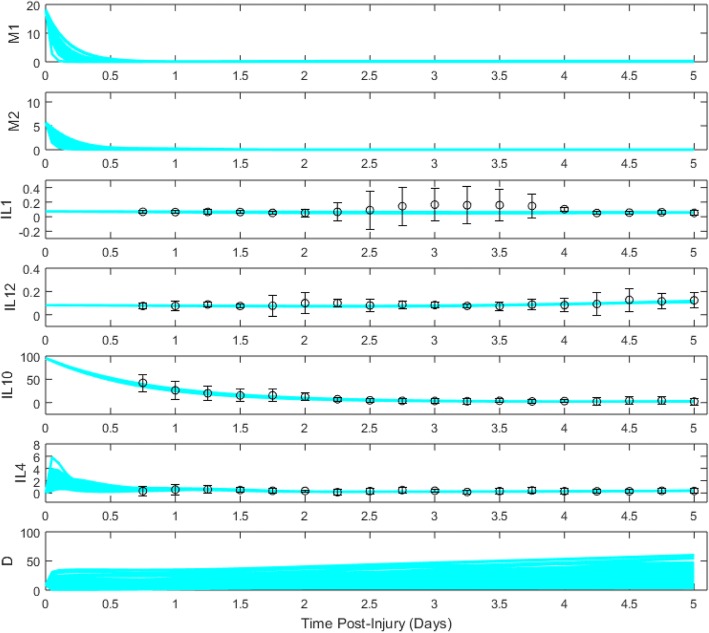
Methods: We derived a mathematical model consisting of ordinary differential equations (ODE) to represent interactions between pro- and anti-inflammatory cytokines, M1- and M2-like microglia, and central nervous system (CNS) tissue damage. We incorporated variables for several cytokines, interleukin (IL)-1β, IL-4, IL-10, and IL-12, known to have roles in microglial activation and phenotype differentiation. The model was fit to cerebrospinal fluid (CSF) cytokine data, collected during the first 5 days post-injury in n = 89 adults with severe TBI. Ensembles of model fits were produced for three patient subgroups: (1) a favorable outcome group (GOS = 4,5) and (2) an unfavorable outcome group (GOS = 1,2,3) both with lower pro-inflammatory load, and (3) an unfavorable outcome group (GOS = 1,2,3) with higher pro-inflammatory load. Differences in parameter distributions between subgroups were ranked using Bhattacharyya metrics to identify mechanistic differences underlying the neuroinflammatory patterns of patient groups with different TBI outcomes.
Results: Optimal model fits to data showed different microglial and damage responses by patient subgroup. Upon comparison of model parameter distributions, unfavorable outcome groups were characterized by either a prolonged, pathophysiological or a transient, sub-physiological course of neuroinflammation.
Conclusion: By developing a mathematical characterization of inflammatory processes informed by clinical data, we have created a system for exploring links between acute neuroinflammatory components and patient outcome in severe TBI.
Keywords: Biomarker; Cerebrospinal fluid; Cytokines; Glasgow outcome scale; Inflammation; Mathematical modeling; Microglia; Patient outcome; Traumatic brain injury.
Conflict of interest statement
Ethics approval and consent to participate
This study was approved by the Institutional Review Board at the University of Pittsburgh.
Consent for publication
Not applicable.
Competing interests
The authors declare that they have no competing interests.
Publisher’s Note
Springer Nature remains neutral with regard to jurisdictional claims in published maps and institutional affiliations.
Figures

References
-
- Hyder AA, Wunderlich CA, Puvanachandra P, Gururaj G, Kobusingye OC. The impact of traumatic brain injuries: a global perspective. NeuroRehabilitation. 2007;22:341–353. - PubMed
MeSH terms
Substances
Grants and funding
LinkOut - more resources
Full Text Sources
