Randomized Controlled Trial
. 2019 Mar;7(3):466-475.
doi: 10.1158/2326-6066.CIR-18-0336. Epub 2018 Dec 18.

Rapamycin Prevents Surgery-Induced Immune Dysfunction in Patients with Bladder Cancer

Affiliations
Randomized Controlled Trial

Rapamycin Prevents Surgery-Induced Immune Dysfunction in Patients with Bladder Cancer

Robert S Svatek et al. Cancer Immunol Res. 2019 Mar.

Abstract

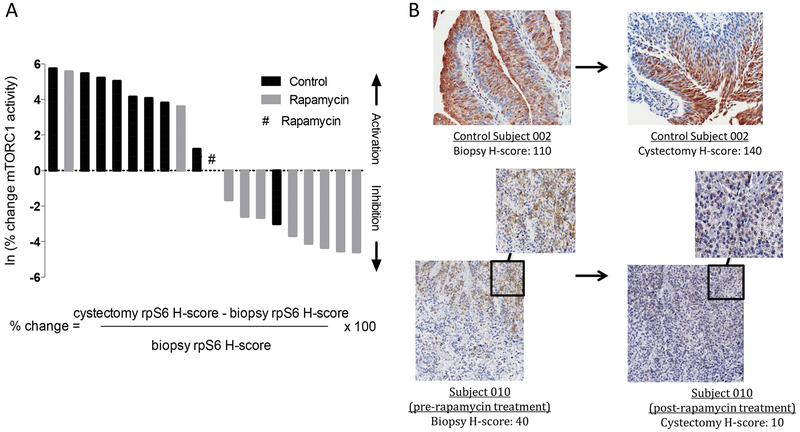
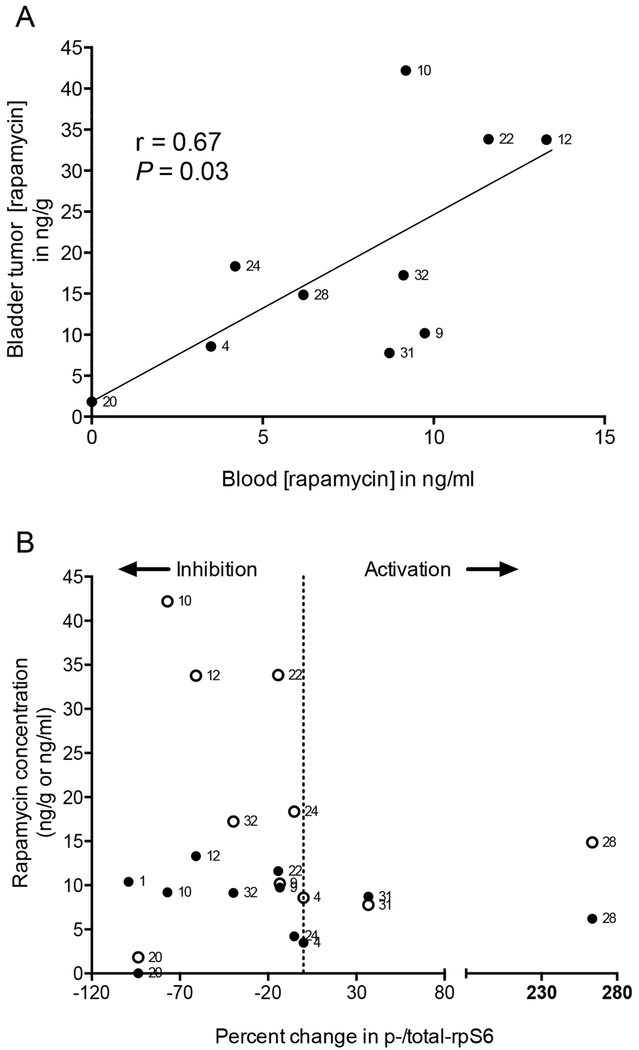
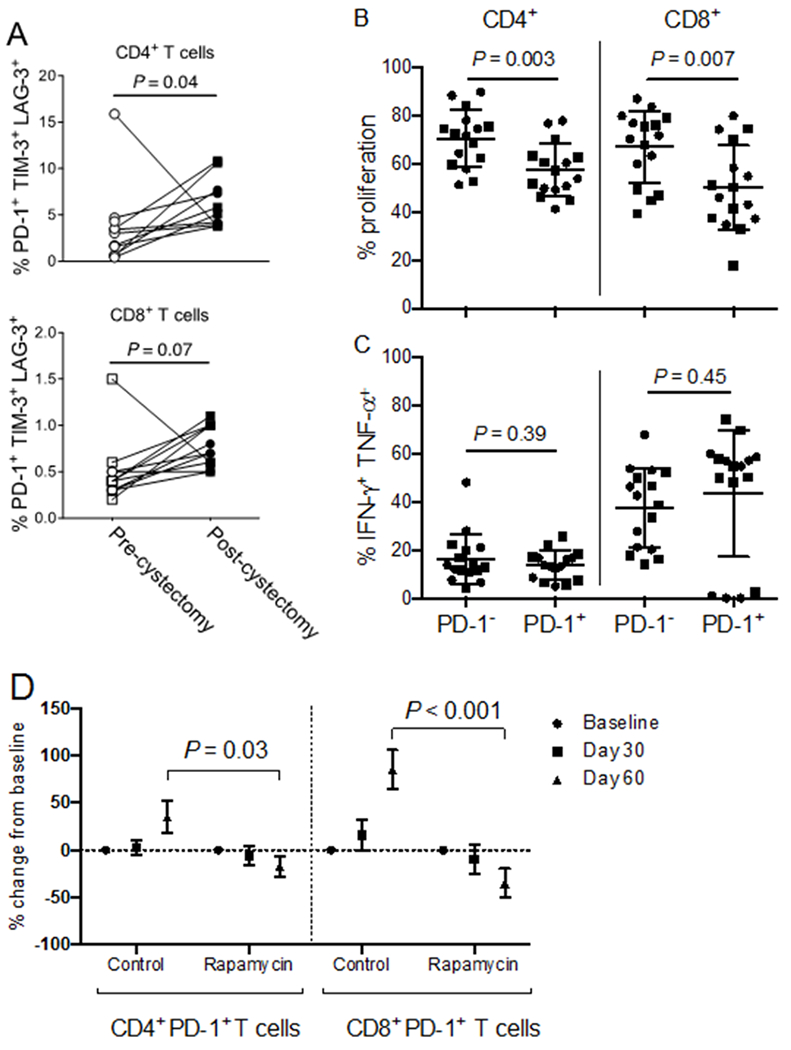
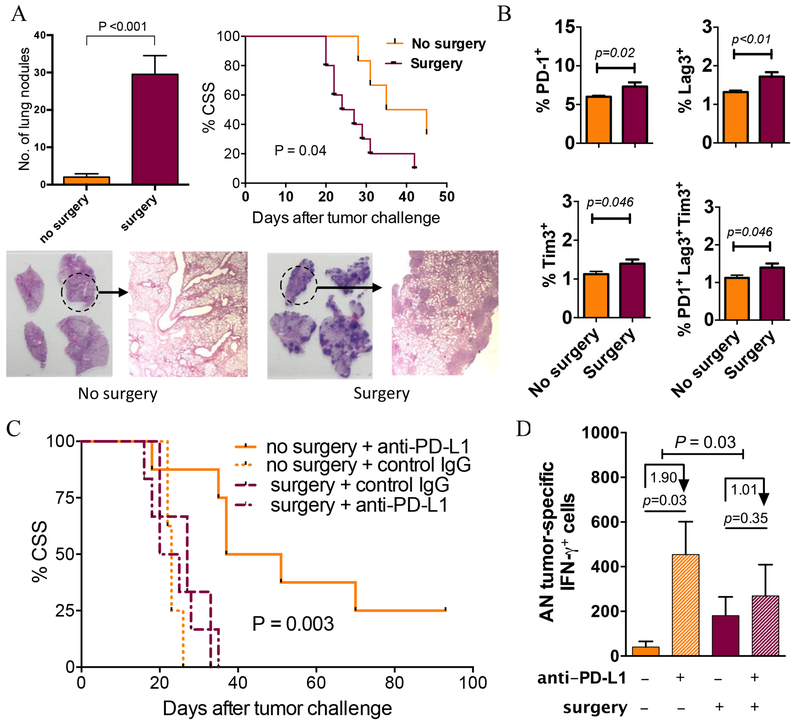
The mechanistic target of rapamycin (mTOR) integrates environmental inputs to regulate cellular growth and metabolism in tumors. However, mTOR also regulates T-cell differentiation and activation, rendering applications of mTOR inhibitors toward treating cancer complex. Preclinical data support distinct biphasic effects of rapamycin, with higher doses directly suppressing tumor cell growth and lower doses enhancing T-cell immunity. To address the translational relevance of these findings, the effects of the mTOR complex 1 (mTORC1) inhibitor, rapamycin, on tumor and T cells were monitored in patients undergoing cystectomy for bladder cancer. MB49 syngeneic murine bladder cancer models were tested to gain mechanistic insights. Surgery-induced T-cell exhaustion in humans and mice and was associated with increased pulmonary metastasis and decreased PD-L1 antibody efficacy in mouse bladder cancer. At 3 mg orally daily, rapamycin concentrations were 2-fold higher in bladder tissues than in blood. Rapamycin significantly inhibited tumor mTORC1, shown by decreased rpS6 phosphorylation in treated versus control patients (P = 0.008). Rapamycin reduced surgery-induced T-cell exhaustion in patients, evidenced by a significant decrease in the prevalence of dysfunctional programmed death-1 (PD-1)-expressing T cells. Grade 3 to 4 adverse event rates were similar between groups, but rapamycin-treated patients had a higher rate of wound complications versus controls. In conclusion, surgery promoted bladder cancer metastasis and decreased the efficacy of postoperative bladder cancer immunotherapy. Low-dose (3 mg daily) oral rapamycin has favorable pharmacodynamic and immune modulating activity in surgical patients and has the potential to decrease surgery-induced immune dysfunction.


Conflict of interest statement

The authors declare no potential conflicts of interest.

Figures

Figure 1.
Figure 1.. Rapamycin inhibits rpS6 kinase in BC.
Following biopsy of bladder tumors, patients with invasive BC were randomized to receive rapamycin (3 mg orally daily for 30 days) or no rapamycin prior to cystectomy. Blood and tissue concentrations of rapamycin were assessed on day 30, at time of cystectomy. For PD assessment, pre-treatment (biopsy) tissue was compared to post-treatment (cystectomy) tissue. (A) Waterfall bar plot showing primary PD end point, rpS6 kinase phosphorylation inhibition, in paired BC tissues [biopsy and cystectomy cancer tissue] among rapamycin-treated (n=11) and control (n=9) subjects. Percentage (%) change in phospho (p)/total (t) rpS6 (before and after rapamycin/ control) was calculated using the equation shown. (B) Representative IHC of staining for phosphorylated (Ser240/244) rpS6 of control subject 002 and rapamycin-treated subject 010 with H-score depicted. Data are from one representative experiment.
Figure 2.
Figure 2.. Rapamycin concentrations and PD effects in BC.
For patients on treatment, blood and tissue concentrations of rapamycin were analyzed 30 days after randomization (time of cystectomy) and measured using mass spectrometry. (A) Scatter plot showing individual blood and corresponding bladder tumor tissue rapamycin concentrations. Number next to each point represents subject number. P represents two-tailed test of Pearson correlation coefficient (r) for n=10 patients with available rapamycin concentrations. P value threshold for significance ≤0.05. (B) Scatter plot showing individual rapamycin bladder tumor tissue concentrations (filled symbols expressed as ng/g) and peripheral blood concentrations (open symbols expressed as ng/mL) across percentage change in p-/total rpS6 (before and after rapamycin) among rapamycin-treated patients with evaluable tissue for biomarker assessment (n=11). Vertical line at 0% change in p-/total rpS6 defines activation versus inhibition. Data are from one representative experiment.
Figure 3.
Figure 3.. PD-1+ T cells are less proliferative than PD-1 T cells in patients with BC, and rapamycin decreases T-cell exhaustion.
Peripheral blood mononuclear cells (PBMCs) from patients on trial. (A) Patients (n=11) with sufficient PBMCs were analyzed at baseline (before cystectomy) and at 60 days from registration. Phenotypes were determined using flow cytometry gated from live CD45+CD3+CD4+ (top) or CD45+CD3+CD8+ (bottom) lymphocytes. Proportion of cells co-expressing LAG-3, TIM-3, and PD-1 was analyzed. P: two-tailed Wilcoxin matched-pairs signed rank test. (B-C) PBMCs were sorted to high purity based on CD3+PD-1+ versus CD3+PD-1 T cell surface expression using fluorescence-activated cell sorting (n=16 patients). Cells were stained with CFSE and stimulated in vitro with CD3/CD28 Dynabeads in a 1:1 cell to bead ratio. After three days, cells were stained for CD4 and CD8 and analyzed using flow cytometry for (B) proliferation or (C) cytokine expression. P: unpaired, two-tailed t tests. Circles represent control patients (n=8). Squares represent rapamycin-treated patients (n=8). (D) The proportion of PD-1+ T cells among live CD45+CD3+CD4+ and live CD45+CD3+CD8+ T cells was determined using flow cytometry and analyzed as a percentage change from baseline for patient with sufficient material (n=8 controls and n=9 rapamycin). Results shown as mean±SEM. The mean values at specified time points were compared for control versus rapamycin-treated groups. P: unpaired, two-tailed t-tests. P value threshold for significance < 0.05. Data are from one representative experiment.
Figure 4.
Figure 4.. Surgery promotes BC growth and inhibits antitumor immunity in mice.
(A-B) C57Bl/6 (BL6) male mice (n=6/group) were challenged intravenously with MB49 tumor cells then anesthetized and subjected to 3 cm ventral laparotomy (surgery) versus no surgery. Mice were followed for cancer-specific survival (CSS, metastasis confirmed by necropsy) or sacrificed on day 14. (A) Lungs were analyzed for the presence of tumors (mean±SEM on y-axis), quantified by gross examination (representative samples of lung sections from one control and surgery mice shown), and confirmed with histopathology. CSS with and without surgery shown. (B) Cell surface exhaustion markers were detected and measured for splenic T cells. N=7-10 mice/group. P: two-tailed t test. (C) BL6 female mice were challenged orthotopically with MB49 tumor cells then subjected to surgery versus no surgery and given anti–PD-L1 or isotype control antibody on days 7, 12, and 17. N=6-8 mice/group. Survival compared between surgery + anti–PD-L1 versus no surgery + anti–PD-L1 treated mice using log-rank test (significance shown as P). (D) In similar experiments with n=5 mice/group, bladder tumor-draining lymph nodes (TDLNs) were harvested on day 15 after tumor challenge. TDLN cells (0.25 x 10⁶ cells per well) were recalled ex vivo by incubating with irradiated MB49 cells in 1:1 cell TDLN to MB49 cell ratio, and absolute number (AN) of tumor-specific IFNγ-producing cells per TDLN were quantified by ELISPOT assay. Numbers under arrows represent median log-fold change between groups. P indicates the significance of the difference in fold change between surgery and no surgery assessed with two-sided testing on the group (surgery, no surgery) by condition (IgG control, anti–PD-L1) interaction term in a linear model of the number of tumor-specific IFNγ in log units. All other p values represent two-tailed t-tests. Data are from a representative experiment that was repeated with similar results.

References

    1. Platt FM, Hurst CD, Taylor CF, Gregory WM, Harnden P, Knowles MA. Spectrum of phosphatidylinositol 3-kinase pathway gene alterations in bladder cancer. Clin Cancer Res 2009;15(19):6008–17 doi 10.1158/1078-0432.CCR-09-0898. - DOI - PubMed
    1. Meeks JJ, Lerner SP. Molecular Landscape of Non-Muscle Invasive Bladder Cancer. Cancer Cell 2017;32(5):550–1 doi 10.1016/j.ccell.2017.08.015. - DOI - PubMed
    1. Liu ST, Hui G, Mathis C, Chamie K, Pantuck AJ, Drakaki A. The Current Status and Future Role of the Phosphoinositide 3 Kinase/AKT Signaling Pathway in Urothelial Cancer: An Old Pathway in the New Immunotherapy Era. Clin Genitourin Cancer 2018;16(2):e269–e76 doi 10.1016/j.clgc.2017.10.011. - DOI - PubMed
    1. Nickerson ML, Witte N, Im KM, Turan S, Owens C, Misner K, et al. Molecular analysis of urothelial cancer cell lines for modeling tumor biology and drug response. Oncogene 2017;36(1):35–46 doi 10.1038/onc.2016.172. - DOI - PMC - PubMed
    1. Bagrodia A, Krabbe LM, Gayed BA, Kapur P, Bernstein I, Xie XJ, et al. Evaluation of the prognostic significance of altered mammalian target of rapamycin pathway biomarkers in upper tract urothelial carcinoma. Urology 2014;84(5):1134–40 doi 10.1016/j.urology.2014.07.050. - DOI - PubMed

Publication types

MeSH terms