. 2018 Dec 19;7(12):96.
doi: 10.1038/s41389-018-0108-9.

Atypical GATA transcription factor TRPS1 represses gene expression by recruiting CHD4/NuRD(MTA2) and suppresses cell migration and invasion by repressing TP63 expression

Affiliations

Atypical GATA transcription factor TRPS1 represses gene expression by recruiting CHD4/NuRD(MTA2) and suppresses cell migration and invasion by repressing TP63 expression

Yuzhi Wang et al. Oncogenesis. .

Abstract

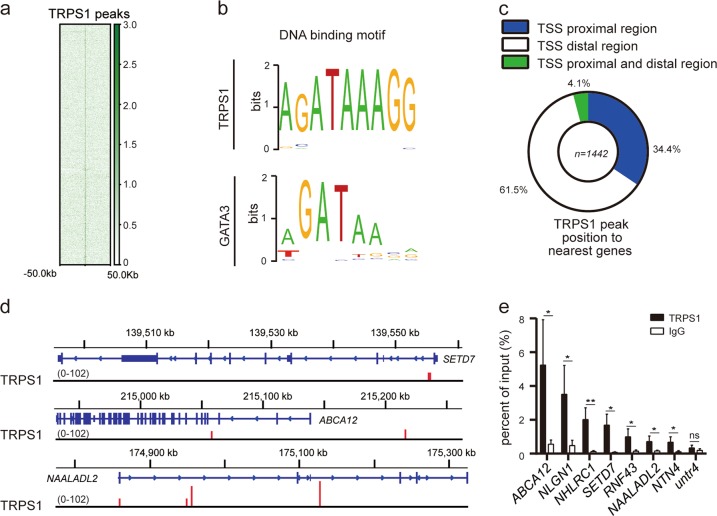
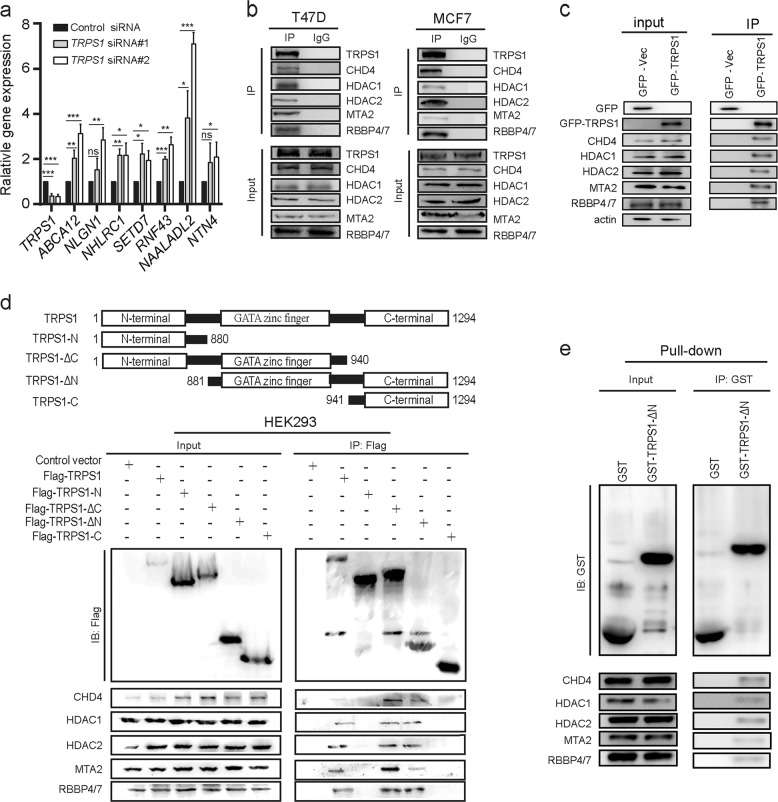
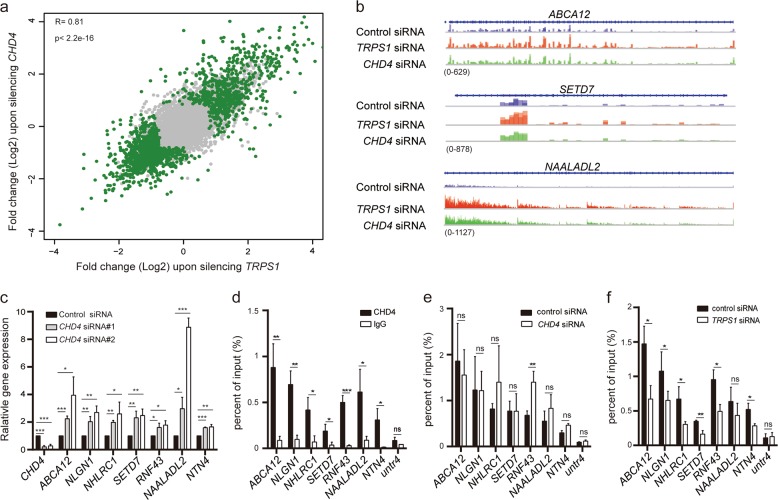
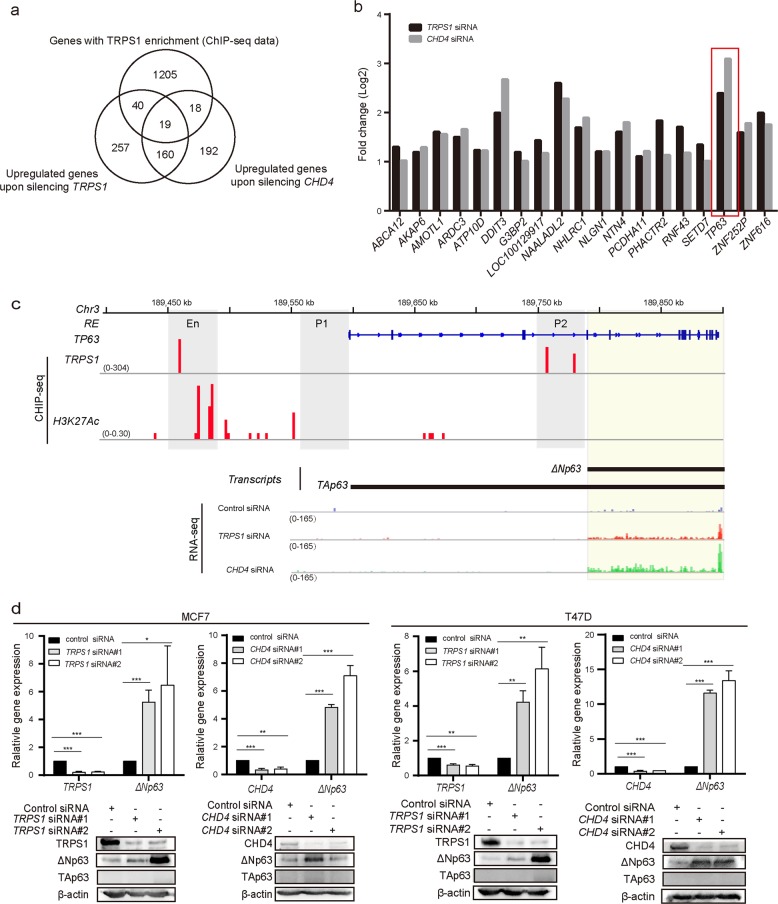
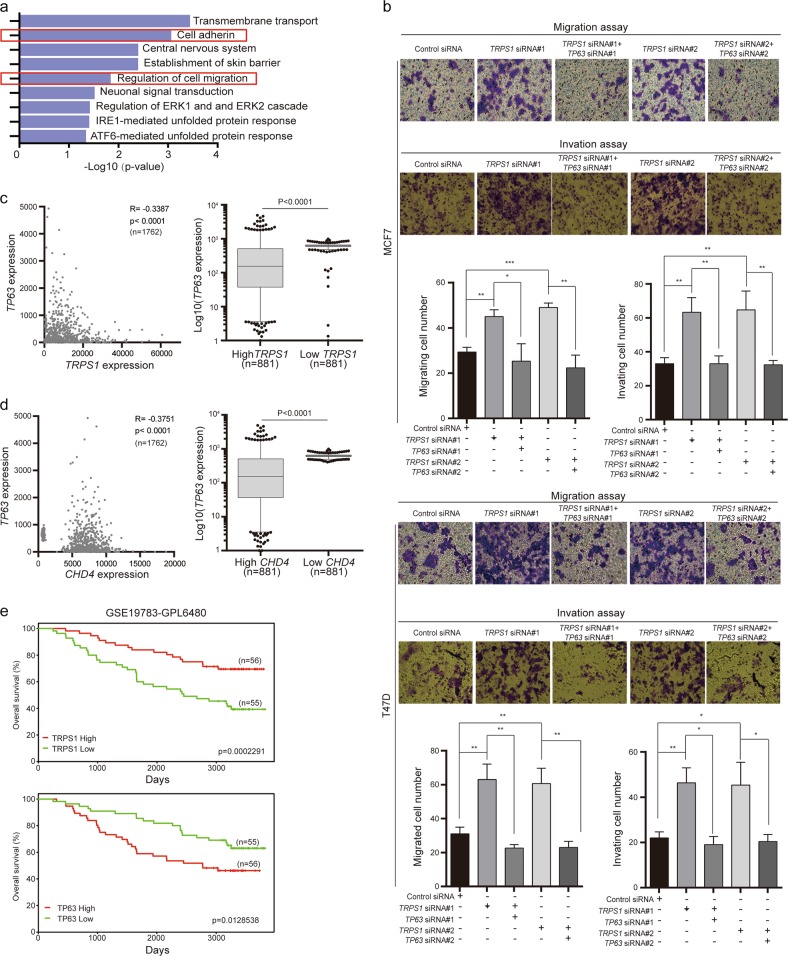
Transcriptional repressor GATA binding 1 (TRPS1), an atypical GATA transcription factor, functions as a transcriptional repressor and is also implicated in human cancers. However, the underlying mechanism of TRPS1 contributing to malignancy remains obscure. In the current study, we report that TRPS1 recognizes both gene proximal and distal transcription start site (TSS) sequences to repress gene expression. Co-IP mass spectrometry and biochemical studies showed that TRPS1 binds to CHD4/NuRD(MTA2). Genome-wide and molecular studies revealed that CHD4/NuRD(MTA2) is required for TRPS1 transcriptional repression. Mechanically, TRPS1 and CHD4/NuRD(MTA2) form precision-guided transcriptional repression machinery in which TRPS1 guides the machinery to specific target sites by recognizing GATA elements, and CHD4/NuRD(MTA2) represses the transcription of target genes. Furthermore, TP63 was identified and validated to be a direct target of TRPS1-CHD4/NuRD(MTA2) complex, which represses TP63 expression by involving decommission of TP63 enhancer in the described precision-guided manner, leading to a reduction of the ΔNp63 level and contributing to migration and invasion of cancer cells.


Conflict of interest statement

The authors declare that they have no conflict of interest.

Figures

Fig. 1
Fig. 1. Genome-wide transcription target analysis for TRPS1.
a ChIP-seq density map of TRPS1-binding sites. b TRPS1- and GATA3-binding motif analysis. GATA3 motif analysis was based on data from JASPAR MA0037.3. c Genomic distribution of TRPS1 determined by ChIP-seq analysis. d Genome browser track examples of the binding of TRPS1 on representative target genes, SETD7, ABCA12, and NAALADL2. e ChIP-qPCR analysis of TRPS1 candidate target genes: ABCA12, NLGN1, NHLRC1, SETD7, RNF43, NAALADL2, and NTN4. Untr4 is a well-characterized untranscribed genomic region and used as a comparative control. Each bar represents the mean ± SD for triplicate experiments. The t test was used for calculation of statistical significance. *p < 0.05, **p < 0.01
Fig. 2
Fig. 2. TRPS1 interacts with CHD4/NuRD(MTA2) complex.
a RT-qPCR validation of ABCA12, NLGN1, NHLRC1, SETD7, RNF43, NAALADL2, and NTN4 expression upon silencing TRPS1. t Test was used for calculation of statistical significance. *p < 0.05, **p < 0.01, ***p < 0.001. b TRPS1 interacts with major components of CHD4/NuRD(MTA2) complex: CHD4, HDAC1, HDAC2, MTA2, and RBBP4/7 in T47D and MCF7 cells. c Ectopically overexpressed TRPS1 in MDA-MB-231 cells interacts with major components of CHD4/NuRD(MTA2) complex: CHD4, HDAC1, HDAC2, MTA2, and RBBP4/7. d Co-IP analysis of the interaction between ectopically overexpressed Flag-tagged full-length TRPS1 or truncated TRPS1 proteins and major components of CHD4/NuRD(MTA2) complex: CHD4, HDAC1, HDAC2, MTA2, and RBBP4/7. The schematic diagram of TRPS1 truncates deciphered in the upper panel. e GST pull-down assays TRPS1-ΔN and whole-cell lysates of HEK293T cells
Fig. 3
Fig. 3. TRPS1 nucleates CHD4/NuRD(MTA2) complex to repress target gene expression.
a Scatter plots demonstrating the correlation between the transcriptional outputs mediated by TRPS1 and CHD4. Genes indicate significantly differentially expressed genes. Correlation coefficients were calculated using Pearson correlation coefficient and the p value was calculated using t test (p < 2.2e−16). b RNA-seq track examples of the selected genes, SETD7, ABCA12, and NAALADL2. c RT-qPCR validation of ABCA12, NLGN1, NHLRC1, SETD7, RNF43, NAALADL2, and NTN4 expression upon silencing CHD4. d ChIP-qPCR analysis of CHD4 enrichment on regulatory regions of ABCA12, NLGN1, NHLRC1, SETD7, RNF43, NAALADL2, and NTN4. e ChIP-qPCR analysis of TPRS1 enrichment on regulatory regions of ABCA12, NLGN1, NHLRC1, SETD7, RNF43, NAALADL2, and NTN4 upon silencing CHD4. f ChIP-qPCR analysis of CHD4 enrichment on regulatory regions of ABCA12, NLGN1, NHLRC1, SETD7, RNF43, NAALADL2, and NTN4 upon silencing TRPS1. Each bar represents the mean ± SD for triplicate experiments. t Test was used for statistical significance analysis. *p < 0.05, **p < 0.01, ***p < 0.001. df: Untr4 acts as a comparative control, and each bar represents the mean ± SD for triplicate experiments
Fig. 4
Fig. 4. TRPS1-CHD4/NuRD(MTA2) regulates ΔNp63 expression by targeting regulatory region of TP63.
a Venn diagram displays overlapping gene analysis of TRPS1 ChIP-seq-enriched genes and RNA-seq data of upregulated genes after the TRPS1and CHD4 knockdown. b Histogram of upregulated TRPS1 enrichment genes after TRPS1 and CHD4 knockdown. c ChIP-seq track of TRPS1 occupancy in the TP63 regulatory region and RNA-seq track of the TP63 gene expression. En, P1, and P2 indicate the enhancer, P1 promoter, and P2 promoter region of TP63, respectively. d ΔNp63 was upregulated at the mRNA and protein levels upon silencing TRPS1 or CHD4. Each bar represents the mean ± SD for triplicate experiments. t Test was used for statistical significance calculation. *p < 0.05, **p < 0.01, ***p < 0.001
Fig. 5
Fig. 5. TRPS1-CHD4/NuRD(MTA2) decommissions TP63 enhancer in the precision-guided manner.
a ChIP-qPCR confirmed enrichment of TRPS1 at TP63 enhancer. b ChIP-qPCR confirmed enrichment of CHD4 at TP63 enhancer. c Enrichment of CHD4 at TP63 enhancer was reduced upon silencing TRPS1 by ChIP-qPCR. d Enrichment of TRPS1 at TP63 enhancer was not affected upon silencing CHD4 by ChIP-qPCR. ad Each bar represents the mean ± SD for triplicate experiments. e TP63 enhancer luciferase assay with ectopic overexpression of TRPS1 in HEK293T cells. f TP63 enhancer luciferase assay with ectopic overexpression of TRPS1 and its truncates in HEK293T cells. g TP63 enhancer luciferase assay with or without silencing CHD4 in HEK293T cells with ectopic overexpression of TRPS1. eg: Each bar represents the mean ± SD for triplicate experiments. t Test was used for calculation of statistical significance. *p < 0.05, ***p < 0.001
Fig. 6
Fig. 6. TRPS1-CHD4/NuRD(MTA2)-ΔNp63 axis contributes to breast cancer cell motility and prognosis.
a Pathway enrichment analysis of TRPS1-targeted genes using DAVID. b Migration and invasion assay on T47D and MCF7 cells upon silencing TRPS1 with or without additional silencing of ΔNp63. Each bar represents the mean ± SD for triplicate experiments. t Test was used for calculation of statistical significance. *p < 0.05, **p < 0.01, ***p < 0.001. c The expression correlation between TRPS1 and TP63 using the expression data of 1762 breast cancers from GEO. d The expression correlation between CHD4 and TP63 using the expression data of 1762 breast cancers from GEO. c, d R stands for correlation and was calculated using GraphPad. t Test was used for calculation of statistical significance. e Prognostic value of TRPS1 and TP63 expression in breast cancers using PROGgene

References

    1. Malik TH, et al. Transcriptional repression and developmental functions of the atypical vertebrate GATA protein TRPS1. EMBO J. 2001;20:1715–1725. doi: 10.1093/emboj/20.7.1715. - DOI - PMC - PubMed
    1. Momeni P, et al. Mutations in a new gene, encoding a zinc-finger protein, cause tricho-rhino-phalangeal syndrome type I. Nat. Genet. 2000;24:71–74. doi: 10.1038/71717. - DOI - PubMed
    1. Li, Z. S. et al. Overexpression of Trps1 contributes to tumor angiogenesis and poor prognosis of human osteosarcoma. Diagn. Pathol. 10, 167 (2015). - PMC - PubMed
    1. Hong J, Sun J, Huang T. Increased expression of TRPS1 affects tumor progression and correlates with patients’ prognosis of colon cancer. Biomed. Res. Int. 2013;2013:454085. - PMC - PubMed
    1. Radvanyi L, et al. The gene associated with trichorhinophalangeal syndrome in humans is overexpressed in breast cancer. Proc. Natl. Acad. Sci. USA. 2005;102:11005–11010. doi: 10.1073/pnas.0500904102. - DOI - PMC - PubMed