. 2018 Dec 4:9:2864.
doi: 10.3389/fimmu.2018.02864. eCollection 2018.

TCR and CD28 Concomitant Stimulation Elicits a Distinctive Calcium Response in Naive T Cells

Affiliations

TCR and CD28 Concomitant Stimulation Elicits a Distinctive Calcium Response in Naive T Cells

Fan Xia et al. Front Immunol. .

Abstract

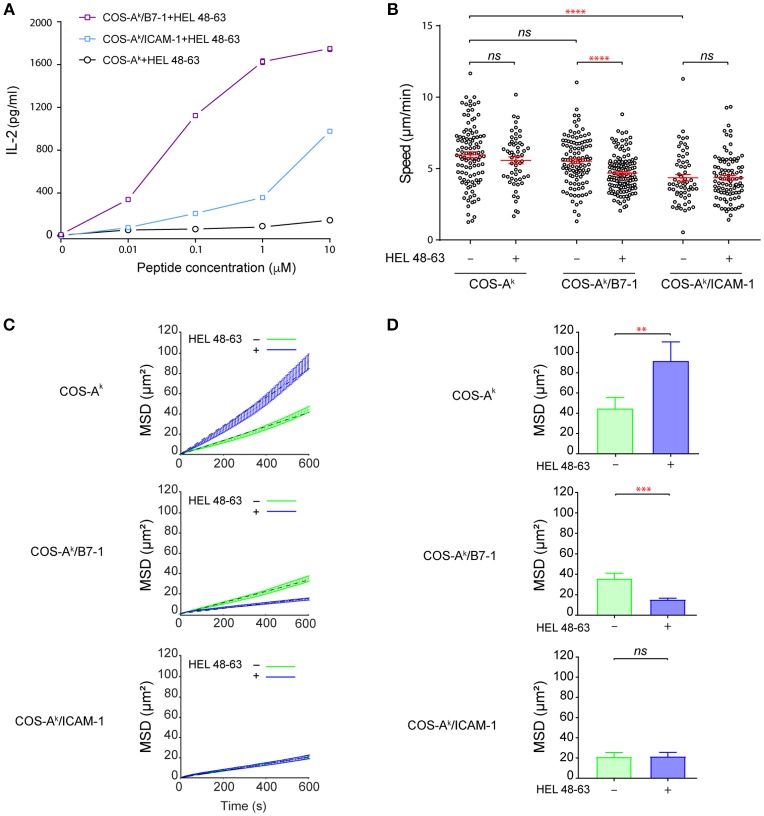
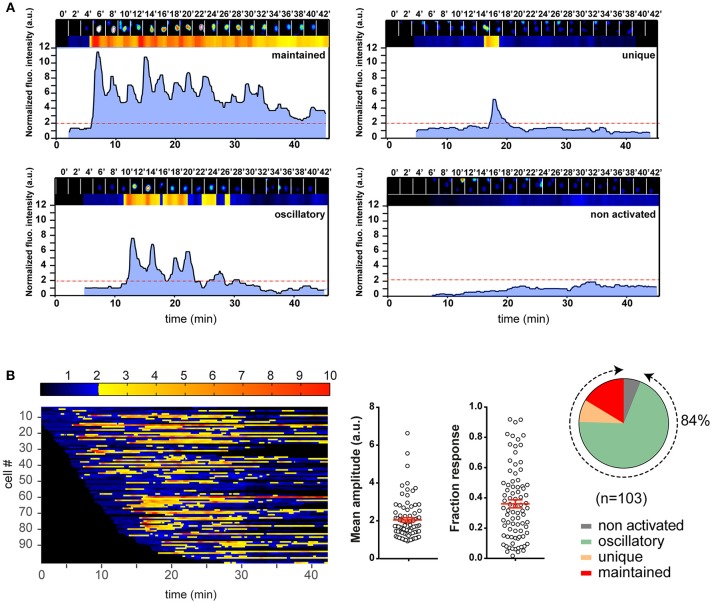
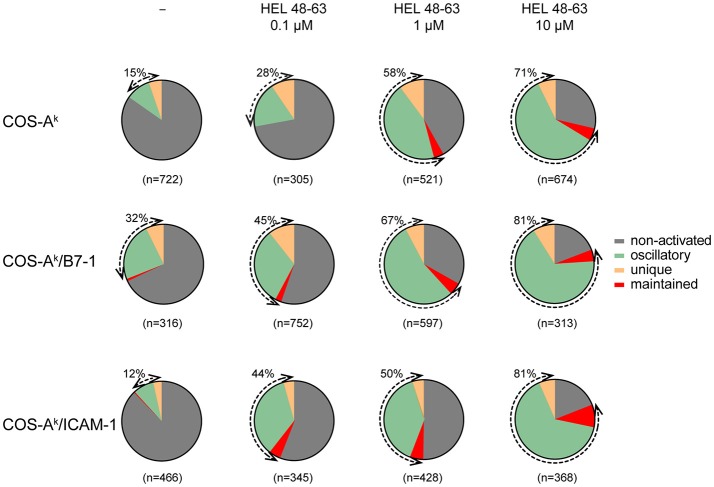
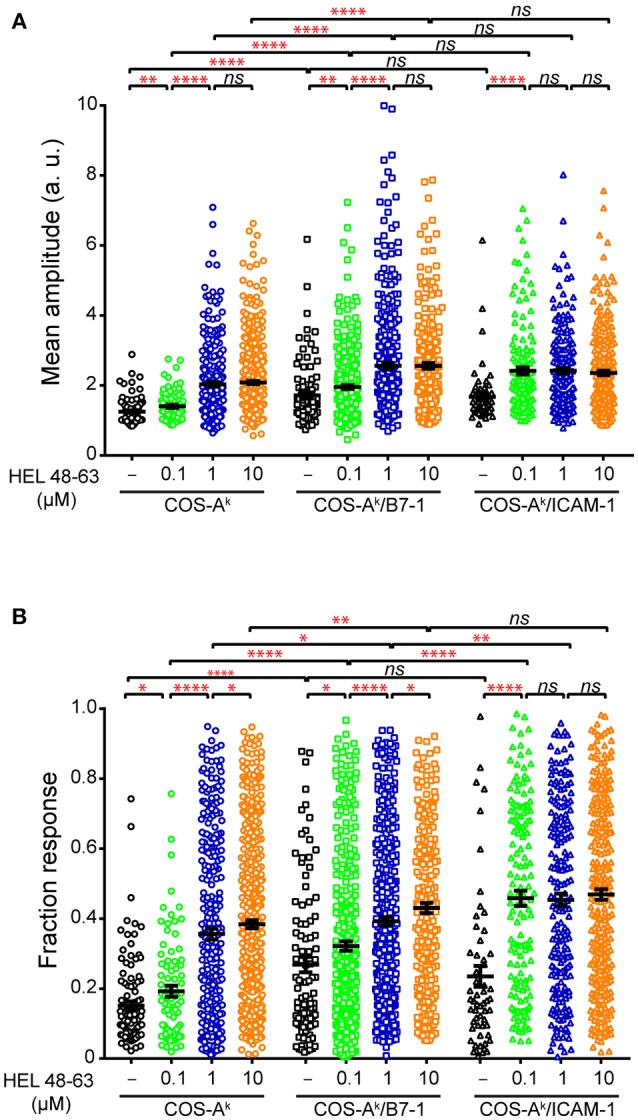
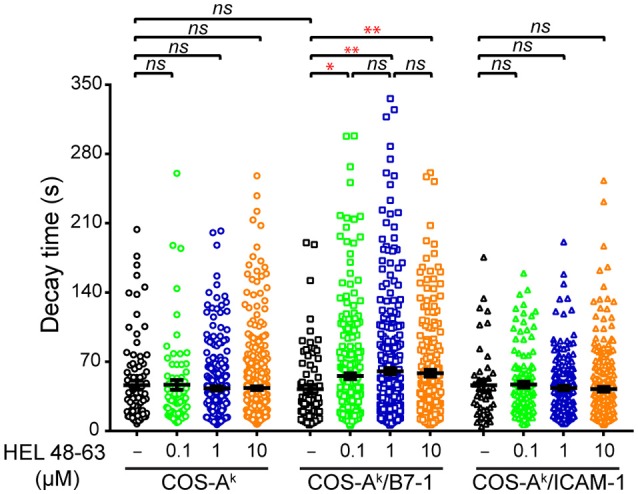
T cell activation is initiated upon ligand engagement of the T cell receptor (TCR) and costimulatory receptors. The CD28 molecule acts as a major costimulatory receptor in promoting full activation of naive T cells. However, despite extensive studies, why naive T cell activation requires concurrent stimulation of both the TCR and costimulatory receptors remains poorly understood. Here, we explore this issue by analyzing calcium response as a key early signaling event to elicit T cell activation. Experiments using mouse naive CD4+ T cells showed that engagement of the TCR or CD28 with the respective cognate ligand was able to trigger a rise in fluctuating calcium mobilization levels, as shown by the frequency and average response magnitude of the reacting cells compared with basal levels occurred in unstimulated cells. The engagement of both TCR and CD28 enabled a further increase of these two metrics. However, such increases did not sufficiently explain the importance of the CD28 pathways to the functionally relevant calcium responses in T cell activation. Through the autocorrelation analysis of calcium time series data, we found that combined but not separate TCR and CD28 stimulation significantly prolonged the average decay time (τ) of the calcium signal amplitudes determined with the autocorrelation function, compared with its value in unstimulated cells. This increasement of decay time (τ) uniquely characterizes the fluctuating calcium response triggered by concurrent stimulation of TCR and CD28, as it could not be achieved with either stronger TCR stimuli or by co-engaging both TCR and LFA-1, and likely represents an important feature of competent early signaling to provoke efficient T cell activation. Our work has thus provided new insights into the interplay between the TCR and CD28 early signaling pathways critical to trigger naive T cell activation.

Keywords: CD28; T cell activation; TCR–T cell receptor; calcium signaling; co-stimulation; naive T cells.


Figures

Figure 1
Figure 1
B7-1 expression on COS APCs provides efficient costimulatory signaling to naive CD4+ T cells. (A) Activation of naive CD4+ T cells upon contact with COS APCs loaded with HEL 48–63 peptides. 5 × 10⁵ naive CD4+ T cells from 3A9 TCRtg mice were cultured at 37°C with COS-Ak, COS-Ak/B7-1, COS-Ak/ICAM-1 cells, loaded or not with different doses of HEL 48–63. T cells were harvested after 20 h. IL-2 concentration in the supernatants was measured by ELISA. Data represented the mean of three individual experiments. Data: mean ± s.d. (B) Naive CD4+ T cells form mobile contacts with COS APCs loaded or not with HEL 48–63. Naive CD4+ T cells from 3A9 TCRtg mice were loaded onto APCs monolayers of COS-Ak, COS-Ak/B7-1, COS-Ak/ICAM-1 cells grown to confluency on Lab-Tek chamber slide, loaded or not with 1 μM HEL 48–63. T cell trajectories were recorded for 45 min at 37°C using confocal video-microscope. Average migration speed over the whole trajectory was calculated as described in Materials and Methods. Data: mean ± SEM. Their numerical values were 5.96 ± 0.21 μm/min (n = 105), 5.57 ± 0.24 μm/min (n = 56), 5.59 ± 0.18 μm/min (n = 111), 4.68 ± 0.11 μm/min (n = 134), 4.36 ± 0.23 μm/min (n = 60), and 4.36 ± 0.17 μm/min (n = 93) for the T cells contacting with COS-Ak, COS-Ak plus HEL 48–63, COS-Ak/B7-1, and COS-Ak/B7-1 plus HEL 48–63, COS-Ak/ICAM-1, and COS-Ak/ICAM-1 plus HEL 48–63, respectively. (C) Mean square displacement over time and (D) average mean square displacement over 10 min of T cells seeded onto COS-Ak, COS-Ak/B7-1, and COS-Ak/ICAM-1 cells, loaded or not with 1 μM HEL 48–63, respectively. Mann–Whitney tests were performed using Graphpad prism 7.0 for comparisons between two groups. Statistical significance was set at 0.05, and p-values < 0.05 were denoted in red. **p < 0.01, ***p < 0.001, and ****p < 0.0001.
Figure 2
Figure 2
Illustration of the T cell calcium response analysis with an example experiment. Naive 3A9 TCRtg CD4+ T cells were loaded with Fluo-4 PBX before incubation at 37°C for 45 min with COS-Ak pulsed with 10 μM HEL 48–63. Time-lapse movies of T cells were made using confocal microscope as described in Materials and Methods. (A) Single cell fluorescence recordings analyzed by MAAACS and categorized into different classes according to the magnitude and shape of fluorescence signals. The examples of four different response types are shown. In each panel, the top row is made up of 2 min-delayed snapshots of raw images of a cell. Just below are the normalized fluorescence intensities displayed in the form of a bar code and a line profile, respectively. The non-activated cells are defined as cells whose normalized fluorescence intensities have never reached the activation threshold (set at 2.0, red dotted line, see Methods and Materials for more details) along the whole trace. For the activated cells, we defined a response as “maintained” when the response fraction (RF) was higher than 0.8, and “unique” when the response fraction was lower than 0.2 with a single burst. In all other situations, calcium responses were “oscillatory.” (B) Color barcoding and calculation of the analytical parameters of the calcium response. The normalized fluorescence amplitude of each cell is plotted along a horizontal line as a function of time with a color-coded intensity (dark to blue below the threshold of activation and yellow to red above the threshold of activation). The analytical parameters of the calcium response, i.e., the mean amplitude (MA) and RF calculated by MAAACS are plotted (mean ± SEM). The global overview of the cell response heterogeneity is summarized in the form of a pie chart.
Figure 3
Figure 3
Naive CD4+ T cells show various calcium response modes upon different stimulation. Naive 3A9 TCRtg CD4+ T cells were loaded with Fluo-4 PBX before incubation at 37°C for 45 min with COS APC cells pulsed without or with different doses of HEL 48–63 as indicated. Time-lapse movies of T cells were made by confocal microscope as described in Materials and Methods. For each antigenic peptide concentration, modes of calcium response are represented as a pie chart: non-activated in gray, maintained in red, oscillatory in green, and unique in yellow. The total number of cells analyzed is indicated in parentheses. The percentage of activated (reacting) cells is shown by the double arrows, and their values are indicated.
Figure 4
Figure 4
Comparisons of analytical parameters of the calcium response in naive CD4+ T cells upon different stimulation. Naive 3A9 TCRtg CD4+ T cells stained with Fluo-4 PBX were loaded onto COS APC monolayers at 37°C and observed for 45 min. COS-Ak, COS-Ak/B7-1, COS-Ak/ICAM-1 APCs were loaded or not with 0.1, 1, and 10 μM HEL 48–63. Average mean amplitude (A) and responding fraction (B) were calculated as described in Materials and Methods. Data: mean ± SEM. Mann–Whitney tests were performed using Graphpad prism 7.0 for comparisons between two groups. Statistical significance was set at 0.05, and p-values < 0.05 were denoted in red. *p < 0.05, **p < 0.01, and ****p < 0.0001.
Figure 5
Figure 5
Comparisons of decay time (τ) of calcium response in naive CD4+ T cells upon different stimulation. Naive 3A9 TCRtg CD4+ T cells stained with Fluo-4 PBX were loaded onto COS APC monolayers at 37°C and observed for 45 min. APC cells were loaded or not with 0.1, 1, and 10 μM HEL 48–63. Analysis of average decay time (τ) was performed as described in Materials and Methods. Data: mean ± SEM. Mann–Whitney tests were performed using Graphpad prism 7.0 for comparisons between two groups. Statistical significance was set at 0.05, and p-values < 0.05 were denoted in red. *p < 0.05 and **p < 0.01.

References

    1. Smith-Garvin JE, Koretzky GA, Jordan MS. T cell activation. Annu Rev Immunol. (2009) 27:591–619. 10.1146/annurev.immunol.021908.132706 - DOI - PMC - PubMed
    1. Acuto O, Michel F. CD28-mediated co-stimulation: a quantitative support for TCR signalling. Nat Rev Immunol. (2003) 3:939–51. 10.1038/nri1248 - DOI - PubMed
    1. Boomer JS, Green JM. An enigmatic tail of CD28 signaling. Cold Spring Harb Perspect Biol. (2010) 2:a002436. 10.1101/cshperspect.a002436 - DOI - PMC - PubMed
    1. Michel F, Attal-Bonnefoy G, Mangino G, Mise-Omata S, Acuto O. CD28 as a molecular amplifier extending TCR ligation and signaling capabilities. Immunity (2001) 15:935–45. 10.1016/S1074-7613(01)00244-8 - DOI - PubMed
    1. Cai Z, Kishimoto H, Brunmark A, Jackson MR, Peterson PA, Sprent J. Requirements for peptide-induced T cell receptor downregulation on naive CD8+ T cells. J Exp Med. (1997) 185:641–51. - PMC - PubMed

Publication types

MeSH terms

Substances