. 2018 Dec 10:1:224.
doi: 10.1038/s42003-018-0232-2. eCollection 2018.

FRET biosensor allows spatio-temporal observation of shear stress-induced polar RhoGDIα activation

Affiliations

FRET biosensor allows spatio-temporal observation of shear stress-induced polar RhoGDIα activation

Shuai Shao et al. Commun Biol. .

Abstract

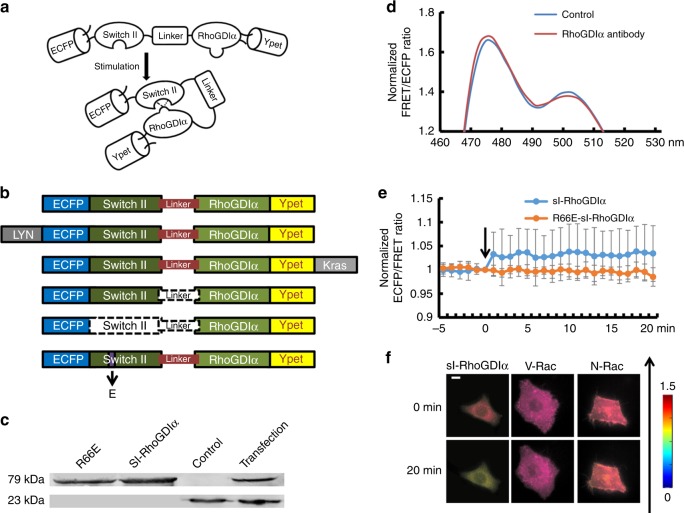
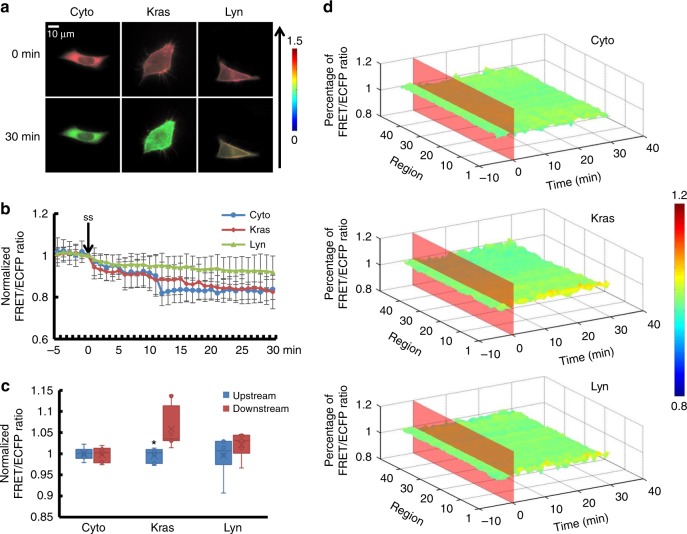
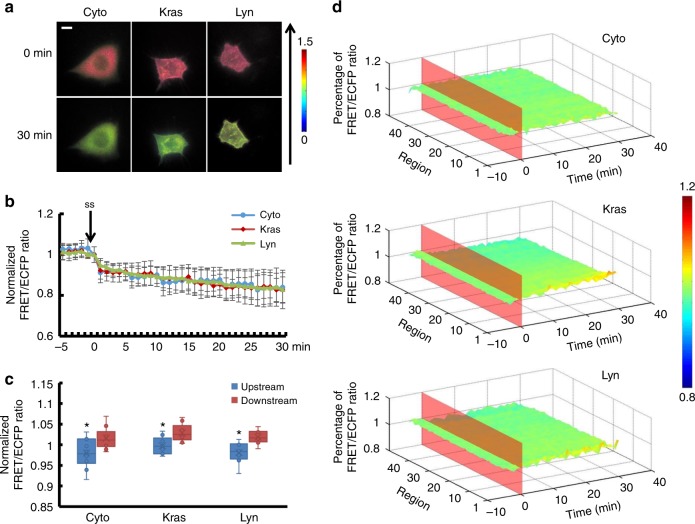
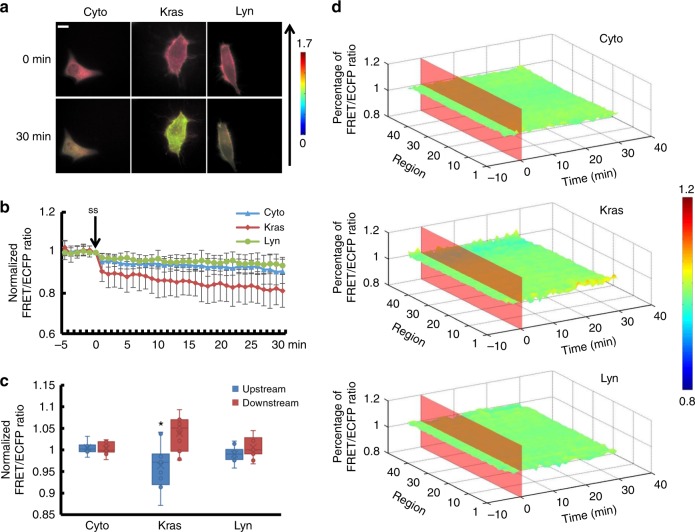
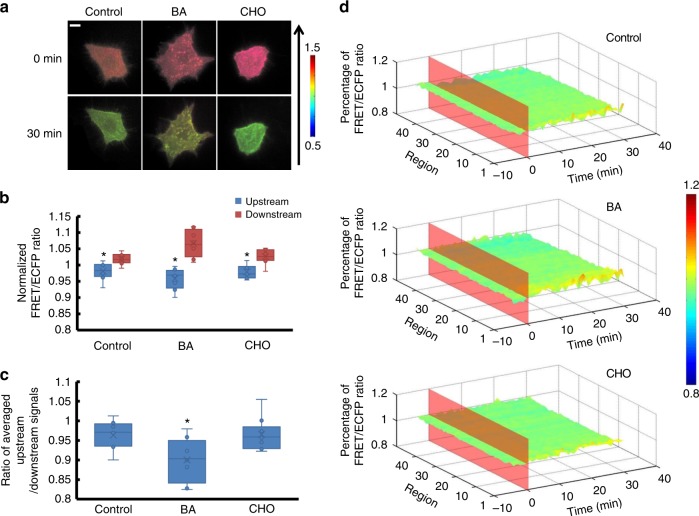
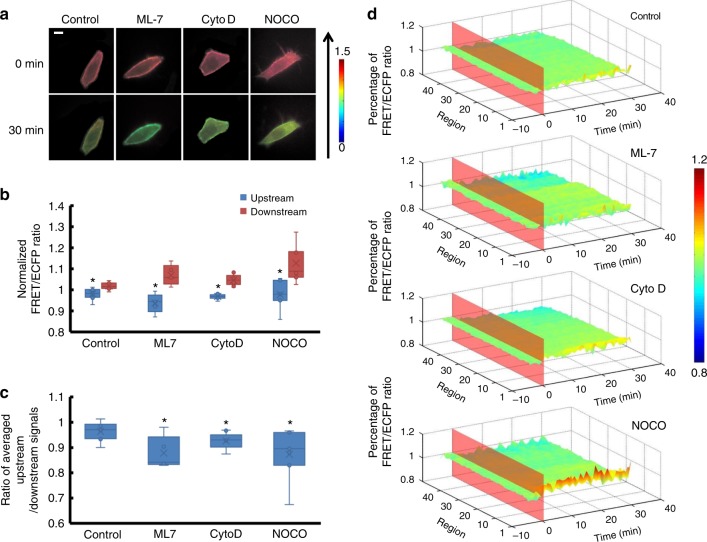
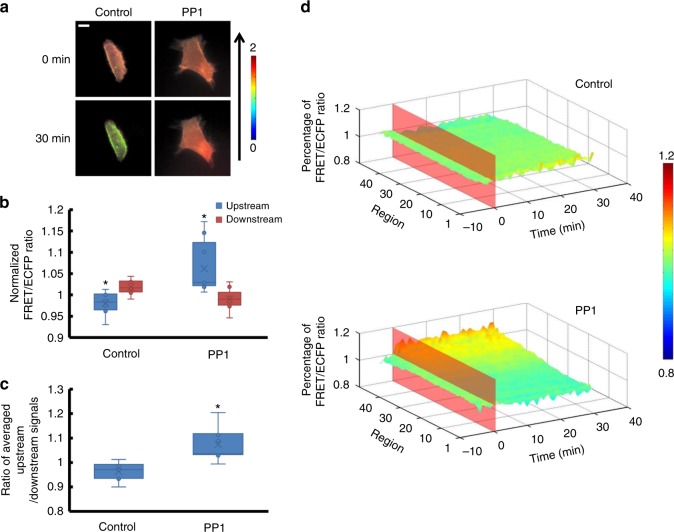
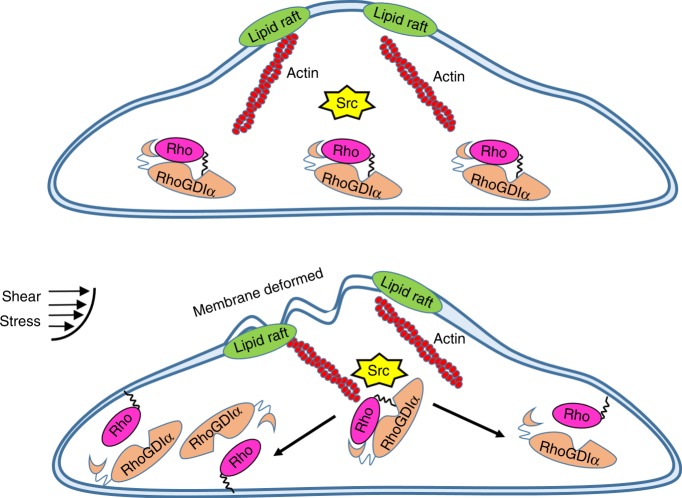
Rho GDP-dissociation inhibitor α (RhoGDIα) is a known negative regulator of the Rho family that shuts off GDP/GTP cycling and cytoplasm/membrane translocation to regulate cell migration. However, to our knowledge, no reports are available that focus on how the RhoGDIα-Rho GTPases complex is activated by laminar flow through exploring the activation of RhoGDIα itself. Here, we constructed a new biosensor using fluorescence resonance energy transfer (FRET) technology to measure the spatio-temporal activation of RhoGDIα in its binding with Rho GTPases in living HeLa cells. Using this biosensor, we find that the dissociation of the RhoGDIα-Rho GTPases complex is increased by shear stress, and its dissociation rate varies with subcellular location. Moreover, this process is mediated by membrane fluidity, cytoskeleton and Src activity, which indicates that the regulation of RhoGDIα activation under shear stress application represents a relatively separate pathway from the shear stress-induced Rho pathway.


Conflict of interest statement

The authors declare no competing interests.

Figures

Fig. 1
Fig. 1
The verification experiments of sl-RhoGDIα biosensor. a The diagram of sl-RhoGDIα biosensor. b The structure of sl-RhoGDIα and derived biosensors. Dotted line means these parts do not exist in biosensor structure. c Western blot results at 23 and 79 kDa. From left to right is shown the purified R66E-sl-RhoGDIα protein, sl-RhoGDIα protein, and the disruption product of cells from the control group without transfection and transfected with sl-RhoGDIα biosensor. d The emission spectrum of sl-RhoGDIα biosensor before and after RhoGDIα antibody stimulation. e The FRET efficiency time series of sl-RhoGDIα and R66E-sl-RhoGDIα biosensor with stimulation of RhoGDIα antibody. f The living cell images of sl-RhoGDIα (n = 11), V-Rac and sl-RhoGDIα (n = 8), N-Rac and sl-RhoGDIα (n = 7) upon shear stress. The direction of shear stress is from bottom to up as shown by the arrow. The scale bar is 10 μm
Fig. 2
Fig. 2
The affinity of RhoGDIα and Rho GTPases at different subcellular locations under 5 dyn cm−2 of shear stress. a Living cell images of three biosensors under 5 dyn cm−2 of shear stress. Cyto represents the biosensor sl-RhoGDIα (n = 6), which exists in the cytoplasm. Kras represents Kras-sl-RhoGDIα (n = 8) and Lyn represents Lyn-sl-RhoGDIα (n = 6). The arrow shows the direction of shear stress. The scale bar is 10 μm. b Effect of shear stress on the binding degree of RhoGDIα and Rho. c The FRET/ECFP ratio comparison of upstream to downstream, after normalization. The asterisk denotes that there is an obvious difference between upstream and downstream. d The binding degree distribution of RhoGDIα and Rho. The FRET ratio percentage of each region overall is normalized before shear stress application. The dissociation of the RhoGDIα-Rho complex is inhibited downstream along the flow direction
Fig. 3
Fig. 3
The affinity of RhoGDIα and Rho GTPases at different subcellular locations under 20 dyn cm−2 of shear stress. a Living cell images of three biosensors under 20 dyn cm−2 of shear stress. Biosensors are indicated as in Fig. 2, Cyto (n = 10), Kras (n = 9) and Lyn (n = 8). The arrow shows the direction of shear stress. The scale bar is 10 μm. b Binding degree of RhoGDIα and Rho as a function of shear stress. c The FRET/ECFP ratio comparison of upstream to downstream, after normalization. The asterisk denotes that there is an obvious difference between upstream and downstream. d The binding degree distribution of RhoGDIα and Rho. The FRET ratio percentage of each region overall is normalized before shear stress application. The dissociation of RhoGDIα-Rho GTPases complex is inhibited downstream along the flow direction
Fig. 4
Fig. 4
The affinity of RhoGDIα and Rho GTPases at different subcellular locations under 40 dyn cm−2 of shear stress. a Living cell images of three biosensors under 40 dyn cm−2 of shear stress. Biosensors labeled as in Fig. 2, Cyto (n = 11), Kras (n = 11) and Lyn (n = 11). The arrow shows the direction of shear stress. The scale bar is 10 μm. b Binding degree of RhoGDIα and Rho as a function of shear stress. c The FRET/ECFP ratio comparison of upstream to downstream, after normalization. The asterisk denotes that there is an obvious difference between upstream and downstream. d The binding degree distribution of RhoGDIα and Rho. The FRET ratio percentage of each region overall is normalized before shear stress application. The dissociation of RhoGDIα-Rho GTPases complex is inhibited at downstream along the flow direction
Fig. 5
Fig. 5
The affinity of RhoGDIα and Rho GTPases under shear stress is affected by membrane fluidity. a Living cell images of Lyn-sl-RhoGDIα biosensor under 20 dyn cm−2 of shear stress with 45 mmol per L benzol alcohol (BA, n = 8) or 0.1 mmol per L of cholesterol (CHO, n = 10). The scale bar is 10 μm. b The FRET/ECFP ratio comparison of upstream to downstream, after normalization. c The ratio of averaged upstream/downstream for the control group and the BA/CHO group. The asterisk denotes that there is an obvious difference between upstream and downstream. d The binding degree distribution of RhoGDIα and Rho GTPases when membrane fluidity is changed. The FRET ratio percentage of each region overall is normalized before shear stress application. The dissociation of the RhoGDIα-Rho GTPases complex is inhibited more downstream along the flow direction when membrane fluidity is enhanced by BA. The asterisk denotes that there is an obvious difference compared to control group
Fig. 6
Fig. 6
The affinity of RhoGDIα and Rho GTPases under shear stress is affected by cytoskeleton. a The living cell images of Lyn-sl-RhoGDIα biosensor under 20 dyn cm−2 of shear stress treated with 5 μmol/l of ML-7(n = 5), 2 μmol per L of Cytochalasin D (CytoD, n = 9), or 1 μmol per L of nocodazole (NOCO, n = 7). The scale bar is 10 μm. b The FRET/ECFP ratio comparison of upstream to downstream after normalization. c The averaged upstream/downstream ratio in the control group and in BA/CHO groups. The asterisk denotes that there is an obvious difference between upstream and downstream. d The binding degree distribution of RhoGDIα and Rho GTPases is enhanced downstream along the flow direction when cytoskeleton is disturbed. The FRET ratio percentage of each region overall is normalized before shear stress application. The asterisk denotes that there is an obvious difference compared to the control group
Fig. 7
Fig. 7
The affinity of RhoGDIα and Rho GTPases under shear stress is affected by Src. a Living cell images of Lyn-sl-RhoGDIα biosensor under 20 dyn cm−2 of shear stress with 50 mmol per L of the Src inhibitor PP1(n = 7). The scale bar is 10 μm. b The FRET/ECFP ratio comparison of upstream to downstream, after normalization. c Averaged upstream/downstream ratio for the control group and the PP1 group. The asterisk denotes that there is an obvious difference between upstream and downstream. d Binding degree distribution of RhoGDIα and Rho GTPases is enhanced at upstream regions along the flow direction when Src is inhibited. The FRET ratio percentage of each region overall is normalized before shear stress application. The asterisk denotes that there is an obvious difference compared to the control group
Fig. 8
Fig. 8
The proposed mechanism of shear stress induced-RhoGDIα activation

References

    1. Lintz Marianne, Muñoz Adam, Reinhart-King Cynthia A. The Mechanics of Single Cell and Collective Migration of Tumor Cells. Journal of Biomechanical Engineering. 2017;139(2):021005. doi: 10.1115/1.4035121. - DOI - PMC - PubMed
    1. Mazel Tomáš. Crosstalk of cell polarity signaling pathways. Protoplasma. 2017;254(3):1241–1258. doi: 10.1007/s00709-017-1075-2. - DOI - PubMed
    1. Narayanan AS, Reyes SB, Um K, McCarty JH, Tolias KF. The Rac-GAP Bcr is a novel regulator of the Par complex that controls cell polarity. Mol. Biol. Cell. 2013;24:3857–3868. doi: 10.1091/mbc.e13-06-0333. - DOI - PMC - PubMed
    1. Moissoglu K, Schwartz MA. Spatial and temporal control of Rho GTPase functions. Cell. Logist. 2014;4:e943618. doi: 10.4161/21592780.2014.943618. - DOI - PMC - PubMed
    1. Ueyama T, et al. Negative charges in the flexible N-terminal domain of Rho GDP-dissociation inhibitors (RhoGDIs) regulate the targeting of the RhoGDI-Rac1 complex to membranes. J. Immunol. 2013;191:2560–2569. doi: 10.4049/jimmunol.1300209. - DOI - PubMed