

Do Neighborhoods Matter? A Systematic Review of Modifiable Risk Factors for Obesity among Low Socio-Economic Status Black and Hispanic Children
- PMID: 30565954
- PMCID: PMC6386088
- DOI: 10.1089/chi.2018.0044
Do Neighborhoods Matter? A Systematic Review of Modifiable Risk Factors for Obesity among Low Socio-Economic Status Black and Hispanic Children
Abstract
Background: Childhood obesity increases the risk of obesity and harmful comorbidities later in life. It is influenced by characteristics of a child's neighborhood, particularly among underserved groups. Our objective was to systematically review the evidence relating neighborhood environment and obesity risk among urban, low socioeconomic status (SES) Black and Hispanic children.
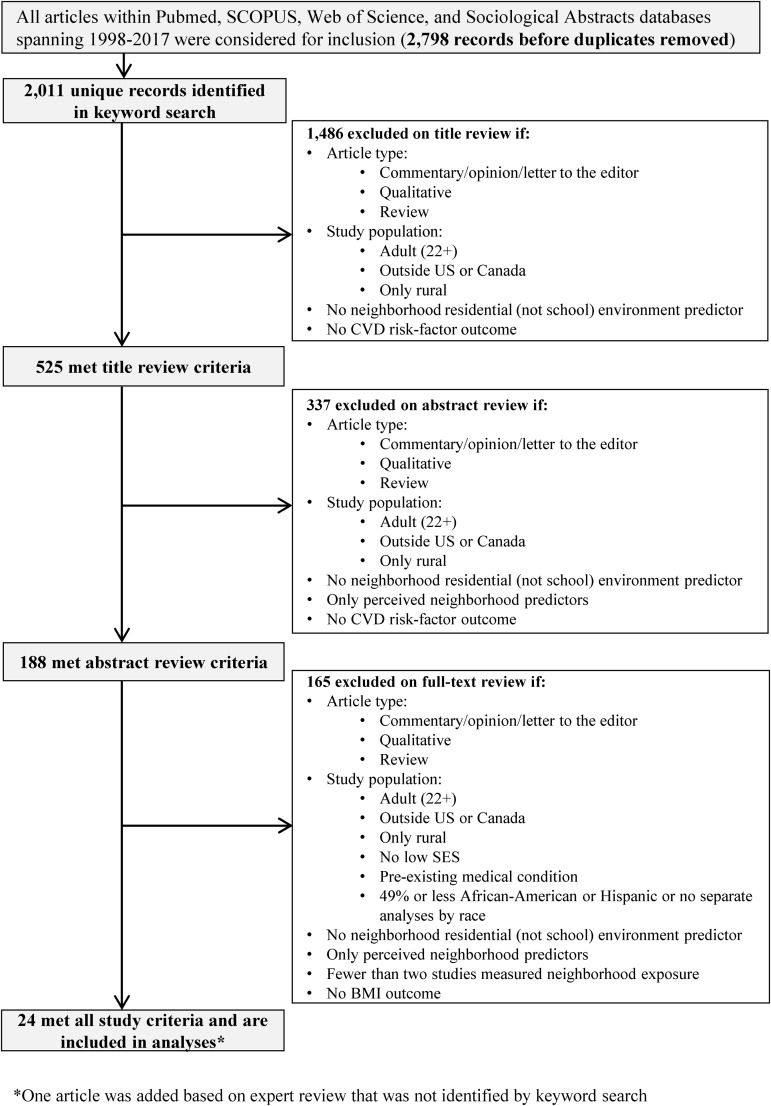
Methods: We included studies published from 1993 through early 2017 from PubMed, SCOPUS, Web of Science, and Sociological Abstracts databases investigating relationships between empirically measured neighborhood characteristics and obesity risk factors in the populations of interest. Databases were last searched on May 8, 2018. Initial analysis took place during 2014 and was completed during 2017. We extracted data on study population, design, and associations between neighborhood characteristics and obesity risk factors.
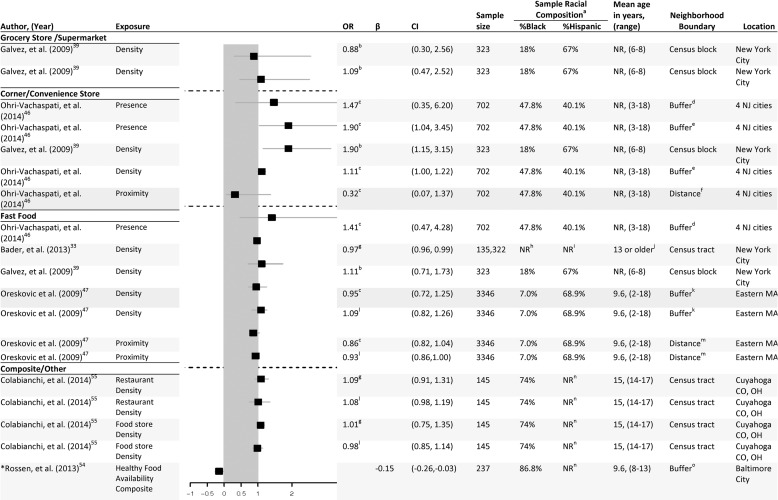
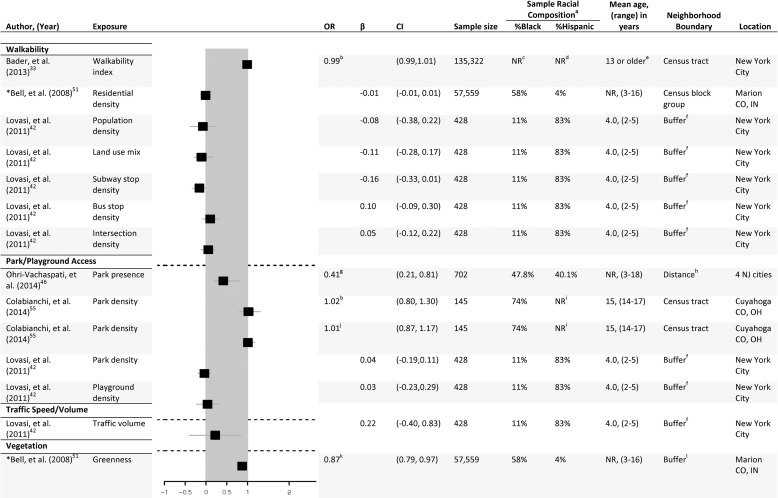
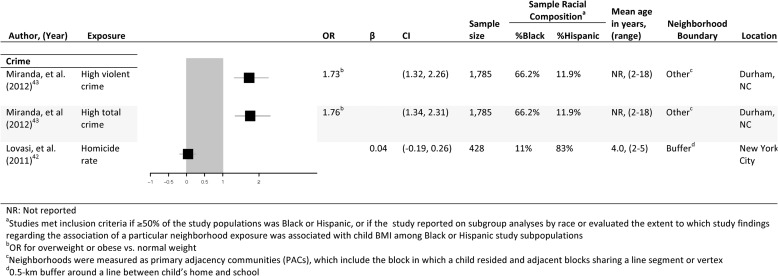
Results: We identified 2011 unique studies; 24 were included. Few studies demonstrated consistent patterns of association. Most neighborhood characteristics were not examined across multiple studies. BMI may be related to living in a lower-income neighborhood or convenience store access.
Conclusions: This review found that the body of evidence relating neighborhood exposures and obesity risk factors among urban, low SES Black (also commonly referred to in the literature as "non-Hispanic Black" or African American) and Hispanic children is limited. Given the high risk of obesity and cardiovascular disease among these populations throughout the life course, research on neighborhood determinants of obesity should specifically include these populations, ensuring adequate power and methodological rigor to detect differences.
Keywords: African American; Hispanic; childhood obesity; neighborhood; social determinants of health.
Conflict of interest statement
No competing financial interests exist.
Figures
Similar articles
-
Low-Income Black and Hispanic Children's Neighborhood Food Environments and Weight Trajectories in Early Childhood.Acad Pediatr. 2020 Aug;20(6):784-792. doi: 10.1016/j.acap.2019.11.013. Epub 2019 Nov 26. Acad Pediatr. 2020. PMID: 31783182 Free PMC article.
-
Neighborhood context and racial/ethnic differences in young children's obesity: structural barriers to interventions.Soc Sci Med. 2013 Oct;95:97-105. doi: 10.1016/j.socscimed.2012.09.032. Epub 2012 Oct 6. Soc Sci Med. 2013. PMID: 23089614
-
Living in High-SES Neighborhoods Is Protective against Obesity among Higher-Income Children but Not Low-Income Children: Results from the Healthy Communities Study.J Urban Health. 2020 Apr;97(2):175-190. doi: 10.1007/s11524-020-00427-9. J Urban Health. 2020. PMID: 32107723 Free PMC article.
-
Food environment near schools and body weight-A systematic review of associations by race/ethnicity, gender, grade, and socio-economic factors.Obes Rev. 2020 Apr;21(4):e12997. doi: 10.1111/obr.12997. Epub 2020 Feb 5. Obes Rev. 2020. PMID: 32026567 Free PMC article.
-
Trends in obesity prevalence and disparities among low-income children in Oklahoma, 2005-2010.Child Obes. 2014 Aug;10(4):318-25. doi: 10.1089/chi.2014.0022. Epub 2014 Jul 14. Child Obes. 2014. PMID: 25019336 Review.
Cited by
-
A Review of the Public Health Literature Examining the Roles of Socioeconomic Status and Race/Ethnicity on Health Outcomes in the United States.J Racial Ethn Health Disparities. 2024 Oct 28. doi: 10.1007/s40615-024-02195-7. Online ahead of print. J Racial Ethn Health Disparities. 2024. PMID: 39468002 Review.
-
Social determinants of health of racial and ethnic minority adolescents: An integrative literature review.Heliyon. 2023 Oct 19;9(10):e20738. doi: 10.1016/j.heliyon.2023.e20738. eCollection 2023 Oct. Heliyon. 2023. PMID: 37916096 Free PMC article. Review.
-
Associations Between Boys' Early Childhood Exposure to Family and Neighborhood Poverty and Body Mass Index in Early Adolescence.J Pediatr Psychol. 2019 Oct 1;44(9):1009-1018. doi: 10.1093/jpepsy/jsz047. J Pediatr Psychol. 2019. PMID: 31233133 Free PMC article.
-
Neighborhood selection by parent personality, depression, and coparent support: A two-study replication.J Fam Psychol. 2024 Aug;38(5):721-731. doi: 10.1037/fam0001182. Epub 2023 Dec 7. J Fam Psychol. 2024. PMID: 38059970 Free PMC article.
-
Association between rs4994 variant in β3-Adrenergic receptor and obesity in Vietnamese preschool-age children, independent of eating behaviors.BMC Pediatr. 2024 Sep 18;24(1):594. doi: 10.1186/s12887-024-05073-7. BMC Pediatr. 2024. PMID: 39294633 Free PMC article.
References
-
- US Preventive Services Task Force. Screening for obesity in children and adolescents: US preventive services task force recommendation statement. JAMA 2017;317:2417–2426 - PubMed
Publication types
MeSH terms
Grants and funding
LinkOut - more resources
Full Text Sources
Medical
