. 2018 Dec 18;25(12):3356-3370.e4.
doi: 10.1016/j.celrep.2018.11.073.

Selective Export into Extracellular Vesicles and Function of tRNA Fragments during T Cell Activation

Affiliations

Selective Export into Extracellular Vesicles and Function of tRNA Fragments during T Cell Activation

Ni-Ting Chiou et al. Cell Rep. .

Abstract

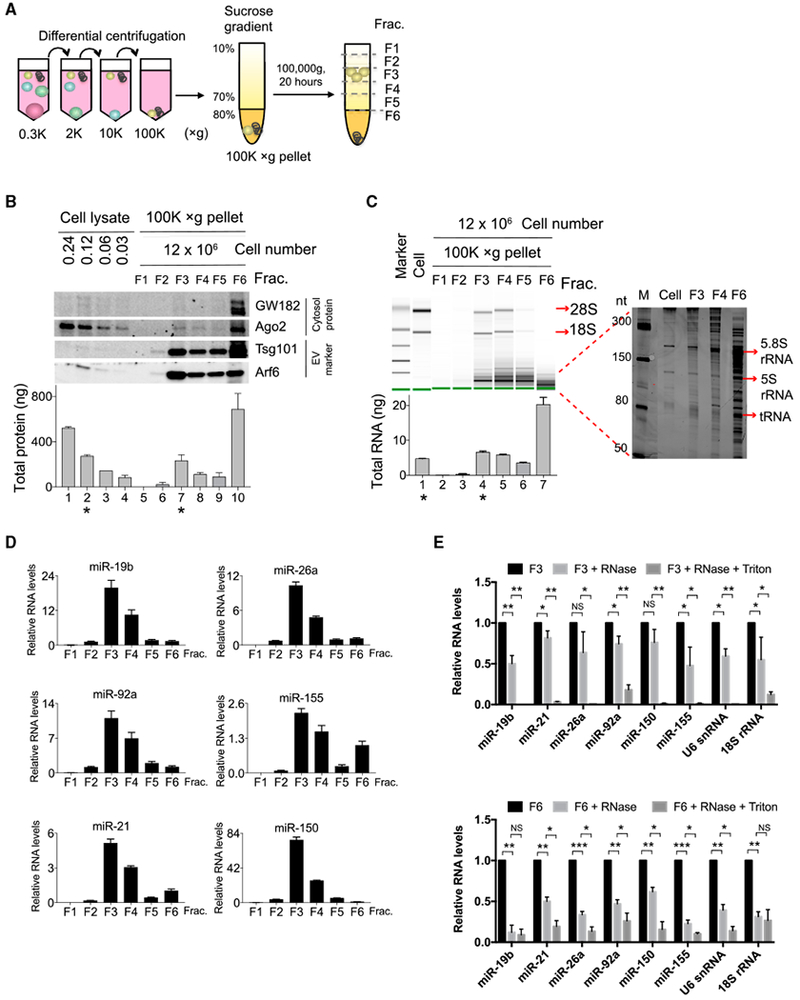
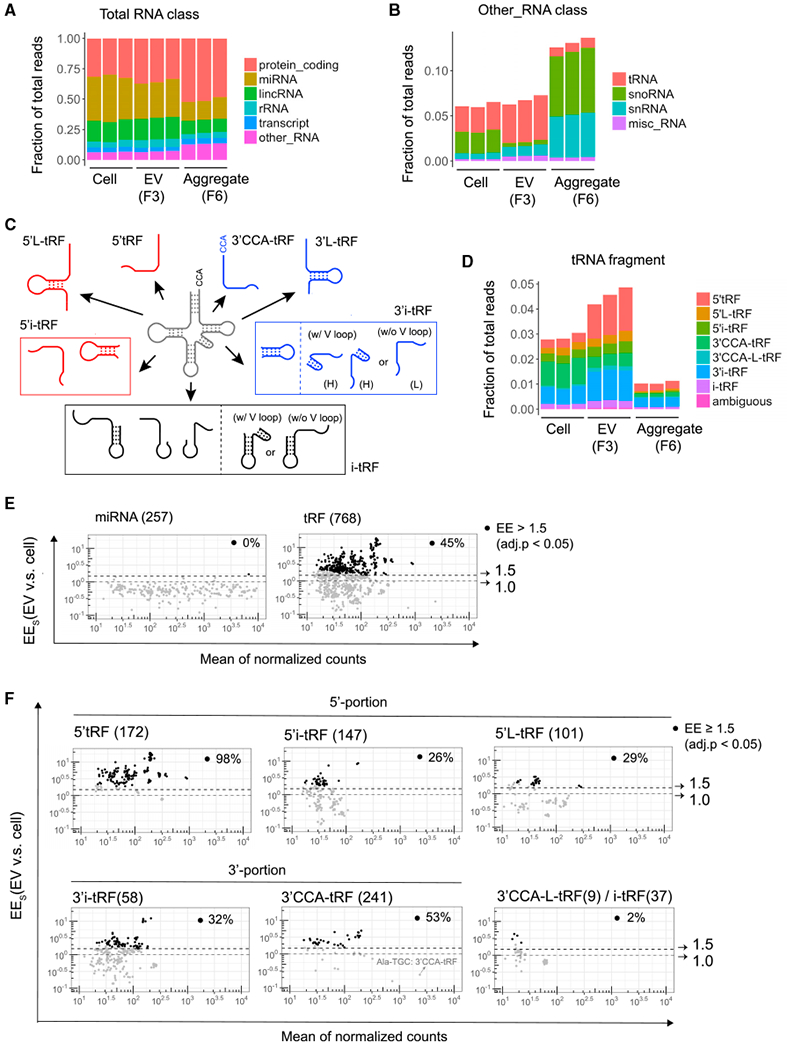
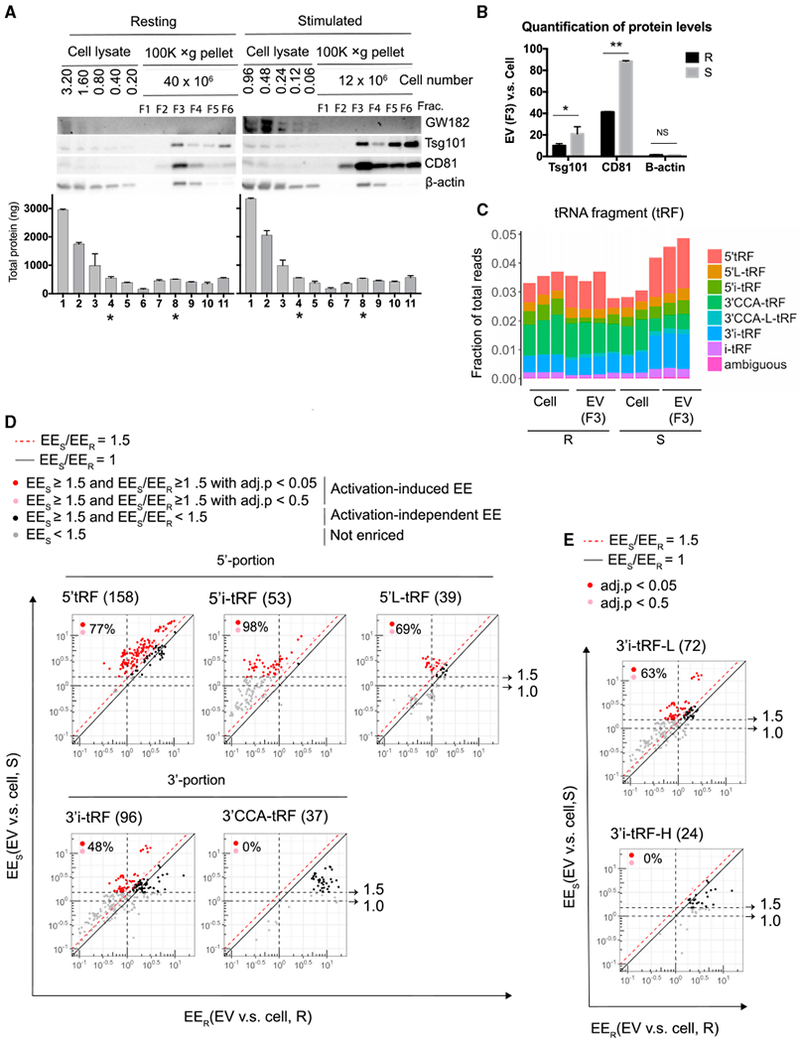
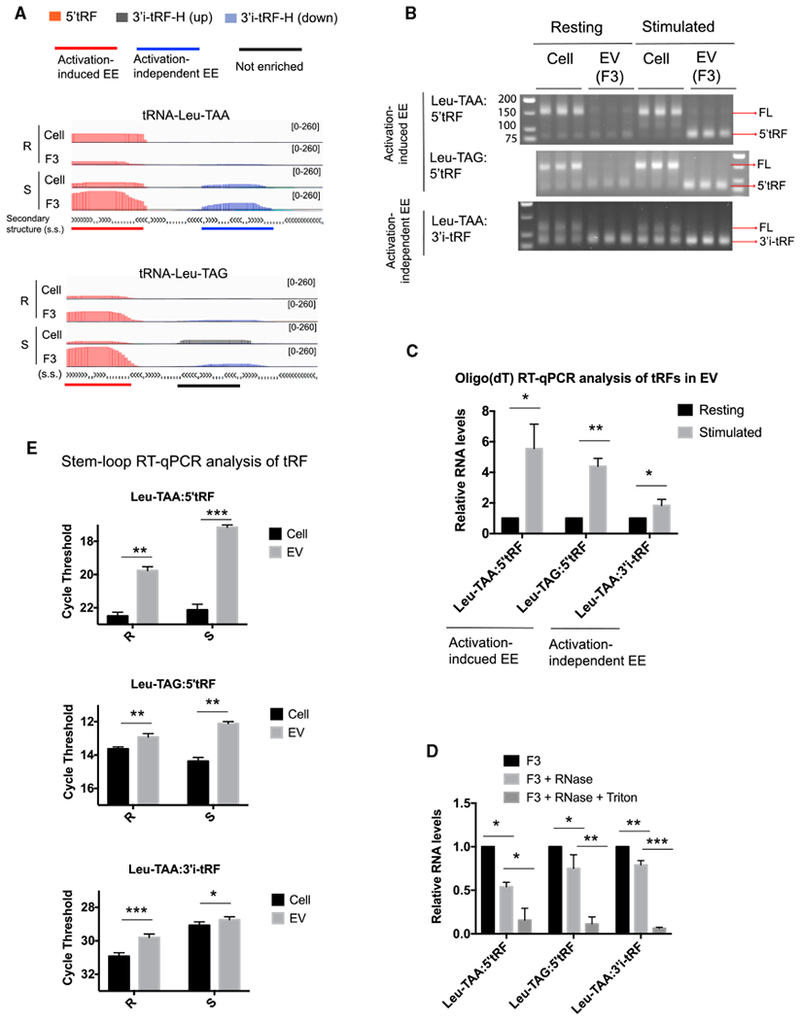
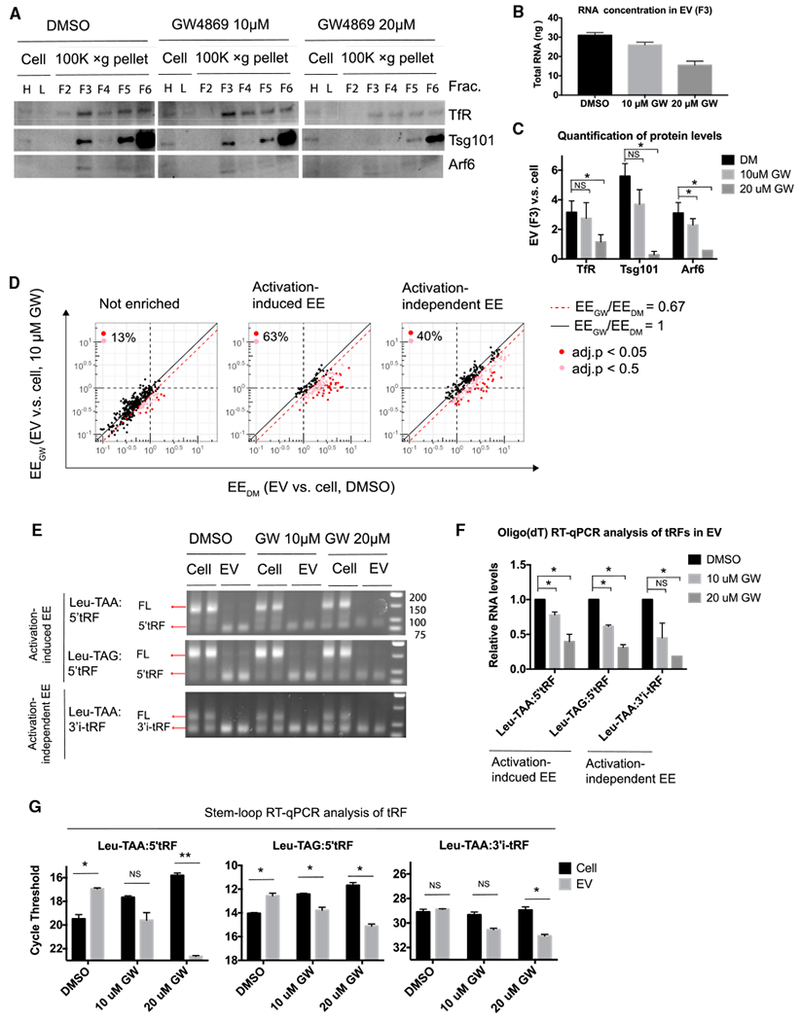
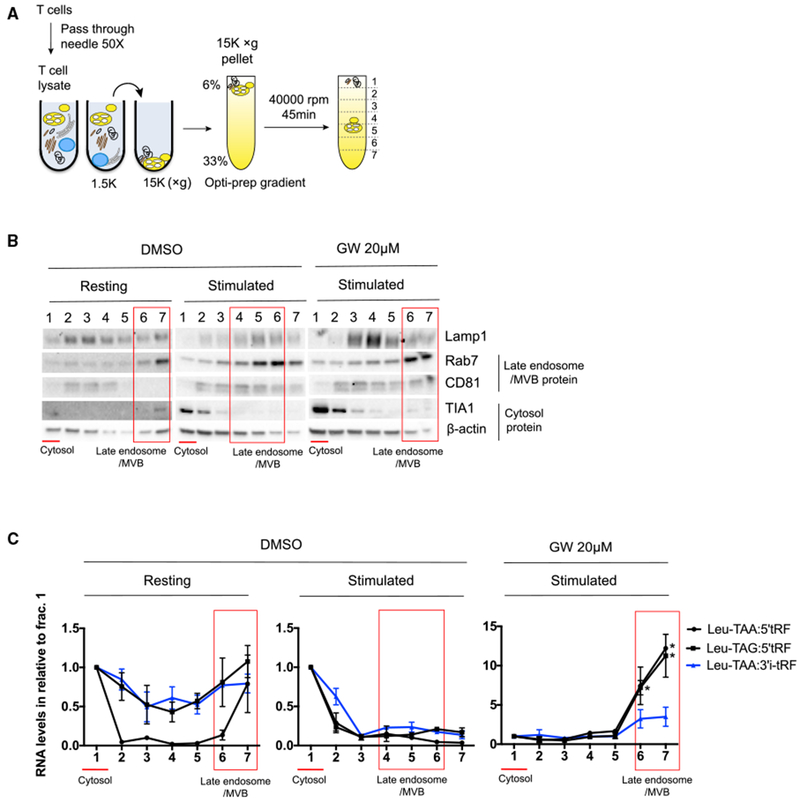
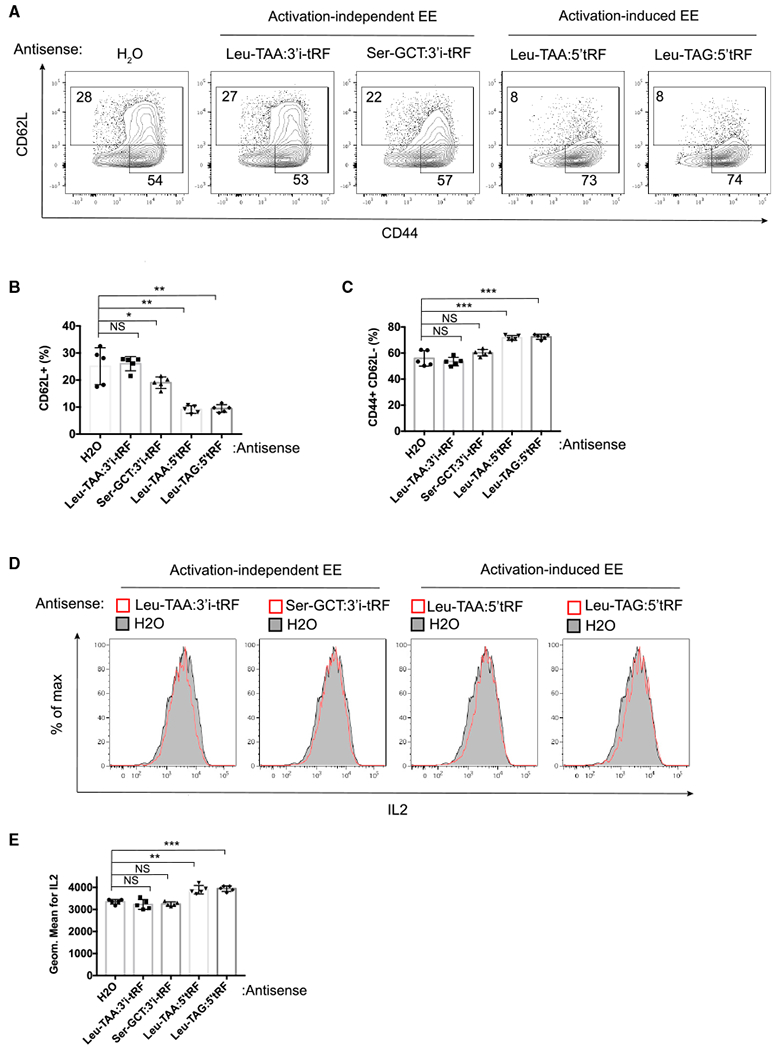
The discovery of microRNA (miRNA) sorting into extracellular vesicles (EVs) revealed a novel mode of intercellular communication and uncovered a link between cellular endomembrane compartments and small RNAs in EV-secreting cells. Using a two-step ultracentrifugation procedure to isolate EVs released by T cells, we found that 45% of tRNA fragments (tRFs), but fewer than 1% of miRNAs, were significantly enriched in EVs compared with the corresponding cellular RNA. T cell activation induced the EV-mediated release of a specific set of tRFs derived from the 5' end and 3'-internal region of tRNAs without variable loops. Inhibition of EV biogenesis pathways specifically led to the accumulation of these activation-induced EV-enriched tRFs within multivesicular bodies (MVBs). Introducing antisense oligonucleotides to inhibit these tRFs enhanced T cell activation. Taken together, these results demonstrate that T cells selectively release tRFs into EVs via MVBs and suggest that this process may remove tRFs that repress immune activation.

Keywords: T lymphocyte; exosome; extracellular vesicle; tRNA fragment; tsRNA.


Conflict of interest statement

DECLARATION OF INTERESTS

The authors declare no competing interests.

Figures

Figure 1.
Figure 1.. EVs that Contain Intact Discrete RNA Species Are Separated from Protein Aggregates that Are Dominated by Fragmented RNAs
(A) Schematic of a two-step purification procedure for separation of EVs from aggregates in cell culture supernatant. The supernatant was first subjected to differential centrifugation to remove live cells, dead cells, cell debris, and, finally, EVs, and aggregates were precipitated into 100,000 × g pellets. The 100,000 × g pellets were further separated by sucrose gradient into 6 fractions. (B) Western blot (top panel) analysis of sucrose gradient fractions of the separated 100,000 × g pellets and cell lysates prepared from the indicated numbers of cells in each lane. Bradford assay (bottom panel) determined total protein recovered in each fraction or cell lysate. * marks lanes containing similar concentrations of proteins from cell lysates (lane 2) and sucrose gradient fraction 3 (lane 7). (C) RNA 2100 Bioanalyzer analysis of large RNA species (left panel) and PAGE analysis of small RNA species ranging from 50 to 300 bp (right panel). Bottom panel shows total RNA yield from each fraction. * marks lanes with similar RNA yield from cells (lane 1) and sucrose gradient fraction 3 (lane 4). (D) qPCR analysis of miRNA abundance in equal volumes of RNA purified from each fraction. (E) qPCR analysis of the abundance of the indicated RNA species detected in fraction 3 (top) or in fraction 6 (bottom) left untreated or treated with RNase A or RNase A and Triton X-100. Data are representative of three independent experiments. Statistical significance is measured using a one-tailed t test: *p < 0.05, **p < 0.01, and ***p < 0.001. Error bars indicate SD of the mean. See also Figure S1.
Figure 2.
Figure 2.. Comparing the Composition of Small RNAs in Activated T Cells, EVs, and Aggregates
(A) Relative composition of mapped reads in small RNA libraries. RNA classification was based on the biotypes of Ensembl gene and transcript annotation. The “transcript” RNA class is the union of different biotypes, including processed transcript, antisense, and pseudogene. (B) Sub-classification of reads shown as “other_RNA” in (A) into tRNA, snoRNA, snRNA, and misc_RNA. (C) Pictorial summary of the 7 categories of tRFs that can arise from mature tRNAs. 3′i-tRF were further classified as hairpin (H) or linear (L) to indicate the presence or absence of tRNA variable loop-derived hairpin structures, respectively. (D) Classification of reads in the 7 tRF classes shown in (C) and rare tRFs of ambiguous classification. (E and F) MA plots comparing EV enrichment (EEs) (ratio of reads in EVs versus cells) and mean of normalized counts per million for all 257 detected miRNAs (E, left), all 768 detected tRFs (E, right), and subsets of tRFs in the indicated classes (F). Dotted lines and arrows indicate thresholds at 1.0 (no enrichment) and 1.5 EE. Black circles (·) mark RNA species significantly enriched in exosomes (≥ 1.5-fold; adjusted p < 0.05), and the percentage of significantly enriched RNA species among each class is indicated in each plot. See also Figure S2 and Table S1.
Figure 3.
Figure 3.. T Cell Activation Induces the EV Enrichment of tRFs that Are Derived from the 5′-Portion of tRNAs and the 3′-Internal Region of tRNAs without Hairpin Structures
(A) Western blot (top panel) analysis of sucrose gradient fractions of the separated 100,000 × g pellets and cell lysates prepared from the indicated numbers of cells cultured under resting or stimulated conditions. Bradford assay (bottom panel) determined total protein recovered in each fraction or cell lysate. * marks lanes containing similar concentrations of proteins from cell lysates (lane 4) and EVs (sucrose gradient fraction 3; lane 8). (B) Chemiluminescent quantification of western blot for proteins as shown in (A), expressed as the ratio of each protein in EVs versus cell lysates. (C) tRF sequence reads from resting and stimulated cellular and EV small RNA libraries classified as in Figures 2C and 2D. (D) EV enrichment (EE) for the indicated tRF classes from T cells cultured under resting (EER, x axis) and stimulated (EES, y axis) conditions. Dotted black lines and arrows indicate thresholds at 1.0 EES (no enrichment) and 1.5 EES. Solid black line demarcates equal EE in resting and stimulated cells (EES/EER = 1). Red dotted line indicates threshold at 1.5-fold increased EE in stimulated cells compared to resting cells (EES/EER ≥ 1.5). tRFs exhibiting activation-induced EV enrichment (EEs ≥ 1.5 and EES/EER ≥ 1.5) are marked by red circles (adjusted p < 0.05) or pink circles (adjusted p < 0.5). Black circles (·) mark tRFs with activation-independent EV enrichment in stimulated cells (EES ≥ 1.5; adjusted p < 0.05). The percentage of tRFs with activation-induced EE (union of red and pink circles) among all tRFs enriched in EVs in stimulated cells (union of black, red, and pink circles; total number indicated in parentheses after tRF class label in each panel) is indicated in each plot. (E) 3′i-tRF-L (linear) and 3′i-tRF-H (hairpin) subsets of the total 3′i-tRF shown in (D), lower left panel. see also Figure S3 and Table S2.
Figure 4.
Figure 4.. Validation of EV Enrichment of tRFs and Their Responses to T Cell Activation
(A) IGV visualization of tRFs of the indicated classes aligned to five representative mature tRNAs. (B) Electrophoretic analysis of products from the exponential phase of amplification in oligo(dT) RT-PCR assays for the indicated tRFs. We detected a band of the correct size and a larger product ~60 nt longer than 5′tRF or ~30 nt longer than 3′i-tRF, corresponding to amplification from full-length (FL) tRNAs. (C) Oligo(dT) qRT-PCR measurement of tRF abundance in EVs in resting (black bars) and stimulated (gray bars) conditions. (D) Oligo(dT) qRT-PCR analysis of the indicated RNA species detected in fraction 3 (F3) left untreated or treated with RNase A or with RNase A and Triton X-100. (E) tRF abundance in cells (black bars) and EVs (gray bars) under resting (R) and stimulated (S) conditions as determined by stem-loop qRT-PCR. Data are representative of at least three independent experiments. Statistical significance is measured using a one-tailed t test: *p < 0.05, **p < 0.01, and ***p < 0.001. Error bars indicate standard deviation of the mean. See also Figure S4.
Figure 5.
Figure 5.. nSMase Inhibitor Represses EV Enrichment of Activation-Induced and Activation-Independent EV-Enriched tRFs
(A) Western blot analysis of sucrose gradient fractions of the separated 100,000 × g pellets and cell lysates from T cells stimulated in the presence of DMSO vehicle control or GW4869 at the indicated concentrations. Cell lysates were prepared from higher and lower amounts of cells, which are labeled as H and L, respectively. (B) RNA yield from EV fraction (F3). (C) Chemiluminescent quantification of western blot for proteins as shown in (A). (D) EV enrichment (EE) for the indicated tRF classes from T cells stimulated in the presence of DMSO (EEDM, x axis) or GW4869 (EEGW, y axis). Dotted black lines indicate thresholds at 1.0 EE (no enrichment) in DMSO or GW4869 condition. Solid black line demarcates equal EE in each condition (EEDM/EEGW = 1). Red dotted line indicates threshold at 0.67-fold decreased EE in stimulated cells treated with GW4869 compared to stimulated cells treated with DMSO(EEGW/EEDM ≤ 0.67). tRFs with EE decreased by GW4869 treatment (EEGW/EEDM ≤ 0.67) are marked by red circles (adjusted p < 0.05) or pink circles (adjusted p < 0.5). The percentage of tRFs with EE decreased EE by GW4869 treatment (union of red and pink circles) among all tRFs in that class (union of black, red, and pink) is indicated in each plot. (E) Electrophoretic analysis of products from the exponential phase of amplification in oligo(dT) RT-PCR assays for the indicated tRFs as in Figure 4B. (F) Oligo(dT) qRT-PCR measurement of tRF abundance in EVs from cells stimulated with DMSO (black bars) and the indicated concentrations of GW4869 (gray bars). (G) tRF abundance in cells (black bars) and in EVs (gray bars) under resting and stimulated conditions as determined by stem-loop qRT-PCR. Statistical significance is measured using a one-tailed t test: *p < 0.05, **p < 0.01, and ***p < 0.001. Error bars indicate SD of the mean. See also Figure S5 and Table S2.
Figure 6.
Figure 6.. nSMase Inhibitor Induced the Accumulation of Activation-Induced EV-Enriched tRFs, but Not Activation-Independent EV-Enriched tRFs, within Rab7-Containing MVB Compartments
(A) Schematic of subcellular fractionation of T cells. 15,000 × g pellets obtained from differential centrifugation of T cell lysates were layered on the top of the Optiprep gradient and then centrifuged at 40,000 rpm for 45 min to separate different membrane organelles or cytosolic proteins. (B and C) Western blot analysis of proteins (B) and stem-loop qRT-PCR quantification of tRFs in subcellular fractions obtained from resting conditions or activated conditions treated with DMSO or GW4869 (C). For each fraction, RNA concentration is normalized to fraction 1. In (B) and (C), red lines indicate cytosolic fractions, and red boxes indicate MVB fractions. Data are representative of two independent experiments. Statistical significance is measured using a one-tailed t test: *p < 0.05, **p < 0.01, and ***p < 0.001. Error bars indicate standard deviation of the mean. See also Figure S6.
Figure 7.
Figure 7.. Transfection of Antisense Oligos against tRFs that Are Associated with MVBs in an Activation-Induced Manner Enhances T Cell Activation
(A) Representative flow cytometric analysis of CD44 and CD62L expression on the surface of CD4+ T cells transfected with antisense oligos complementary to tRFs or water vehicle (H2O) control. (B and C) Quantified frequency of CD62L+ (B) and CD44+ and CD62L+ (C) cells. (D) Representative flow cytometric analysis of IL-2 intracellular staining of live CD4+ T cells restimulated with PMA and ionomycin. (E) Geometric mean fluorescence intensity of IL-2 staining. Data are representative of at least three independent experiments. Statistical significance is measured using a one-tailed t test: *p < 0.05, **p < 0.01, and ***p < 0.001. Error bars indicate standard deviation of the mean. See also Figure S7.

References

    1. Alexander M, Ramstead AG, Bauer KM, Lee SH, Runtsch MC, Wallace J, Huffaker TB, Larsen DK, Tolmachova T, Seabra MC, et al. (2017). Rab27-Dependent Exosome Production Inhibits Chronic Inflammation and Enables Acute Responses to Inflammatory Stimuli. J. Immunol 199, 3559–3570. - PMC - PubMed
    1. Baglio SR, Rooijers K, Koppers-Lalic D, Verweij FJ, Pérez Lanzón M, Zini N, Naaijkens B, Perut F, Niessen HW, Baldini N, and Pegtel DM (2015). Human bone marrow- and adipose-mesenchymal stem cells secrete exosomes enriched in distinctive miRNA and tRNA species. Stem Cell Res. Ther 6, 127. - PMC - PubMed
    1. Barcena C, Stefanovic M, Tutusaus A, Martinez-Nieto GA, Martinez L, Garcia-Ruiz C, de Mingo A, Caballeria J, Fernandez-Checa JC, Mari M, and Morales A (2015). Angiogenin secretion from hepatoma cells activates hepatic stellate cells to amplify a self-sustained cycle promoting liver cancer. Sci. Rep 5, 7916. - PMC - PubMed
    1. Bidlingmaier S, Ha K, Lee NK, Su Y, and Liu B (2016). Proteome-wide Identification of Novel Ceramide-binding Proteins by Yeast Surface cDNA Display and Deep Sequencing. Mol. Cell. Proteomics 15, 1232–1245. - PMC - PubMed
    1. Borek E, Baliga BS, Gehrke CW, Kuo CW, Belman S, Troll W, and Waalkes TP (1977). High turnover rate of transfer RNA in tumor tissue. Cancer Res 37, 3362–3366. - PubMed

Publication types

MeSH terms