. 2018 Dec 18;25(12):3504-3518.e6.
doi: 10.1016/j.celrep.2018.11.069.

Single-Cell Analysis Identifies LY6D as a Marker Linking Castration-Resistant Prostate Luminal Cells to Prostate Progenitors and Cancer

Affiliations

Single-Cell Analysis Identifies LY6D as a Marker Linking Castration-Resistant Prostate Luminal Cells to Prostate Progenitors and Cancer

João D Barros-Silva et al. Cell Rep. .

Abstract

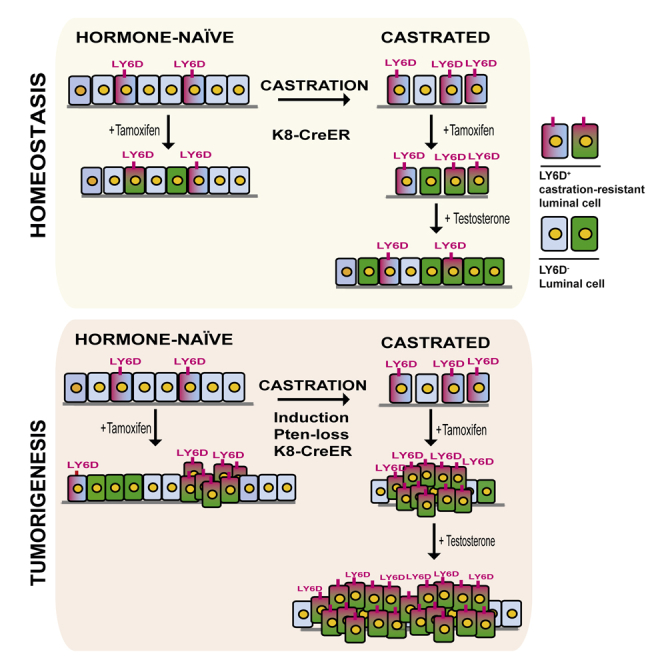
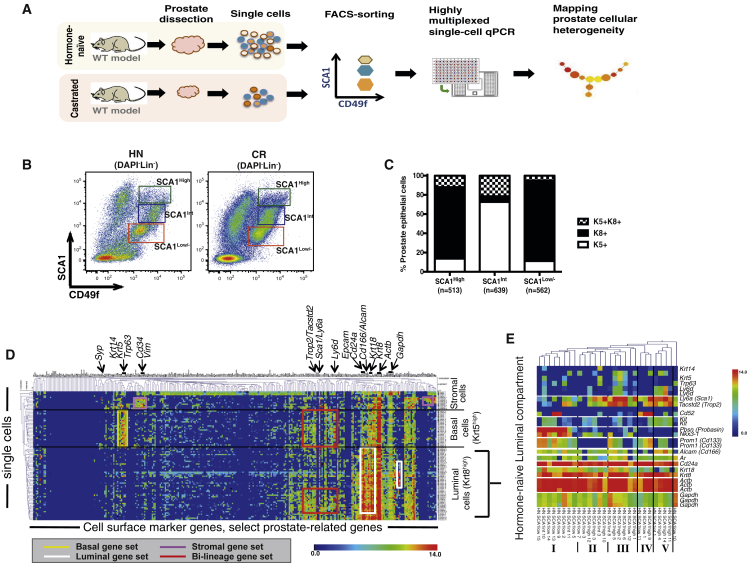
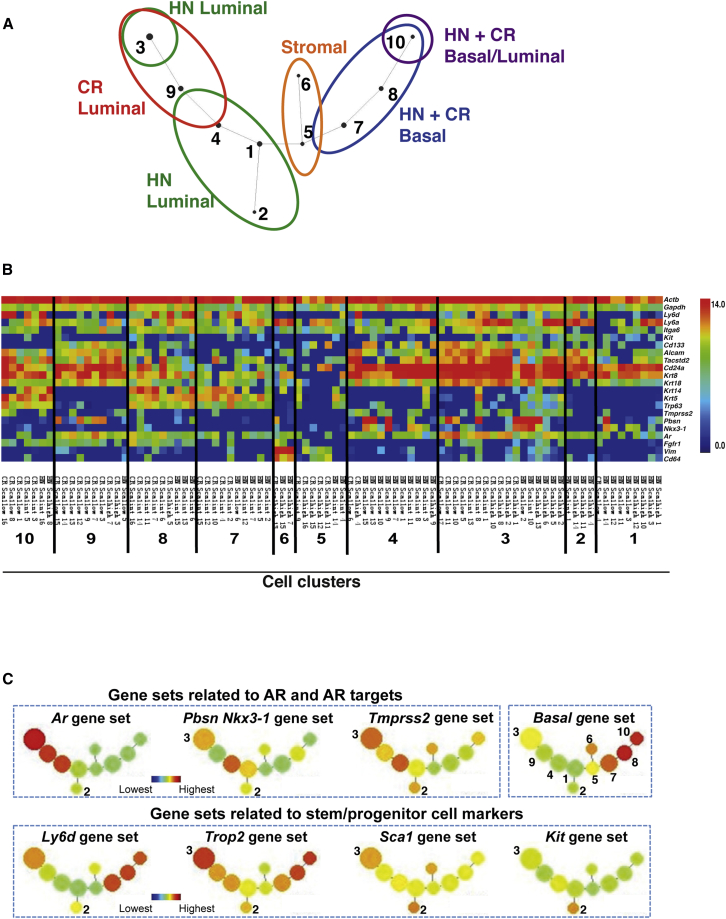
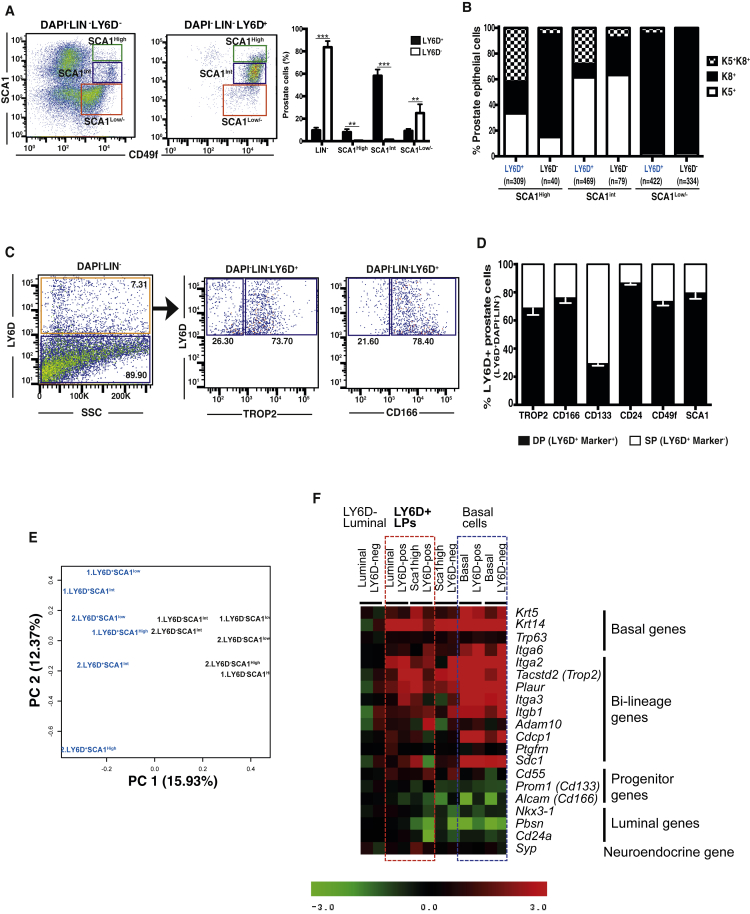
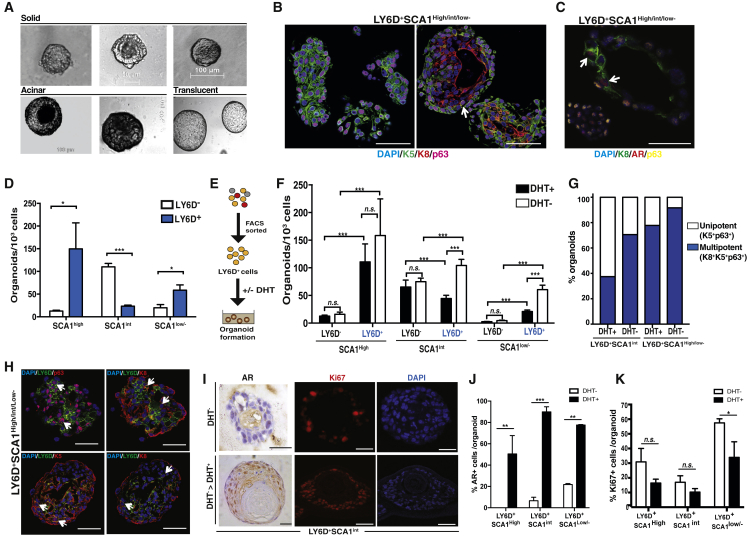
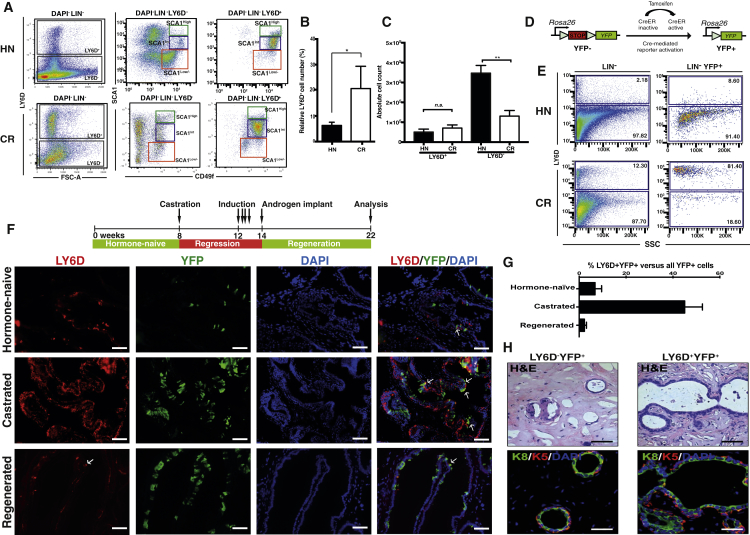
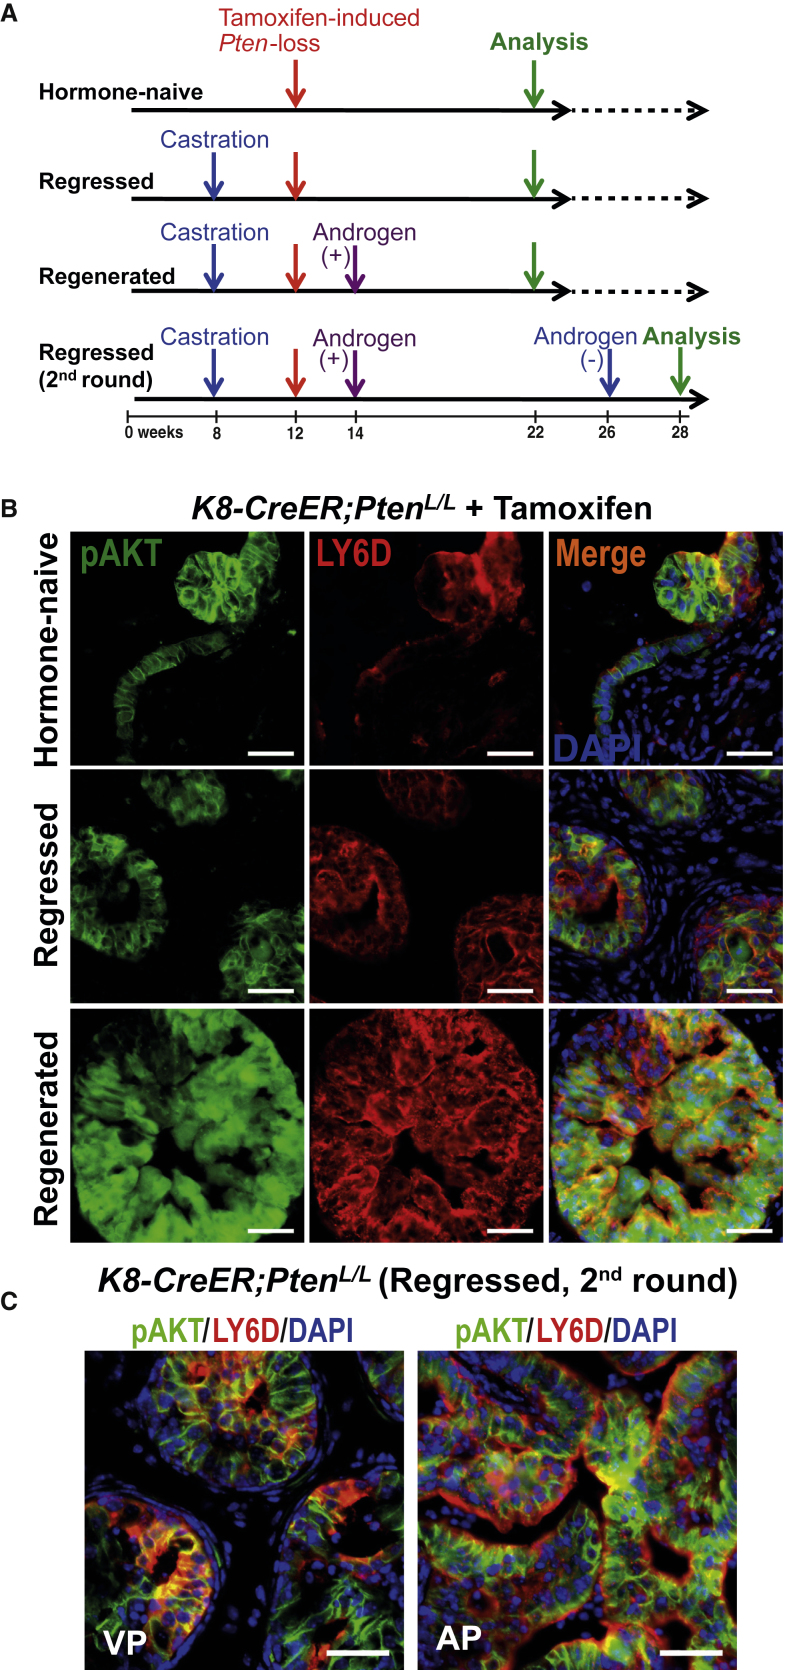
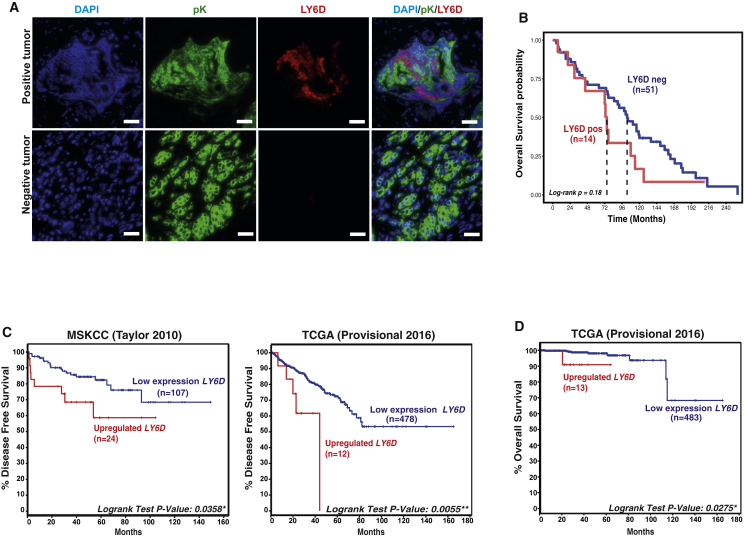
The exact identity of castrate-resistant (CR) cells and their relation to CR prostate cancer (CRPC) is unresolved. We use single-cell gene profiling to analyze the molecular heterogeneity in basal and luminal compartments. Within the luminal compartment, we identify a subset of cells intrinsically resistant to castration with a bi-lineage gene expression pattern. We discover LY6D as a marker of CR prostate progenitors with multipotent differentiation and enriched organoid-forming capacity. Lineage tracing further reveals that LY6D+ CR luminal cells can produce LY6D- luminal cells. In contrast, in luminal cells lacking PTEN, LY6D+ cells predominantly give rise to LY6D+ tumor cells, contributing to high-grade PIN lesions. Gene expression analyses in patients' biopsies indicate that LY6D expression correlates with early disease progression, including progression to CRPC. Our studies thus identify a subpopulation of luminal progenitors characterized by LY6D expression and intrinsic castration resistance. LY6D may serve as a prognostic maker for advanced prostate cancer.

Keywords: LY6D; castration-resistant prostate cancer; intrinsic resistance; luminal progenitor; tumor-initiating cells.


Figures

None
Graphical abstract
Figure 1
Figure 1
Single-Cell Expression Profiling of Prostate Cells from HN and Castrated Mice (A) Schematic diagram demonstrating experimental setup for single-cell expression profiling. (B) FACS gating strategy used to sort single prostate cells, from Lineage-negative cells (Lin: CD31CD45TER119). (C) Quantification of keratin expression profiles by IF based on three FACS-sorted populations as in (B). The number of cells counted in each group is shown from five mice. See also Figures S1A–S1C. (D) Hierarchical clustering of single prostate cells from HN and castrated (CR) mice showing separation of luminal, basal, and stromal cells, as well as the luminal (white), basal (yellow), bi-lineage (red), and stromal (purple) gene sets. Color scale is indicated. See also Table S2. (E) Enlarged view of select genes from the heatmap in Figure S1I clustering prostate cells in the luminal lineage from HN mice into five subsets. Color scale is indicated. See also Figure S1.
Figure 2
Figure 2
Mapping Lineage Relation of CR Prostate Luminal and Basal Cells to Their Counterparts from HN Mice (A) SPADE analysis based on 23 gene sets (Tables S3 and S4) showing relationship of luminal and basal cells subsets from hormone-naive (HN) and castrated (CR) mice. #1∼10 indicate cells with similar expression patterns of the 23 gene sets grouped as 10 cell clusters. (B) Heatmaps showing expression levels of select genes in each single cells grouped based on their cell cluster assignment (as in A). Color scale is indicated. (C) Average expression levels of select gene sets in each cluster of single cells (as in A). See also Figure S2A for expression levels of all 23 gene sets. See also Figure S2.
Figure 3
Figure 3
Characterization of LY6D+ Prostate Epithelial Subpopulations from HN Mice (A) FACS analysis of Lin cells from prostates (from HN mice) confirmed LY6D expression in basal (SCA1int), intermediate (SCA1high), and a small portion of luminal (SCA1low/−) cells. n = 3 for each sorted subpopulation. p values: ∗∗p < 0.01 and ∗∗∗p < 0.001. Error bars represent mean ± SEM. (B) Quantification of keratin expression by IF staining of the FACS-sorted subpopulations as in (A). The number of cells counted in each group is shown from four mice. See also Figure S3A. (C) FACS analysis of LY6D+ cells from HN prostates for their staining patterns of select prostate stem/progenitor and luminal surface markers. (D) Quantification of marker profiles based on FACS subpopulations as in (C). The average of frequency of the indicated populations is from three mice. (E) Comparison of the gene expression profiles from LY6D+ and LY6D subpopulations (based on RNA-seq data) by principal-component analysis (PCA). (F) Heatmap of differentially expressed genes in sorted LY6D+ and LY6D subsets from the SCA1high or int or low/− populations. Log2 expression values (based on microarray) were normalized to luminal (SCA1low/−) LY6D subset for each gene (=0). See also Figure S3.
Figure 4
Figure 4
LY6D+ Prostate Cells Are Enriched for Organoid-Forming Potential (A) Representative phase images of solid, acinar, and translucent organoids from FACS-sorted LinSCA1highLY6D+, LinSCA1intLY6D+, and LinSCA1low/−LY6D+ prostate cells. (B) Co-IF analysis of organoids derived from FACS-sorted LinSCA1highLY6D+, LinSCA1intLY6D+, and LinSCA1low/−LY6D+ prostate cells for Keratins and p63 expression. Arrow depicts K5+K8+p63+ triple-positive cells. See Figure S4A for individual channels. Scale bars: 50 μm. (C) AR expression in K8+ cells in representative multipotent organoids derived from FACS-sorted LinSCA1high LY6D+, LinSCA1intLY6D+, or LinSCA1low/−LY6D+ prostate cells. Arrows depict AR+K8+ double-positive cells. See Figure S4B for individual channels. Scale bars: 50 μm. (D) Quantification of organoids formed from FACS-sorted LY6D+ and LY6D (LinSCA1high, LinSCA1int, and LinSCA1low/−) prostate cell subsets (1,000–3,000 cells/well) from HN mice. n = 5 for each sorted subpopulation. p values: p < 0.05 and ∗∗∗p < 0.001. Error bars represent mean ± SEM. (E) Schematic diagram showing organoid culture in the presence or absence of androgen (DHT, dihydrotestosterone). (F) Quantification of organoids derived from FACS-sorted LY6D+ and LY6D (LinSCA1high, LinSCA1int, and LinSCA1low/−) prostate cell subsets (1,000–3,000 cells/well) from HN mice, in the presence (+) or absence (−) of DHT. n = 5 for each sorted subpopulation. p value: ∗∗∗p < 0.001. n.s., nonsignificant. Error bars represent mean ± SEM. (G) Quantification of unipotent (K5+p63+) and multipotent (K8+ K5+p63+) organoids formed from FACS-sorted LY6D+ (LinSCA1high, LinSCA1int, and LinSCA1low/−) prostate cell subsets (1,000–3,000 cells/well) from HN mice, in the presence (+) or absence (−) of DHT. n = 3 for each sorted subpopulation. (H) Representative co-IF analysis of LY6D, p63, and keratin markers for organoids derived from FACS-sorted LY6D+ (LinSCA1high, LinSCA1int, and LinSCA1low/−) prostate cells. Arrows depict double-positive cells. See Figure S4C for individual channels. Scale bars: 50 μm. (I) Androgen-response analysis of CR organoid outgrowth from FACS-sorted LinSCA1highLY6D+ subpopulation, in the absence of DHT, only or followed by DHT stimulation, measured by nuclear AR and Ki67 staining. See also Figure S4F. Scale bars: 50 μm. (J) Quantification of nuclear AR expression on LY6D+ (LinSCA1high, LinSCA1int, and LinSCA1low/−) derived organoids from castrated mice. Organoids were cultured in the absence of DHT for 14 days, and then stimulated for 7 days with 100 nM DHT. n = 3 for each sorted subpopulation. p values: ∗∗∗p < 0.001 and ∗∗p < 0.01. Error bars represent mean ± SEM. (K) Quantification of Ki67 expression on LY6D+ (LinSCA1high, LinSCA1int, and LinSCA1low/−) derived organoids from castrated mice. Organoids were cultured in the absence of DHT for 14 days, and then stimulated for 7 days with 100 nM DHT. n = 3 for each sorted subpopulation. p value: p < 0.05. n.s., non-significant. Error bars represent mean ± SEM. See also Figures S3 and S4.
Figure 5
Figure 5
LY6D Marks CR Luminal Cells that May Possess Regeneration Capacity (A) FACS plots comparing LY6D staining of total Lin and LY6D+ or − SCA1High or int or Low/− prostate cells from hormone-naive (HN) and castrated (CR) males. (B) Quantification of LY6D expression profiles based on FACS subpopulations as in (A) (HN versus castrated). The average of frequency of the indicated populations is from five mice. p value: p < 0.05. Error bars represent mean ± SEM. (C) Quantification of the absolute numbers of LY6D+ or − subpopulations based on FACS subpopulations as in (A) (HN versus castrated). The average of frequency of the indicated populations is from five mice. p value: ∗∗p < 0.01. n.s., non-significant. Error bars represent mean ± SEM. (D) Schematic diagram showing genetic marking by YFP via tamoxifen-induced activation of CreER. (E) Representative FACS plots showing LY6D staining from tamoxifen-induced K8-CreER;R26Y prostates for Lin or LinYFP+ populations. Tamoxifen induction performed on HN or fully regressed males (after castration) (CR). (F) Representative IF staining results showing YFP and LY6D staining, as well as the co-IF patterns in HN, castrated, and regenerated prostates from K8-CreER;R26Y mice after tamoxifen. Nuclei, DAPI. Arrows depict YFP+LY6D+ double-positive cells. Scale bars: 50 μm. (G) Quantification of the percentage of LY6D+YFP+ per total YFP+ cells from tamoxifen-induced K8-CreER;R26Y prostates. The average of frequency of the indicated populations is from three mice. Error bars represent mean ± SEM. (H) Representative subcutaneous outgrowths from FACS-sorted YFP-marked prostate cells separated as LY6D+ and LY6D subsets. Note engrafted YFP+LY6D+ cells could generate much larger outgrowth composed of both K5+ (red) and K8+ (green) prostate cells. Scale bars: 50 μm. See also Figures S5H and S5I. See also Figure S5.
Figure 6
Figure 6
LY6D+ Prostate Cells Are Involved in Prostate Cancer Initiation and Progression (A) Experimental scheme for the lineage-tracing experiment in (B) and (C) showing the time points when K8-CreER;PtenL/L males were castrated, injected with tamoxifen (to induce Pten inactivation), regenerated with androgen, and analyzed. (B) Co-IF staining of HN, regressed, and regenerated K8-CreER;PtenL/L prostates showing overlap of pAKT (green) and LY6D (red) in HG-PIN lesions. Nuclei, DAPI (blue). Scale bars: 50 μm. (C) Co-IF staining showing abundant pAKT+ LY6D+ prostate cancer cells in CR HG-PIN lesions observed in K8-CreER;PtenL/L mice at the second round of regression, with Pten inactivation induced upon surgical castration (i.e., first round regression). VP, ventral prostate; AP, anterior prostate. Scale bars: 50 μm. See also Figure S6.
Figure 7
Figure 7
LY6D Is Associated with Advanced Human PCa (A) Representative IF staining results showing pan-Keratin (pK) (epithelial marker) and LY6D staining in human prostate cancer samples. Scale bars: 20 μm. (B) Kaplan-Meier curve of tissue microarray showing association of LY6D positivity (based on protein) with patient outcomes. The red line depicts patients with positive LY6D (LY6Dpos) expression (n = 14), whereas the blue line patients with negative LY6D (LY6Dneg) expression (n = 51). (C) Kaplan-Meier curve of human prostate cancer (PCa) cohorts (Cancer Genome Atlas Research Network, 2015, Taylor et al., 2010) analyzing time to biochemical recurrence from diagnosis. The red line depicts patients with high LY6D expression (mRNA [z score > 1.3]), whereas the blue line patients with low LY6D expression. Patients with missing disease-free survival status in TCGA; n = 6 are excluded. (D) Kaplan-Meier curve of human TCGA PCa cohort (Cancer Genome Atlas Research Network, 2015) analyzing patients’ overall survival. See also Figure S7.

References

    1. Agarwal S., Hynes P.G., Tillman H.S., Lake R., Abou-Kheir W.G., Fang L., Casey O.M., Ameri A.H., Martin P.L., Yin J.J. Identification of different classes of luminal progenitor cells within prostate tumors. Cell Rep. 2015;13:2147–2158. - PMC - PubMed
    1. AlHossiny M., Luo L., Frazier W.R., Steiner N., Gusev Y., Kallakury B., Glasgow E., Creswell K., Madhavan S., Kumar R., Upadhyay G. Ly6E/K signaling to TGFβ promotes breast cancer progression, immune escape, and drug resistance. Cancer Res. 2016;76:3376–3386. - PMC - PubMed
    1. Bauman T.M., Vezina C.M., Huang W., Marker P.C., Peterson R.E., Ricke W.A. Beta-catenin is elevated in human benign prostatic hyperplasia specimens compared to histologically normal prostate tissue. Am. J. Clin. Exp. Urol. 2014;2:313–322. - PMC - PubMed
    1. Bendall S.C., Simonds E.F., Qiu P., Amir A.D., Krutzik P.O., Finck R., Bruggner R.V., Melamed R., Trejo A., Ornatsky O.I. Single-cell mass cytometry of differential immune and drug responses across a human hematopoietic continuum. Science. 2011;332:687–696. - PMC - PubMed
    1. Brakenhoff R.H., Gerretsen M., Knippels E.M., van Dijk M., van Essen H., Weghuis D.O., Sinke R.J., Snow G.B., van Dongen G.A. The human E48 antigen, highly homologous to the murine Ly-6 antigen ThB, is a GPI-anchored molecule apparently involved in keratinocyte cell-cell adhesion. J. Cell Biol. 1995;129:1677–1689. - PMC - PubMed

Publication types

MeSH terms