. 2018 Dec 18;49(6):1049-1061.e6.
doi: 10.1016/j.immuni.2018.10.008.

The Innate Immune Sensor NLRC3 Acts as a Rheostat that Fine-Tunes T Cell Responses in Infection and Autoimmunity

Affiliations

The Innate Immune Sensor NLRC3 Acts as a Rheostat that Fine-Tunes T Cell Responses in Infection and Autoimmunity

Toru Uchimura et al. Immunity. .

Abstract

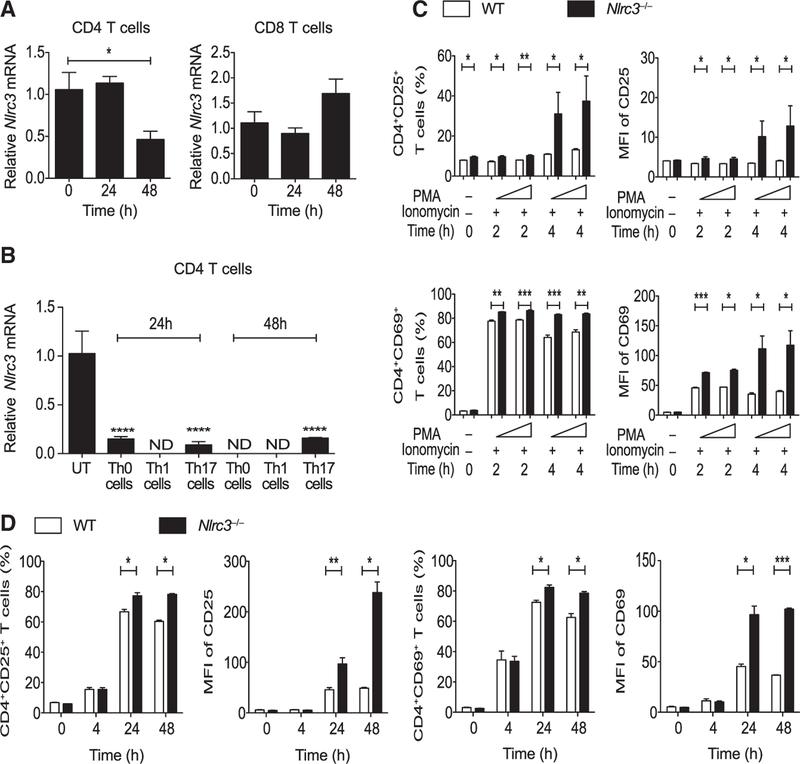
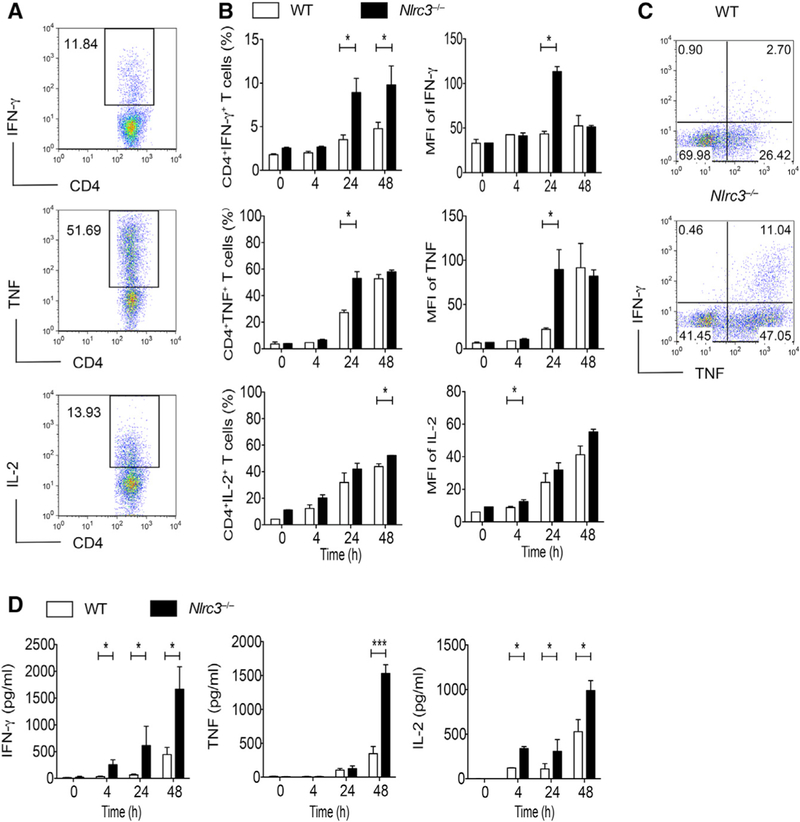
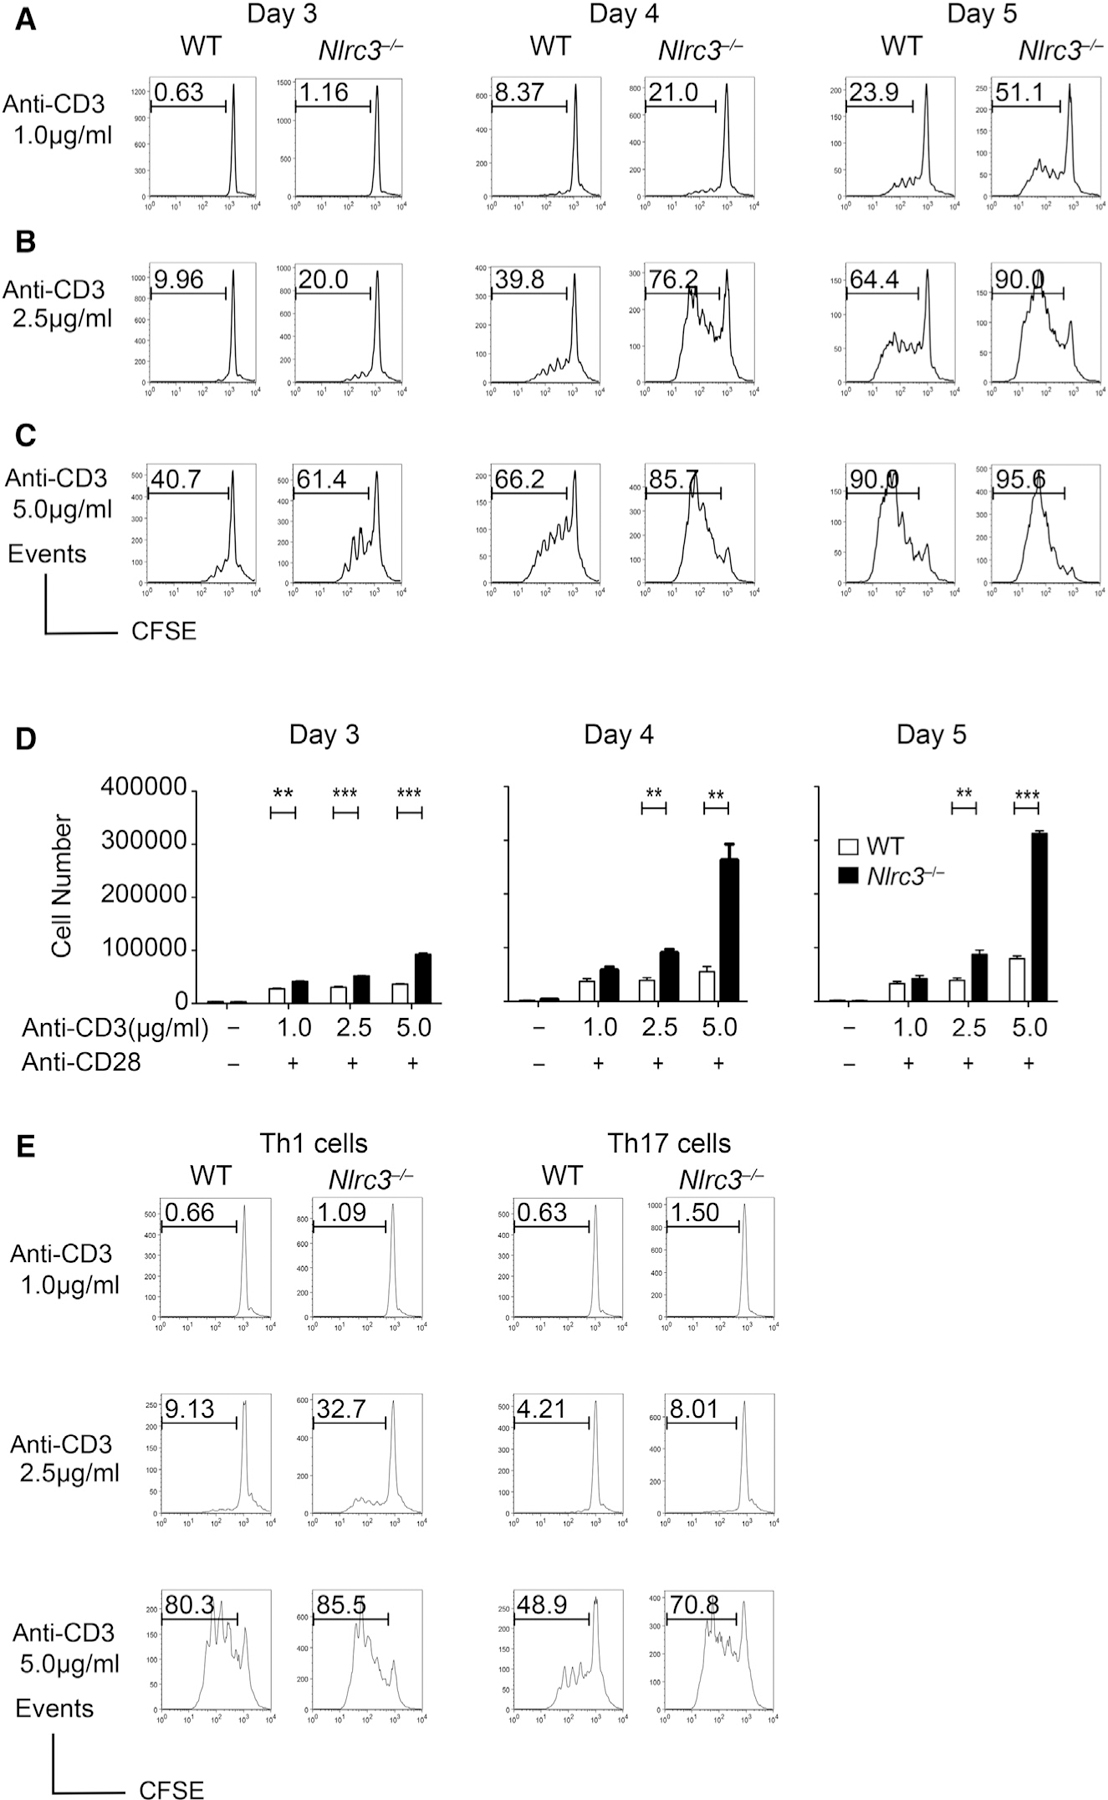
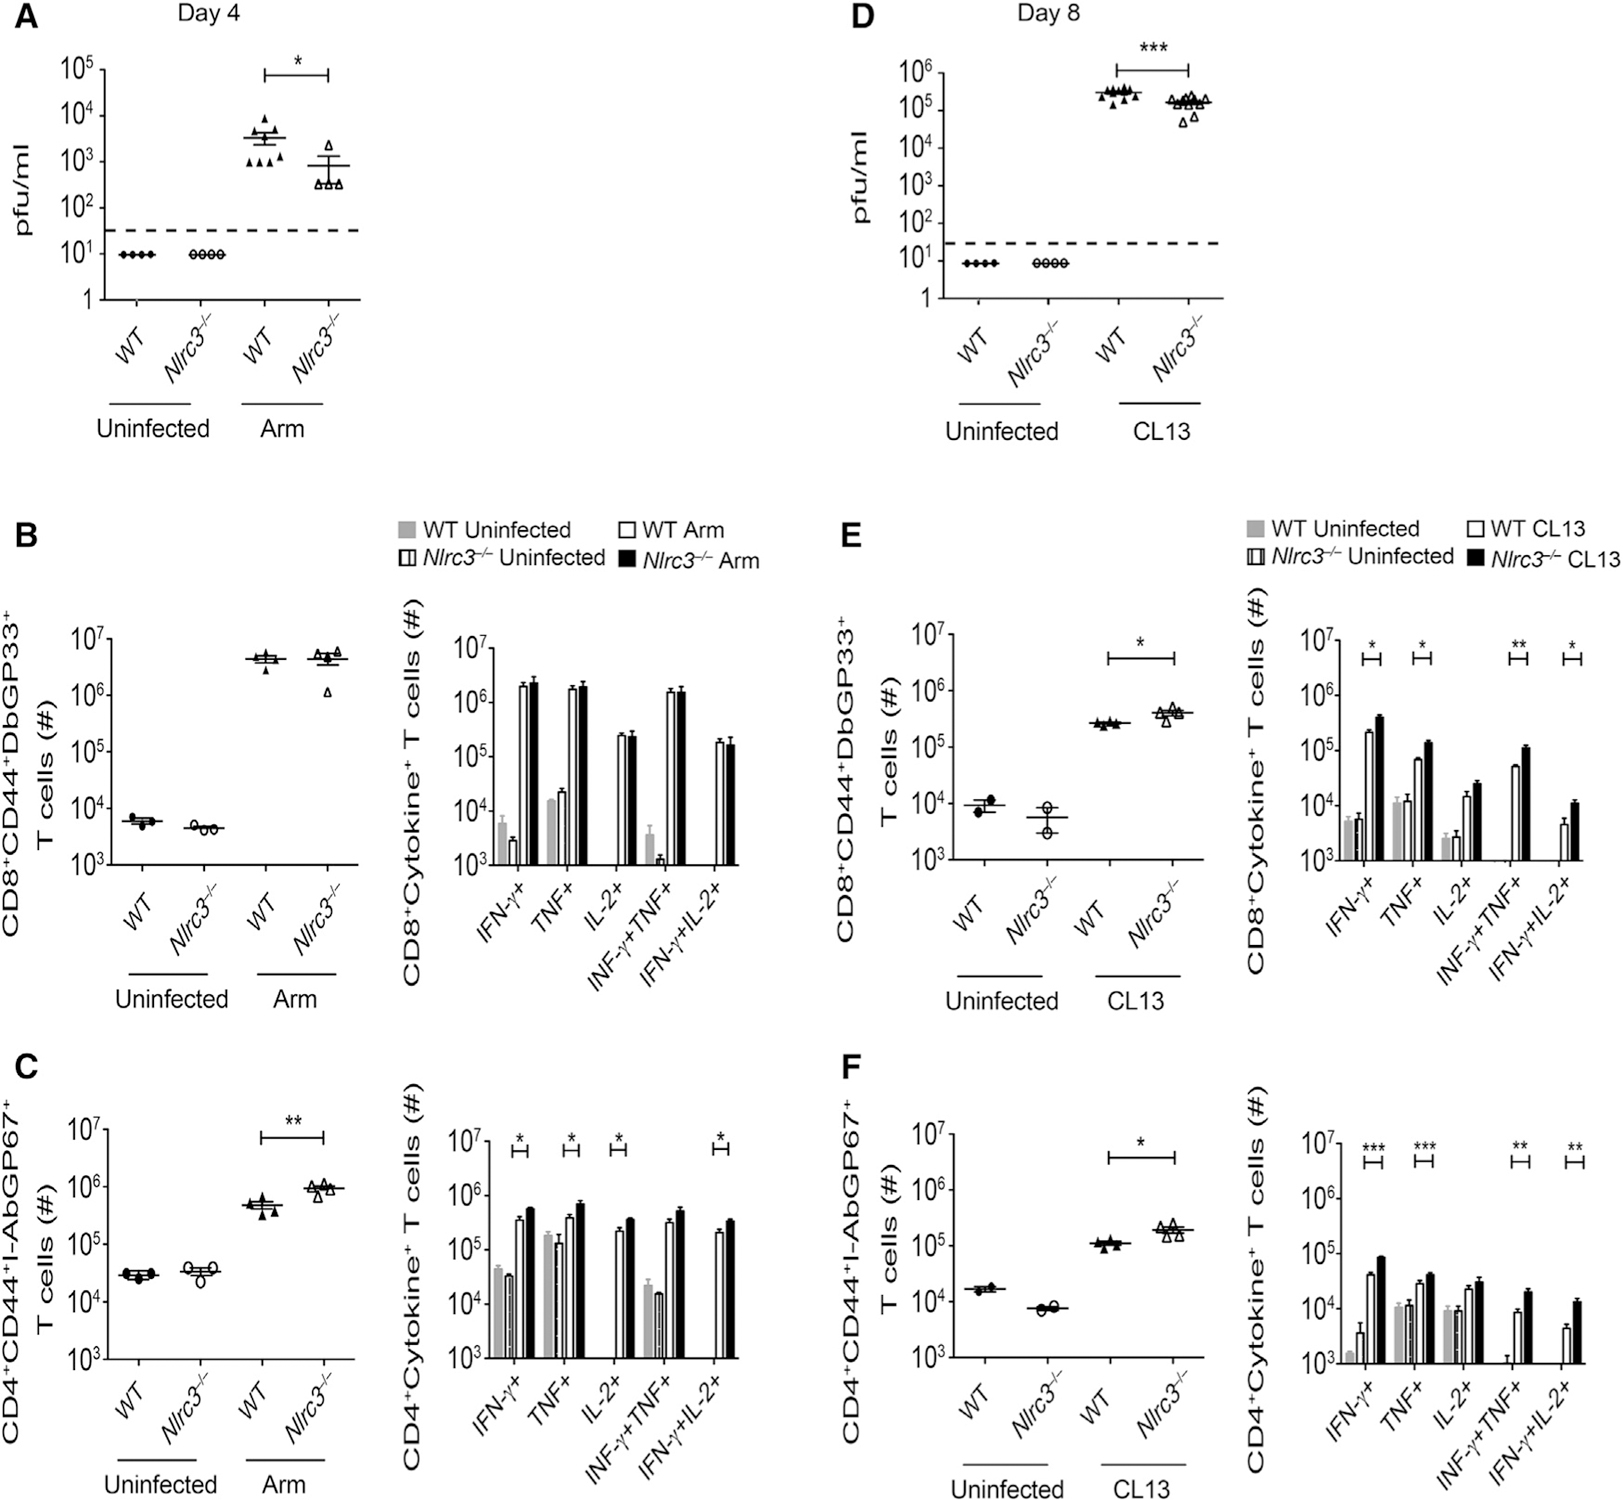
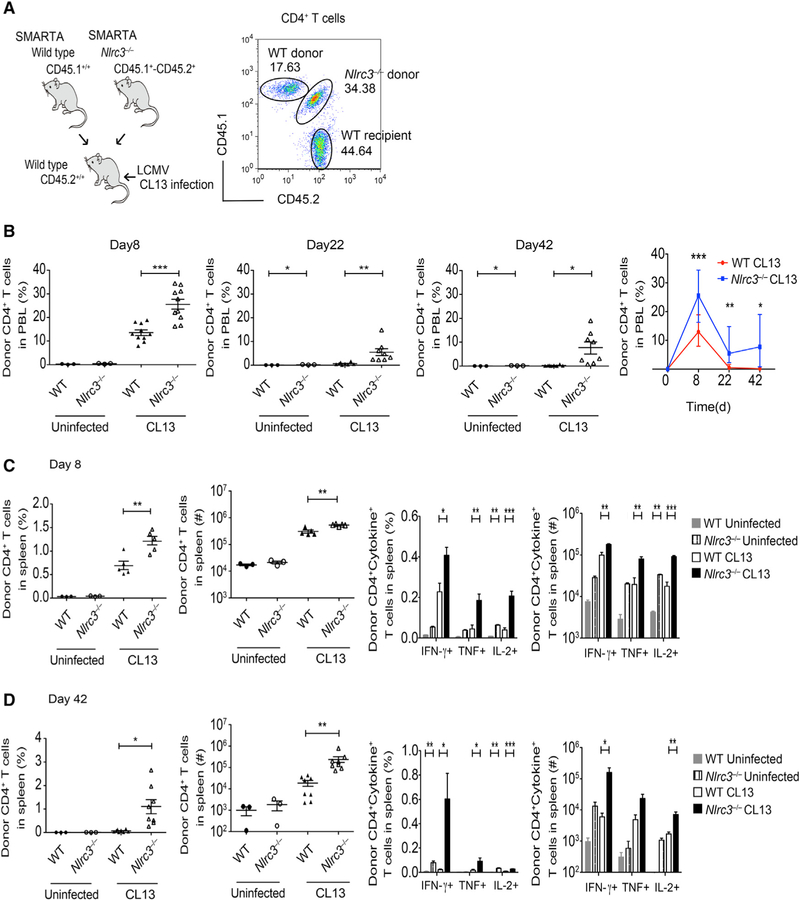
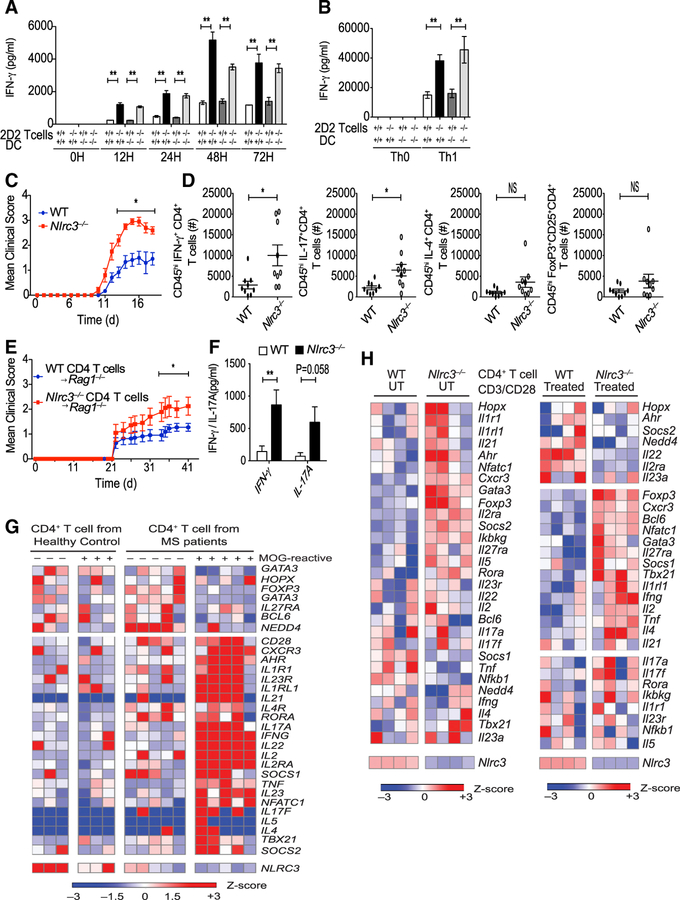
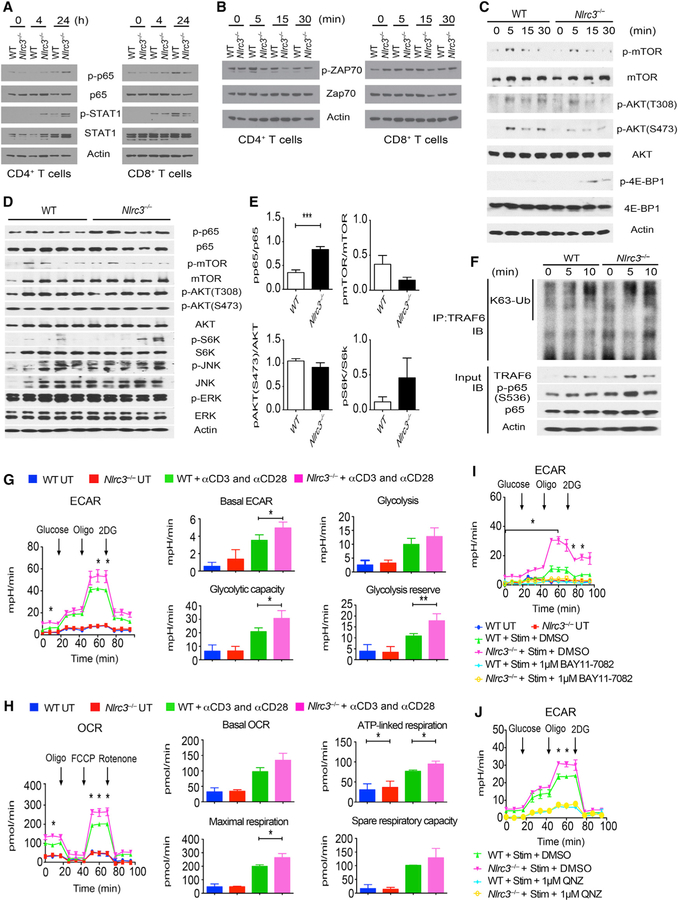
Appropriate immune responses require a fine balance between immune activation and attenuation. NLRC3, a non-inflammasome-forming member of the NLR innate immune receptor family, attenuates inflammation in myeloid cells and proliferation in epithelial cells. T lymphocytes express the highest amounts of Nlrc3 transcript where its physiologic relevance is unknown. We show that NLRC3 attenuated interferon-γ and TNF expression by CD4+ T cells and reduced T helper 1 (Th1) and Th17 cell proliferation. Nlrc3-/- mice exhibited increased and prolonged CD4+ T cell responses to lymphocytic choriomeningitis virus infection and worsened experimental autoimmune encephalomyelitis (EAE). These functions of NLRC3 were executed in a T-cell-intrinsic fashion: NLRC3 reduced K63-linked ubiquitination of TNF-receptor-associated factor 6 (TRAF6) to limit NF-κB activation, lowered phosphorylation of eukaryotic translation initiation factor 4E-binding protein 1 (4E-BP1), and diminished glycolysis and oxidative phosphorylation. This study reveals an unappreciated role for NLRC3 in attenuating CD4+ T cell signaling and metabolism.

Keywords: CD4(+) T cell response; EAE; LCMV infection; NLRC3; NOD-like receptors; T cell receptor signaling; autoimmunity; inflammatory pathways.


Conflict of interest statement

DECLARATION OF INTERESTS

The authors declare no competing interests.

Figures

Figure 1
Figure 1. Nlrc3 Is Down-regulated upon TCR Stimulation, Suppressing CD4+ T Cell Activation
(A) Nlrc3 expression in splenic CD4+ T cells and CD8+ T cells from WT mice after activation by anti-CD3 (5 μg/mL) and anti-CD28 (2 μg/mL) antibodies. (B) Nlrc3 expression in splenic CD4+ T cells from WT mice upon activation by anti-CD3 (5 μg/mL) and anti-CD28 (2 μg/mL) antibodies under Th0, Th1, and Th17 cell conditions. (C) CD4+ T cells isolated from WT and Nlrc3−/− mice were stimulated with PMA (50 ng/mL) and ionomycin (1 μg/mL). Graphs show the percentage of CD4+CD25+ and CD4+CD69+ cells, MFI of CD25 among CD4+CD25+ cells, and MFI of CD69 among CD4+CD69+ cells after stimulation. (D) Cells isolated from WT and Nlrc3−/− mice were stimulated with anti-CD3 (5 μg/mL) and anti-CD28 (2 μg/mL) antibodies. Graphs show the percentage of CD4+CD25+ and CD4+CD69+ cells, MFI of CD25 among CD4+CD25+ cells, and MFI of CD69 among CD4+CD69+ cells. Data are from one experiment representative of two or three experiments and are shown as mean ± SEM of triplicate samples. Statistical significance was determined by unpaired t test. *p < 0.05, **p < 0.01, ***p < 0.001. See also Figures S1 and S2.
Figure 2
Figure 2. NLRC3 Negatively Regulates Cytokine Expression by Activated CD4+ T Cells
CD4+ T cells purified from WT and Nlrc3−/− mice were stimulated with anti-CD3 (5 μg/mL) and anti-CD28 (2 μg/mL) antibodies and incubated for 0, 4, 24, and 48 hr. (A) Flow-cytometry analysis of CD4+IFN-γ+, CD4+TNF+, and CD4+IL-2+ cells. (B) Percentages of IFN-γ+, TNF+, and IL-2+CD4+ T cells; MFI of IFN-γ expression among IFN-γ+CD4+ cells; MFI of TNF expression among TNF+CD4+ cells; and MFI of IL-2 expression among IL-2+CD4+ cells by intracellular staining. (C) Representative results at the 24 hr time point of (B). (D) IFN-γ, TNF, and IL-2 in supernatants of CD4+ T cell cultures as measured by ELISA. Representative data from three experiments are presented as mean ± SEM. Statistical significance was determined by unpaired t test. *p < 0.05, **p < 0.01, ***p < 0.001. See also Figure S3.
Figure 3
Figure 3. NLRC3 Negatively Regulates Cell Proliferation in a T-Cell-Intrinsic Manner
CD4+ T cells isolated from WT and Nlrc3−/− mice were stimulated with anti-CD3 (1, 2.5, and 5 μg/mL) and anti-CD28 (2 μg/mL) antibodies and incubated for 3–5 days. (A) Histograms of CFSE-labeled CD4+ T cells after anti-CD3 (1.0 μg/mL) and anti-CD28 (2.0 μg/mL) treatment. (B) Histograms of CFSE-labeled CD4+ T cells after anti-CD3 (2.5 μg/mL) and anti-CD28 (2.0 μg/mL) treatment. (C) Histograms of CFSE-labeled CD4+ T cells after anti-CD3 (5.0 μg/mL) and anti-CD28 (2.0 μg/mL) treatment. (D) Number of CD4+ T cells recovered from the cultures. (E) CFSE-labeled CD4+ T cells isolated from WT and Nlrc3−/− mice were stimulated with anti-CD3 (1, 2.5, and 5 μg/mL) and anti-CD28 (2 μg/mL) antibodies under Th1 (IL-12) or Th17 (IL-6 and TGF-β) conditions. Histograms show CFSE fluorescence at day 3 of culture. Results are representative of two or three experiments and represented as mean ± SEM. Statistical significance was determined by unpaired t test. *p < 0.05, **p < 0.01, ***p < 0.001. See also Figure S4.
Figure 4
Figure 4. Nlrc3–/– Mice Show Increased CD4+ T Cell Responses during LCMV Infection
WT and Nlrc3−/− mice were given LCMV-Armstrong or LCMV-Clone 13 and analyzed for virus loads and T cell responses. (A) Viral load in serum at day 4 after LCMV-Armstrong infection (n = 4 for WT uninfected, n = 4 for Nlrc3−/− uninfected, n = 8 for WT with Armstrong infection, n = 4 for Nlrc3−/− with Armstrong infection). Data are from one experiment representative of two independent experiments. (B) Total number of LCMV-specific DbGP33+ CD8+ cells per spleen (left) and GP33-specific cytokine-producing CD8+ cells (right) 8 days after LCMV-Armstrong infection (n = 3 for WT uninfected, n = 3 for Nlrc3−/− uninfected, n = 4 for WT with Armstrong infection, n = 4 for Nlrc3−/− with Armstrong infection). Data are from one experiment representative of two independent experiments. (C) Total number of LCMV-specific I-AbGP67+ CD4+ T cells per spleen (left) and GP61–80-specific cytokine-producing CD4+ cells (right) 8 days after LCMV-Armstrong infection (n = 3 for WT uninfected, n = 3 for Nlrc3−/− uninfected, n = 4 for WT with Armstrong infection, n = 4 for Nlrc3−/− with Armstrong infection). Data are from one experiment representative of two independent experiments. (D) Viral load in serum at day 8 after LCMV-Clone 13 infection (n = 4 for Nlrc3−/− uninfected, n = 11 for WT with Clone 13 infection, n = 11 for Nlrc3−/− with Clone 13 infection). Data are pooled from two independent experiments. (E) Total number of LCMV-specific DbGP33–41+ CD8+ cells (left) and GP33-specific cytokine-producing CD8+ cells (right) 8 days after LCMV-Clone 13 infection (n = 2 for WT uninfected, n = 2 for Nlrc3−/− uninfected, n = 4 for WT with Clone 13 infection, n = 4 for Nlrc3−/− with Clone 13 infection). Data are from one experiment representative of three independent experiments. (F) Total number of LCMV-specific I-AbGP66–77 CD4+ T cells (left) and GP61–80-specific cytokine-producing CD4+ cells (right) 8 days after LCMV-Clone 13 infection (n = 2 for WT uninfected, n = 2 for Nlrc3−/− uninfected, n = 4 for WT with Clone 13 infection, n = 4 for Nlrc3−/− with Clone 13 infection). Data are from one experiment representative of three independent experiments. Each symbol represents one mouse. Data are shown as mean ± SEM. Statistical significance was determined by unpaired t test. *p < 0.05, **p < 0.01, ***p < 0.001. See also Figure S5.
Figure 5
Figure 5. NLRC3 Inhibits CD4+ T Cell Expansion and Pro-inflammatory Cytokine Production during LCMV Infection In Vivo
WT mice received equal numbers of WT or Nlrc3−/− SMARTA CD4+ T cells. The recipients were given LCMV-Clone 13, and donor cell response was analyzed at multiple times after infection. (A) Schematic of dual-transfer experiment of wild type SMARTA cells (CD45.1+) and Nlrc3−/− SMARTA cells (CD45.1+CD45.2+) into B6 mice (CD45.2+) (left). Flow analysis of donor WT SMARTA cells (CD45.1+) and donor Nlrc3−/− SMARTA cells (CD45.1+CD45.2+) is also shown (right). (B) Percentage of SMARTA cells in peripheral blood at days 8, 22, and 42 after LCMV-Clone 13 infection (day 8: n = 3 recipients for WT uninfected, n = 3 recipients for Nlrc3−/−, n = 10 recipients for WT with Clone 13 infection, n = 10 recipients for Nlrc3−/− with Clone 13 infection; days 22 and 42: n = 3 recipients for WT uninfected, n = 3 recipients for Nlrc3−/− uninfected, n = 8 recipients for WT with Clone 13 infection, n = 8 recipients for Nlrc3−/− with Clone 13 infection). (C) Percentage and total number of splenic SMARTA cells and intracellular cytokine staining for IFN-γ, TNF, and IL-2 8 days after Clone 13 infection (n = 3 recipients for WT uninfected, n = 3 recipients for Nlrc3−/− uninfected, n = 5 recipients for WT with Clone 13 infection, n = 5 recipients for Nlrc3−/− with Clone 13 infection). (D) Percentage and total number of splenic SMARTA cells and intracellular cytokine staining for IFN-γ, TNF, and IL-2 at 42 days of Clone 13 infection (n = 3 recipients for WT uninfected, n = 3 recipients for Nlrc3−/− uninfected, n = 8 recipients for WT with Clone 13 infection, n = 8 recipients for Nlrc3−/− with Clone 13 infection). Each symbol represents one mouse. Data are from one experiment representative of two independent experiments and are shown as mean ± SEM. Statistical significance was determined by unpaired t test. *p < 0.05, **p < 0.01, ***p < 0.001. See also Figure S5.
Figure 6
Figure 6. Nlrc3–/– Mice Are More Susceptible to EAE
(A) MOG35–55 coated DCs from WT and Nlrc3–/– mice were co-cultured with 2D2 CD4+ T cells from 2D2-Tg+Nlrc3+/+ or 2D2-Tg+Nlrc3–/– mice. The graph shows amounts of IFN-γ in the supernatant as measured by ELISA. (B) ELISA analysis of IFN-γ in the supernatant at 36 hr co-culture with MOG35–55-stimulated DCs from WT and Nlrc3–/– mice and 2D2 CD4+ T cells from 2D2 Tg+Nlrc3+/+ or 2D2 Tg+Nlrc3–/– mice under Th1 condition. (C) WT and Nlrc3–/– mice were immunized with MOG35–55 CFA and pertussis toxin for the induction of EAE. The graph shows the clinical score of EAE (n = 11 for WT mice, n = 10 for Nlrc3–/– mice). Data are pooled from two independent experiments. (D) Total number of infiltrating IFN-γ+CD4+ T cells, IL-17+CD4+ T cells, IL-4+CD4+ T cells, and Foxp3+CD25+CD4+ T cells in the spinal cord 15 days after EAE (n = 9 for WT mice, n = 9 for Nlrc3–/– mice). (E) CD4+ T cells were isolated from WT and Nlrc3–/– mice and adoptively transferred into Rag1–/– mice; 1 day later, the recipient mice were vaccinated for the induction of EAE. The graph shows the clinical score of EAE (n = 11 for Rag1–/– mice transferred with WT CD4+ T cells, n = 10 for Rag1–/– mice transferred with Nlrc3–/–CD4+ T cells). Data are pooled from two independent experiments. (F) T cells were isolated from the draining lymph nodes of Rag1–/– recipients of WT or Nlrc3−/− CD4 T+ cells at day 18 after MOG vaccination and were re-stimulated with MOG35–55 antigen in a recall assay. Supernatants collected 48 hr later were analyzed by ELISA for IFN-γ and IL-17A (n = 3 for WT untreated [UT]), n = 3 for Nlrc3−/− UT, n = 4 for WT, n = 7 for Nlrc3−/−). Data are from one experiment representative of two independent experiments. (G) The heatmap is based on RNA-seq data comparing MOG-reactive or -non-reactive CD4+ T cells from MS subjects and healthy control individuals. (H) Mouse Th0 cells were untreated or treated with anti-CD3 (5 μg/mL) and anti-CD28 (2 μg/mL) and then analyzed by RNA-seq. The heatmap shows the relative amounts of RNA for WT and Nlrc3−/− CD4+ T cells. Data are shown as mean ± SEM. Significance was determined by unpaired t test. *p < 0.05, **p < 0.01, ***p < 0.001.
Figure 7
Figure 7. NLRC3 Suppresses Immune Signaling in CD4+ T Cells In Vitro and In Vivo
(A and B) Western blot analyses of purified splenic CD4+ T cells and CD8+ T cells stimulated by anti-CD3 (5 μg/mL) and anti-CD28 (2 μg/mL) antibodies. (C) Western blot analyses of purified splenic CD4+ T cells stimulated by anti-CD3 (5 μg/mL) and anti-CD28 (2 μg/mL) antibodies. (D) Western blot analyses of spinal cords from CD4+ T-cell-transferred Rag1–/– mice 18 days after induction of EAE. Each lane represents a spinal cord from a different mouse. (E) Densitometric analysis of (D). (F) WT and Nlrc3−/− CD4+ T cells stimulated with anti-CD3 (5 μg/mL) and anti-CD28 (2 μg/mL) antibodies, and then endogenous TRAF6 immune-precipitation was performed. The western blot shows K63-linked ubiquitination (K63-Ub) of TRAF6. (G) CD4+ T cells from spleens of WT or Nlrc3−/− mice were stimulated or not with anti-CD3 and anti-CD28 antibodies for 24 hr and then assayed for ECA) or OCR. Cells were measured over time and exposed (at the indicated time points) to glucose, oligomycin, and 2-DG for ECAR measurement or to oligomycin, FCCP, and rotenone for OCR assessment. ECARs and OCRs were recorded three times per condition. The basal ECAR, glycolysis (ECAR after glucose addition), glycolytic capacity (maximal ECAR after subtracting the ECAR following 2-DG exposure), and glycolytic reserve (difference between oligomycin-induced maximal ECAR and glucose-induced glycolytic flux) were calculated. (H) Cells were cultured as in (G) except that basal OCR, ATP-linked mitochondrial respiration (difference between basal respiration and OCR after the addition of oligomycin), maximal respiration (FCCP-induced maximal OCR minus the portion of nonmitochondrial OCR due to rotenone treatment), and spare respiratory capacity (difference between maximal OCR and basal respiration) were measured. (I) CD4+ T cells from WT or Nlrc3−/− mice were stimulated with anti-CD3 and anti-CD28 antibodies (Stim) together with BAY11–7082 inhibitor (1 mM) or DMSO for 24 hr and then subjected to ECAR analysis. (J) ECAR analysis of CD4+ T cells from WT or Nlrc3−/− mice that were stimulated for 24 hr with anti-CD3 and anti-CD28 antibodies (Stim) in the presence of QNZ inhibitor (1 mM) or DMSO. Data are from one experiment representative of two or three independent experiments. Data are shown as mean ± SEM. Significance was determined by Student’s t test. *p < 0.05, **p < 0.01, ***p < 0.001. See also Figures S6 and S7.

Comment in

  • NLRC3 Restrains Responses to a T.
    Holley CL, Coll RC, Schroder K. Holley CL, et al. Immunity. 2018 Dec 18;49(6):989-991. doi: 10.1016/j.immuni.2018.12.003. Immunity. 2018. PMID: 30566886

References

    1. Allen IC (2014). Non-inflammasome forming NLRs in inflammation and tumorigenesis. Front. Immunol 5, 169. - PMC - PubMed
    1. Allen IC, Moore CB, Schneider M, Lei Y, Davis BK, Scull MA, Gris D, Roney KE, Zimmermann AG, Bowzard JB, et al. (2011). NLRX1 protein attenuates inflammatory responses to infection by interfering with the RIG-I-MAVS and TRAF6-NF-κB signaling pathways. Immunity 34, 854–865. - PMC - PubMed
    1. Allen IC, Wilson JE, Schneider M, Lich JD, Roberts RA, Arthur JC, Woodford RM, Davis BK, Uronis JM, Herfarth HH, et al. (2012). NLRP12 suppresses colon inflammation and tumorigenesis through the negative regulation of noncanonical NF-κB signaling. Immunity 36, 742–754. - PMC - PubMed
    1. Anand PK, Malireddi RK, Lukens JR, Vogel P, Bertin J, Lamkanfi M, and Kanneganti TD (2012). NLRP6 negatively regulates innate immunity and host defence against bacterial pathogens. Nature 488, 389–393. - PMC - PubMed
    1. Brubaker SW, Bonham KS, Zanoni I, and Kagan JC (2015). Innate immune pattern recognition: a cell biological perspective. Annu. Rev. Immunol 33, 257–290. - PMC - PubMed

Publication types

MeSH terms