. 2018 Dec 18;8(12):1068.
doi: 10.3390/nano8121068.

Synthesis of Pd-Fe System Alloy Nanoparticles by Pulsed Plasma in Liquid

Affiliations

Synthesis of Pd-Fe System Alloy Nanoparticles by Pulsed Plasma in Liquid

Shota Tamura et al. Nanomaterials (Basel). .

Abstract

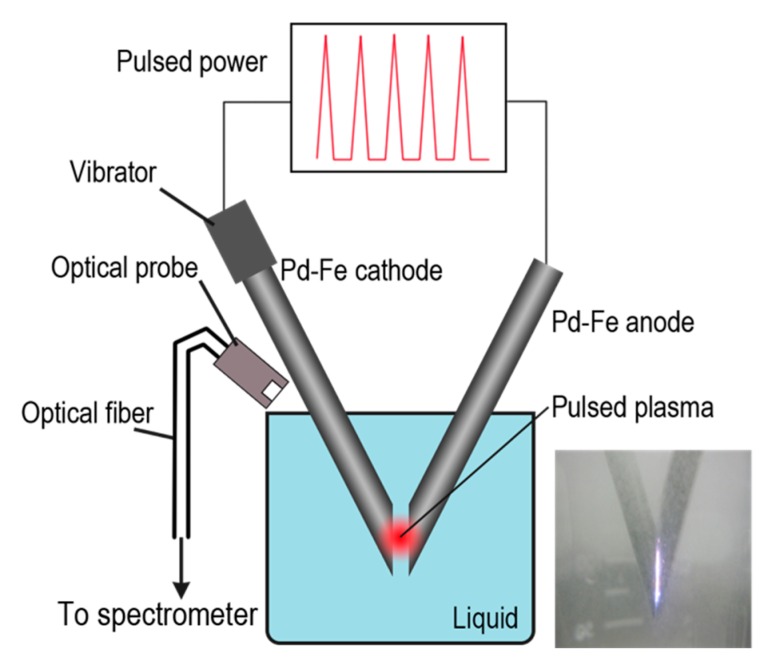
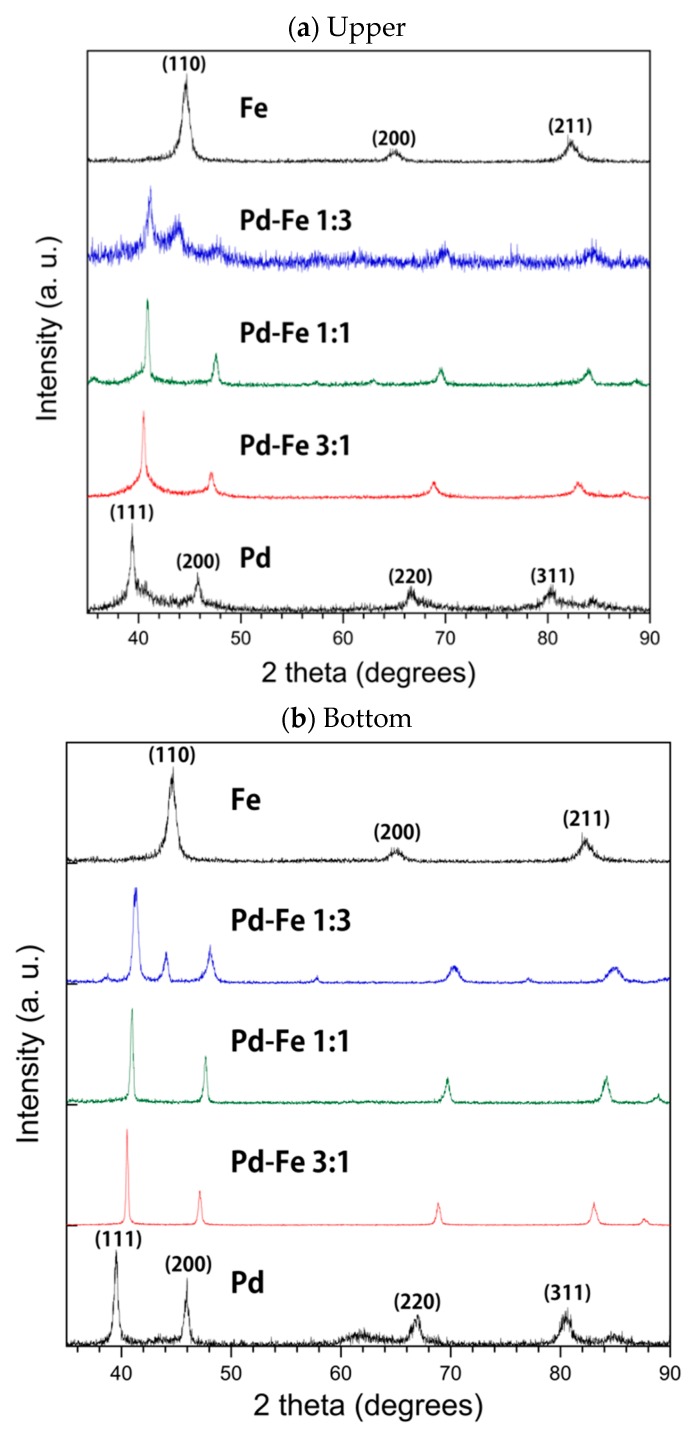
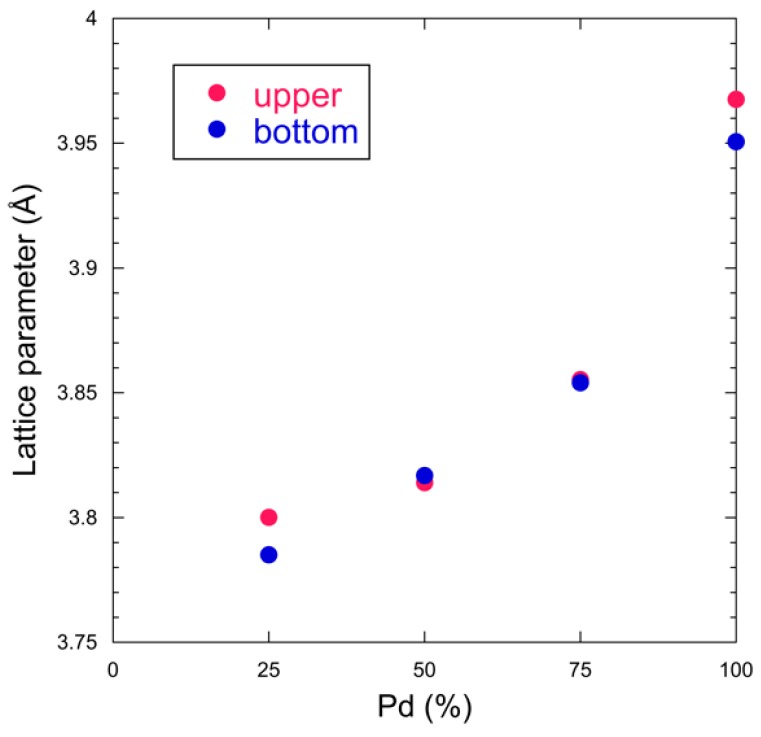
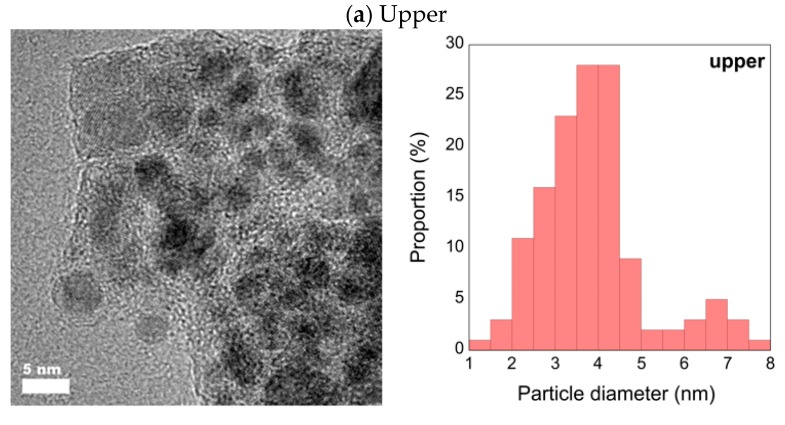
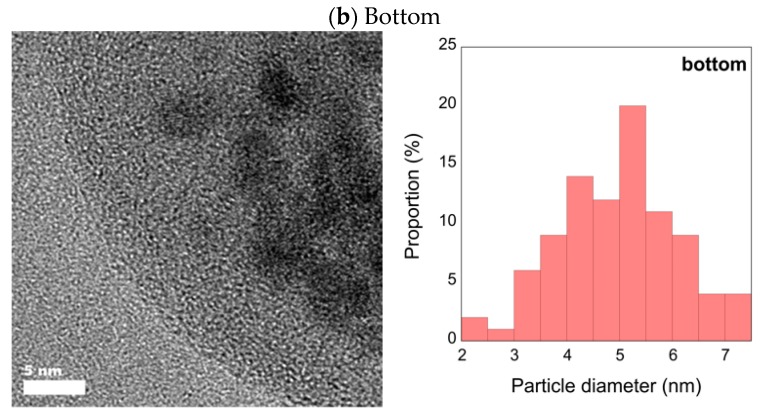
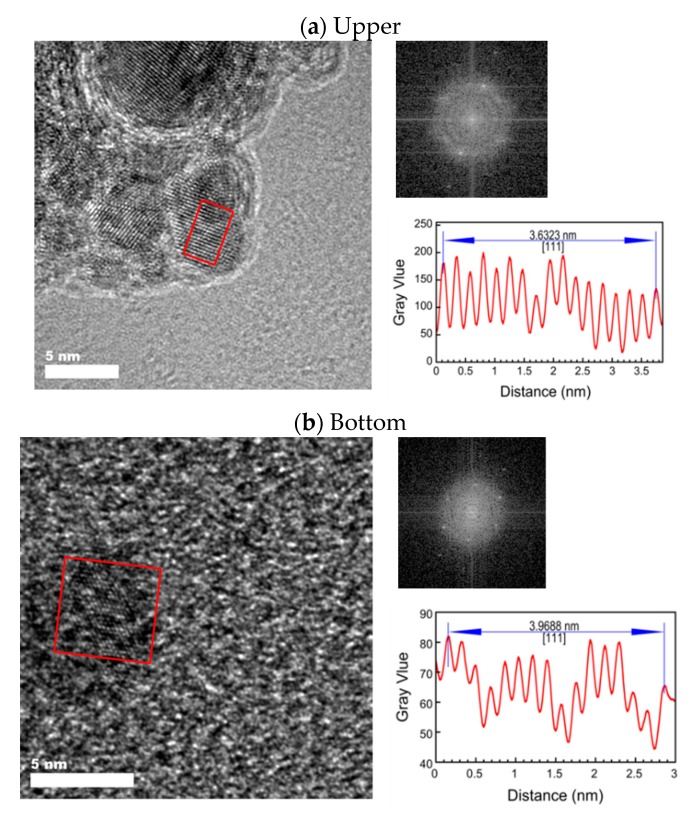
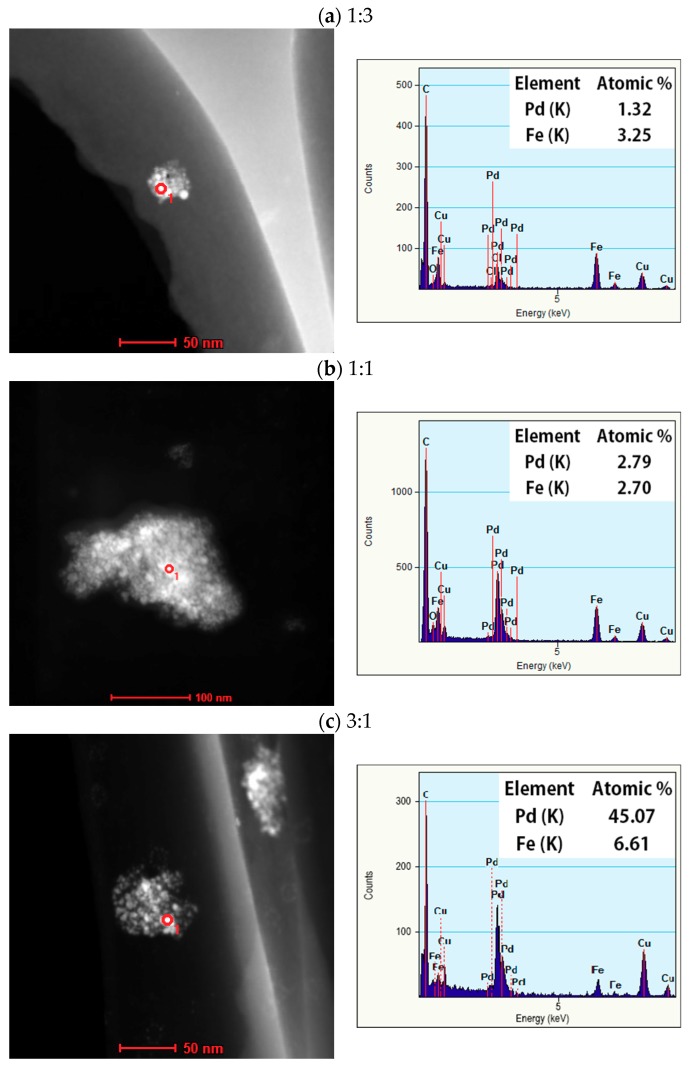
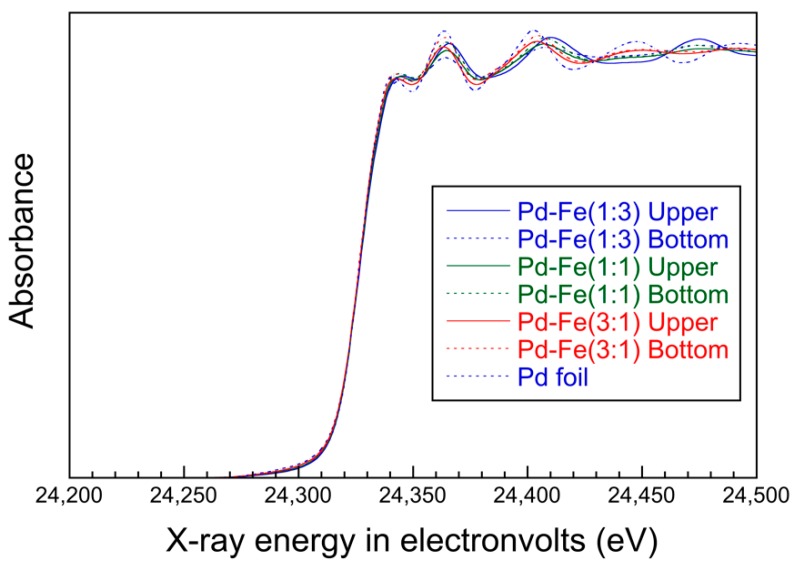
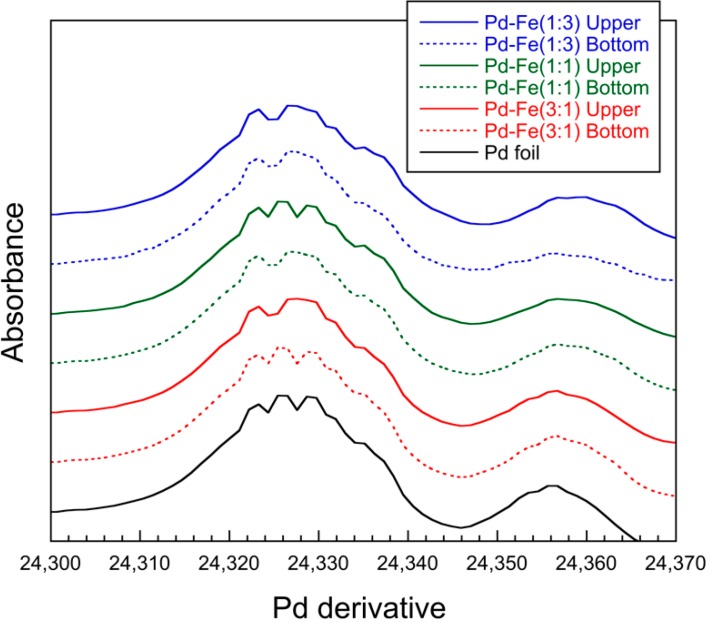
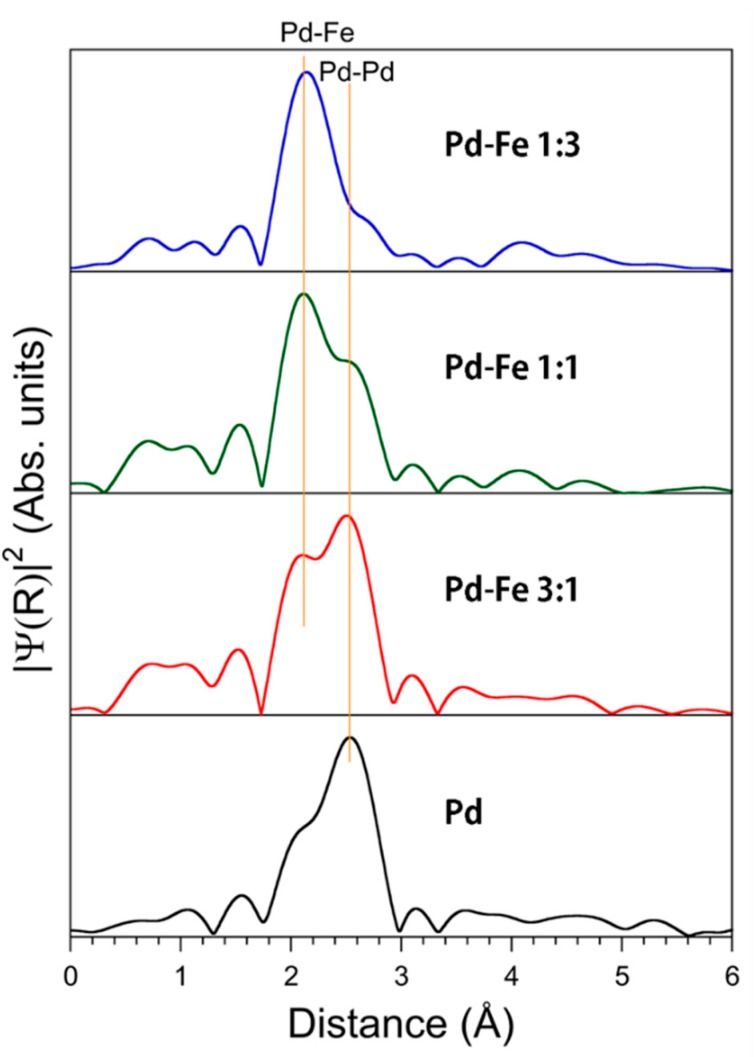
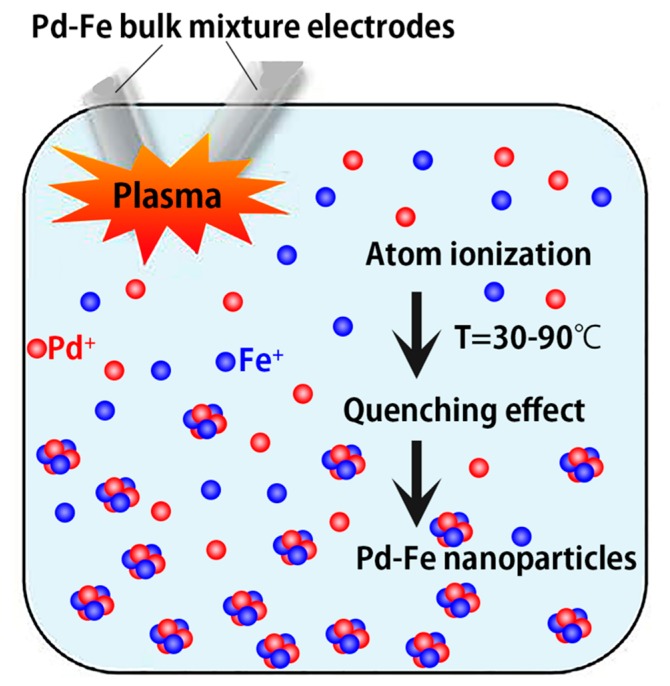
We synthesized Pd-Fe series nanoparticles in solid solution using pulsed plasma in liquid with Pd-Fe bulk mixture electrodes. The Pd-Fe atomic percent ratios were 1:3, 1:1, and 3:1, and the particle size was measured to be less than 10 nm by high-resolution transmission electron microscopy (HR-TEM). The nanoparticles showed face-centered cubic structure. The lattice parameter increased with increasing Pd content and followed Vegard's law, and energy-dispersive X-ray spectra were consistent with the ratios of the starting samples, which showed a solid solution state. The solid solution structure and local structure were confirmed by HR-TEM and X-ray absorption fine structure.

Keywords: Pd-Fe alloy; nanoparticle; pulsed plasma in liquid.


Conflict of interest statement

The authors declare no conflict of interest.

Figures

Figure 1
Figure 1
Schematic of pulsed-plasma-in-liquid method.
Figure 2
Figure 2
Waveform of output current.
Figure 3
Figure 3
XRD patterns of Pd-Fe alloy nanoparticles and of elemental Pd and Fe nanoparticles in upper (a) and bottom (b) samples.
Figure 4
Figure 4
Lattice parameter versus Pd ratio of Pd-Fe alloy nanoparticles and pure Pd (100%) nanoparticles. The Pd-Fe nanoparticles have atomic percent ratios of 1:3, 1:1, and 3:1.
Figure 5
Figure 5
HR-TEM images of upper (a) and bottom (b) 1:1 Pd-Fe sample with particle diameter distribution.
Figure 5
Figure 5
HR-TEM images of upper (a) and bottom (b) 1:1 Pd-Fe sample with particle diameter distribution.
Figure 6
Figure 6
HR-TEM images of upper (a) and bottom (b) 1:1 Pd-Fe alloy nanoparticles with FFT pattern and surface spacing in the region enclosed in red.
Figure 7
Figure 7
HAADF-STEM image and EDX analysis of upper 1:3 (a); 1:1 (b); and 3:1 (c) Pd-Fe alloy nanoparticles.
Figure 8
Figure 8
Normalized XANES of Pd parts of nanoparticles.
Figure 9
Figure 9
Derivative XANES of Pd parts of nanoparticles.
Figure 10
Figure 10
Fourier transforms of the Pd K-edge EXAFS oscillation function k3χ(k). No phase shift corrections are made. The first sets of nearest peaks represent the Pd-Fe and Pd-Pd distances.
Figure 11
Figure 11
Optical emission spectrum from pulsed plasma in ethanol solution with Pd-Fe electrodes.
Figure 12
Figure 12
Illustration of Pd-Fe alloy nanoparticle formation via pulsed plasma in water.

References

    1. Gelatt C.D., Ehrenreich H., Weiss J.A. Transition-metal hydrides: Electronic structure and the heats of formation. Phys. Rev. B. 1978;17:1940–1957. doi: 10.1103/PhysRevB.17.1940. - DOI
    1. Vuillemin J.J., Priestly M.G. De Haas-Van Alphen effect and Fermi surface in palladium. Phys. Rev. Lett. 1965;14:307–309. doi: 10.1103/PhysRevLett.14.307. - DOI
    1. Perkas N., Teo J., Shen S., Wang Z., Highfield J., Zhong Z., Gedanken A. Supported Ru catalysts prepared by two sonication-assisted methods for preferential oxidation of CO in H2. Phys. Chem. Chem. Phys. 2011;13:15690–15698. doi: 10.1039/c1cp21870k. - DOI - PubMed
    1. Ke X., Cui G.-F., Shen P.-K. Stability of Pd-Fe Alloy Catalysts. Wuli Huaxue Xuebao Acta Phys. Chim. Sin. 2009;25:213–217.
    1. Shao Mi., Sasaki K., Adzic R.R. Pd-Fe Nanoparticles as Electrocatalysts for Oxygen Reduction. J. Am. Chem. Soc. 2006;128:3526–3527. doi: 10.1021/ja060167d. - DOI - PubMed

LinkOut - more resources