

Dynamic changes in injured myocardium, very early after acute myocardial infarction, quantified using T1 mapping cardiovascular magnetic resonance
- PMID: 30567572
- PMCID: PMC6300907
- DOI: 10.1186/s12968-018-0506-3
Dynamic changes in injured myocardium, very early after acute myocardial infarction, quantified using T1 mapping cardiovascular magnetic resonance
Abstract
Background: It has recently been suggested that myocardial oedema follows a bimodal pattern early post ST-segment elevation myocardial infarction (STEMI). Yet, water content, quantified using tissue desiccation, did not return to normal values unlike oedema quantified by cardiovascular magnetic resonance (CMR) imaging. We studied the temporal changes in the extent and intensity of injured myocardium using T1-mapping technique within the first week after STEMI.
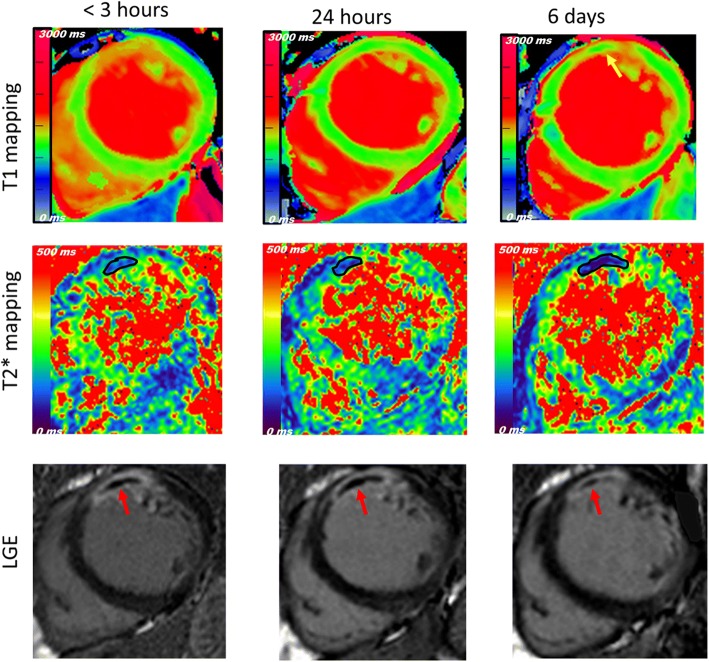
Methods: A first group (n = 31) underwent 3 acute 3 T CMR scans (time-point (TP) < 3 h, 24 h and 6 days), including cine, native shortened modified look-locker inversion recovery T1 mapping, T2* mapping and late gadolinium enhancement (LGE). A second group (n = 17) had a single scan at 24 h with an additional T2-weighted sequence to assess the difference in the extent of area-at-risk (AAR) compared to T1-mapping.
Results: The mean T1 relaxation time value within the AAR of the first group was reduced after 24 h (P < 0.001 for TP1 vs.TP2) and subsequently increased at 6 days (P = 0.041 for TP2 vs.TP3). However, the extent of AAR quantified using T1-mapping did not follow the same course, and no change was detected between TP1&TP2 (P = 1.0) but was between TP2 &TP3 (P = 0.019). In the second group, the extent of AAR was significantly larger on T1-mapping compared to T2-weighted (42 ± 15% vs. 39 ± 15%, P = 0.025). No change in LGE was detected while microvascular obstruction and intra-myocardial haemorrhage peaked at different time points within the first week of reperfusion.
Conclusion: The intensity of oedema post-STEMI followed a bimodal pattern; while the extent of AAR did not track the same course. This discrepancy has implications for use of CMR in this context and may explain the previously reported disagreement between oedema quantified by imaging and tissue desiccation.
Keywords: Area at risk; STEMI; T1-mapping.
Conflict of interest statement
Ethics approval and consent to participate
The study protocol was approved by the local ethics committee and conducted in accordance with the Declaration of Helsinki. All participants provided written informed consent.
Consent for publication
Not applicable.
Competing interests
The authors declare that they have no competing interests.
Publisher’s Note
Springer Nature remains neutral with regard to jurisdictional claims in published maps and institutional affiliations.
Figures


References
-
- Windecker S, Kolh P, Alfonso F, et al. 2014 ESC/EACTS guidelines on myocardial revascularization: the task force on myocardial revascularization of the European Society of Cardiology (ESC) and the European Association for Cardio-Thoracic Surgery (EACTS) developed with the special contribution of the European Association of Percutaneous Cardiovascular Interventions (EAPCI) Eur Heart J. 2014;35:2541–2619. doi: 10.1093/eurheartj/ehu278. - DOI - PubMed
-
- Aletras AH, Tilak GS, Natanzon A, et al. Retrospective determination of the area at risk for reperfused acute myocardial infarction with T2-weighted cardiac magnetic resonance imaging: histopathological and displacement encoding with stimulated echoes (DENSE) functional validations. Circulation. 2006;113:1865–1870. doi: 10.1161/CIRCULATIONAHA.105.576025. - DOI - PubMed
