. 2019 Feb 4;218(2):632-643.
doi: 10.1083/jcb.201807124. Epub 2018 Dec 19.

Detyrosinated microtubules spatially constrain lysosomes facilitating lysosome-autophagosome fusion

Affiliations

Detyrosinated microtubules spatially constrain lysosomes facilitating lysosome-autophagosome fusion

Nitin Mohan et al. J Cell Biol. .

Abstract

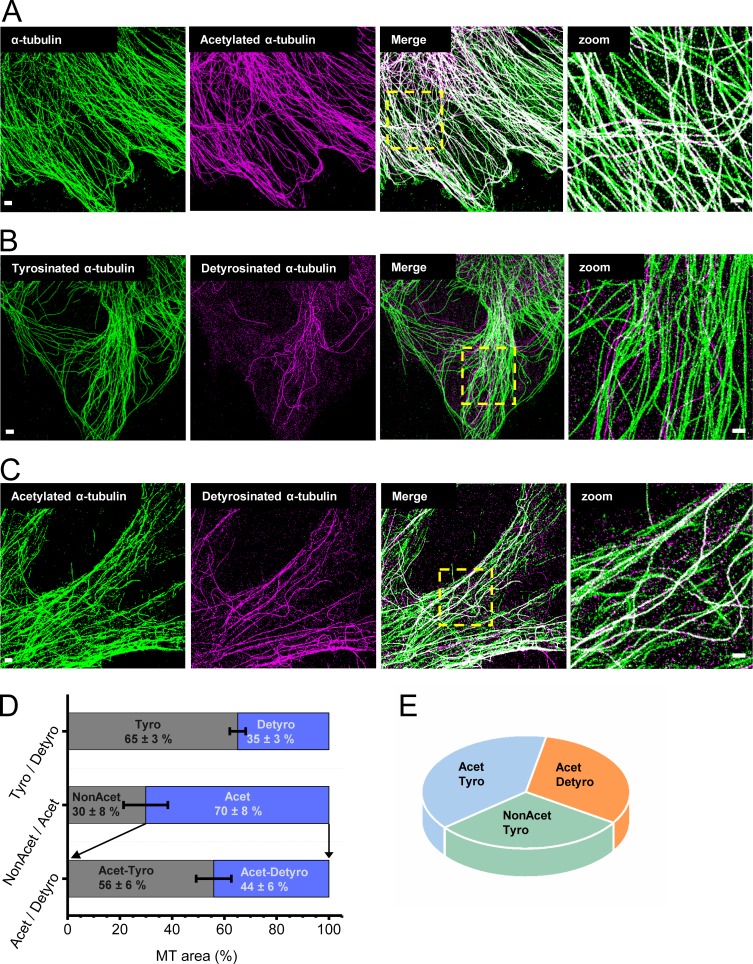
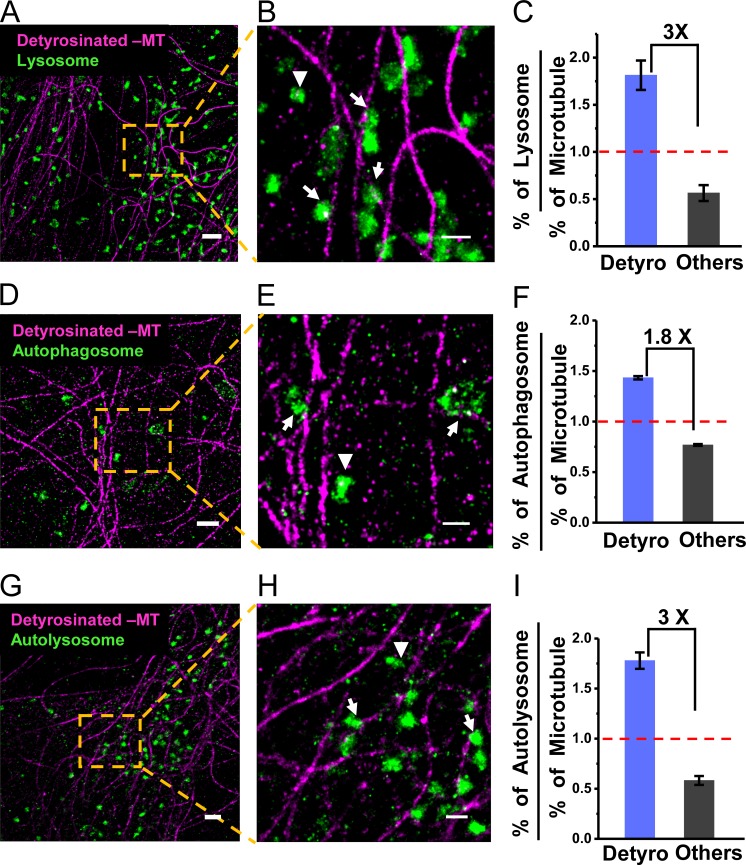
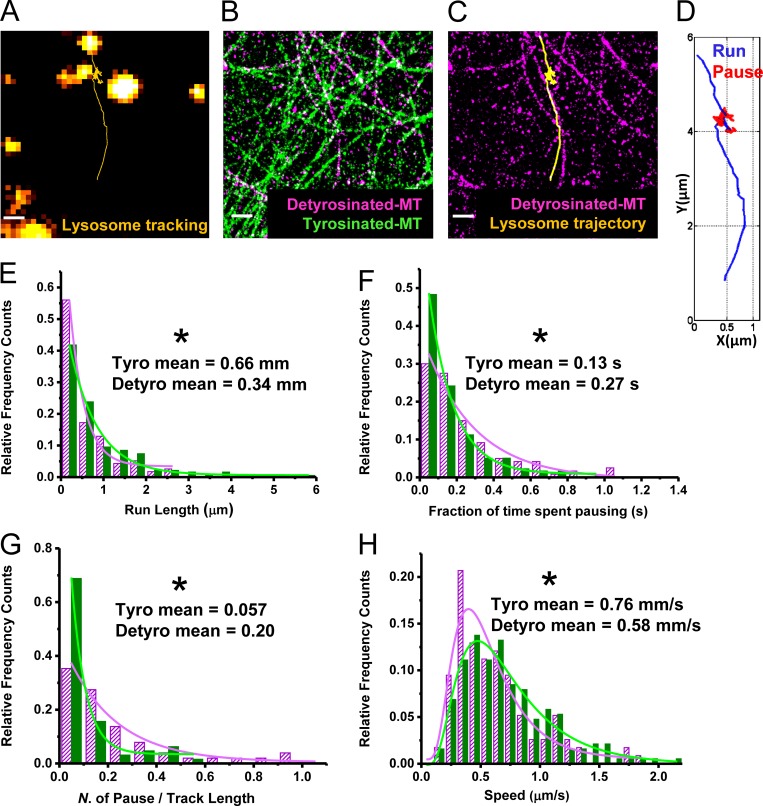
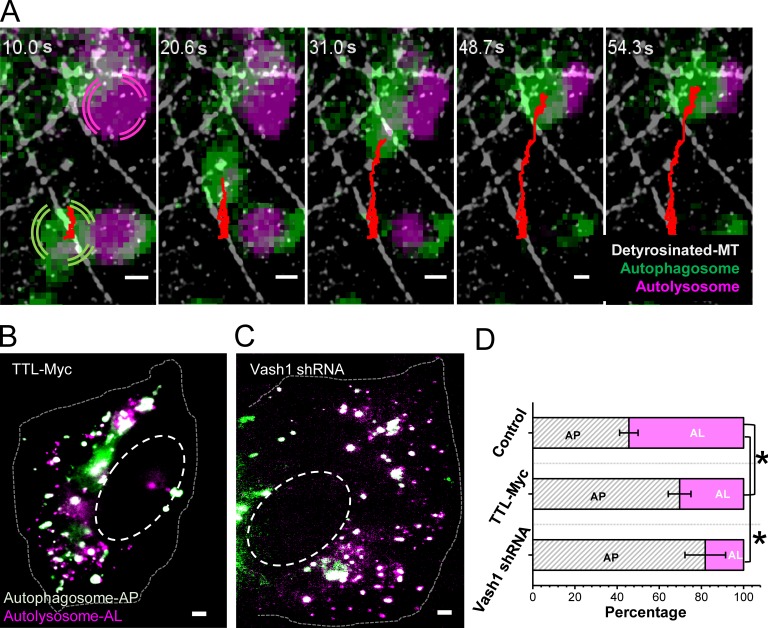
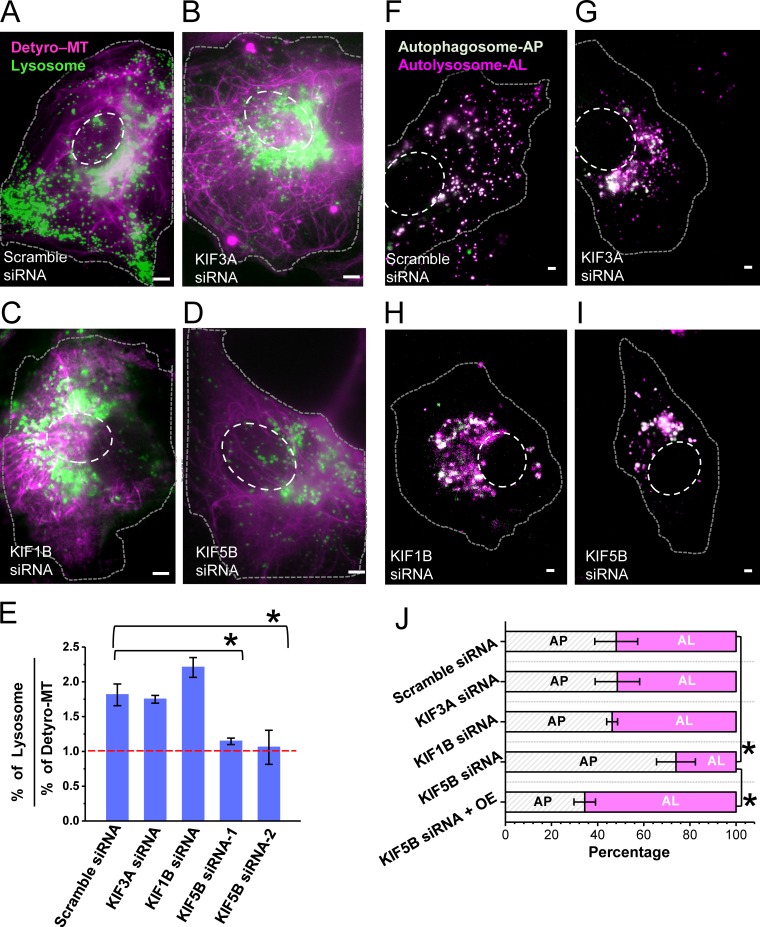
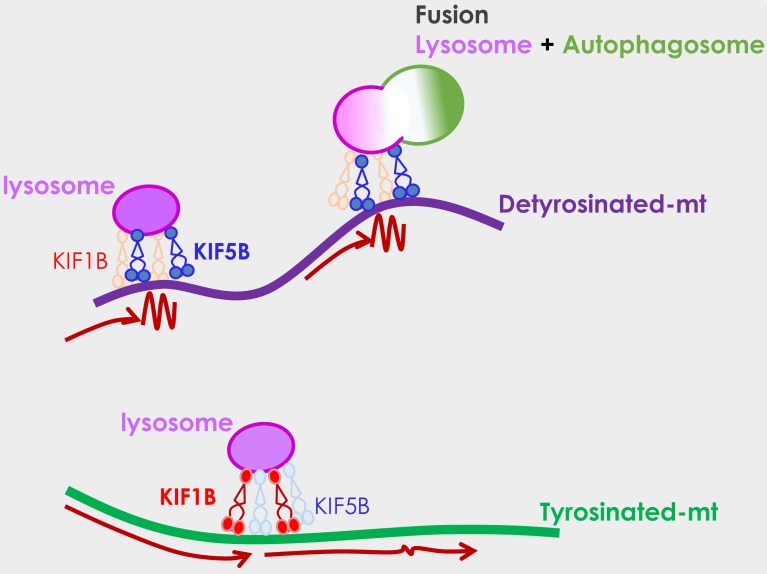
Microtubule post-translational modifications impart functional diversity to microtubules by affecting their dynamics, organization, and interaction with proteins. Using super-resolution microscopy, we show that only a small subpopulation of microtubules are detyrosinated in epithelial cells, while acetylated and tyrosinated microtubules comprise the majority of all microtubules. Surprisingly, lysosomes are enriched by approximately threefold on detyrosinated microtubules. Further, their motility on detyrosinated microtubules is impaired, showing shorter runs and more frequent and longer pauses. Lysosome enrichment is mediated through a kinesin-1-dependent mechanism, since knocking down this motor abolishes enrichment. Finally, correlative live-cell and super-resolution microscopy showed that lysosomes interact with autophagosomes on detyrosinated microtubules. Removal of detyrosinated microtubules or knockdown of kinesin-1 leads to a decrease in the percentage of autolysosomes, a fusion intermediate of autophagosomes and lysosomes. Taken together, our data reveal a new role of detyrosinated microtubules as hubs that spatially concentrate lysosomes on a small subset of microtubules and facilitate their interaction and fusion with autophagosomes to initiate autophagy.


Figures

Figure 1.
Figure 1.
Detyrosinated microtubules form a small subset of all microtubules. (A–C) Two-color super-resolution images of total α-tubulin (green), acetylated α-tubulin (magenta), and overlay (A); tyrosinated α-tubulin (green), detyrosinated α-tubulin (magenta), and overlay (B); and acetylated α-tubulin (green), detyrosinated α-tubulin (magenta), and overlay (C). (D) Bar plots show the proportion of detyrosinated α-tubulin, acetylated α-tubulin, and double-modified α-tubulin containing both acetylation and detyrosination marks quantified as the percentage of total microtubule (MT) area corresponding to these PTMs. The bars indicate the median, and the error bar is the SD, analyzed for 10 different cells in each case. (E) Pie diagram showing the major subpopulations of modified microtubules that could be identified from the super-resolution images. Bars are 2 µm (left) and 500 nm (Zoom).
Figure 2.
Figure 2.
Lysosomes, autophagosomes, and autolysosomes are enriched on detyrosinated microtubules. Two-color super-resolution images showing lysosomes (green; A and B), autophagosomes (green; D and E), and autolysosomes (green; G and H) together with detyrosinated microtubules (magenta). Arrows and arrowheads indicate examples of lysosomal, autophagosomal, or autolysosomal compartments, associated and not associated with detyrosinated microtubules, respectively. Quantification of the percentage of lysosomes (C), autophagosomes (F), and autolysosomes (I) associated with detyrosinated or other microtubule subpopulations normalized to the percentage of the respective microtubule subpopulations. The bars and error bars represent the median and SD, respectively, for three different cells analyzed in each case. The total number of lysosomes analyzed, n = 1,316 (on Detyro = 818, others = 498); for autophagosomes, n = 210 (on Detyro = 105, others = 105); and for autolysosomes, n = 302 (on Detyro = 185, others = 117). Bars, 1 µm for A, D, and G, and 500 nm for B, E, and H.
Figure 3.
Figure 3.
Lysosomes show hindered motility on detyrosinated microtubules. (A) Trajectory (yellow) shows the motility of a lysosome (orange). (B) Super-resolution image of the same region showing detyrosinated α-tubulin (magenta) and tyrosinated α-tubulin (green). (C) Lysosome trajectory from A overlaid with the super-resolution image of detyrosinated α-tubulin from B. (D) Lysosome trajectory color coded to indicate the processive runs (blue) and the nonprocessive pauses (red). (E–H) Comparison of run length (E), fraction of time spent pausing (F), number of pauses per total track length (G), and speed (H) for lysosomes moving on detyrosinated (magenta) and tyrosinated (green) microtubules. Total number of tracks analyzed, n = 64 for tyrosinated and n = 51 for detyrosinated, from five different cells. The values indicate the mean and the SD. The asterisk indicates the statistical significance of the difference in the motility parameter of the tyrosinated versus the detyrosinated populations, determined by two-tailed two-sample t test (*, P < 0.05). Bars, 500 nm.
Figure 4.
Figure 4.
Heterotypic interactions between autophagosomes and lysosomes happen on detyrosinated microtubules. (A) Snapshots from a time-lapse video where an autophagosome (green) moves toward and interacts with an autolysosome (magenta) on detyrosinated microtubules (white) in cells expressing the tandem fluorescent-tagged LC3B plasmid. The autophagosome trajectory is shown in red. Bars, 500 nm. (B–D) Wide-field images showing autophagosomes (white) and autolysosomes (magenta) in starved cells transiently overexpressing tyrosine ligase enzyme TTL (B) or starved cells transiently expressing Vasohibin 1 shRNA (C). Bar, 2 µm. (D) Quantification of the percentage of autophagosomes (AP) and autolysosomes (AL) in control starved cells (Fig. S2 G) and for the conditions corresponding to B and C. The bars indicate the median, and the error bar is the SD analyzed for 10 different cells in each case. The asterisk indicates the statistical significance for a two-tailed two-sample t test (*, P < 0.05).
Figure 5.
Figure 5.
KIF5B knockdown abolishes the enrichment of lysosomes on detyrosinated microtubules and impacts lysosome–autophagosome fusion. (A–D) Conventional epifluorescence images of cells stably expressing LAMP-2 mCherry, transiently transfected with scrambled siRNA (A), KIF3A siRNA (B), KIF1B siRNA (C), and KIF5B siRNA (D), followed by immunofluorescence for detyrosinated microtubules (magenta). Lysosomes (green) in scrambled siRNA–transfected cells are distributed throughout the cell including the perinuclear region and periphery, whereas lysosomes in cells transfected with KIF3A, KIF1B, and KIF5B siRNA cluster at the perinuclear region with very few lysosomes at the cell periphery. (E) Percentage of lysosomes associated with detyrosinated microtubules normalized to the overall percentage of detyrosinated microtubules, quantified from super-resolution images. The bars indicate the median, and the error bar is the SD for three different cells analyzed in each case. The total number of lysosomes analyzed for scrambled siRNA, n = 355 (on Detyro = 223, others = 132); KIF3A siRNA, n = 332 (on Detyro = 201, others = 131); KIF1B siRNA, n = 396 (on Detyro = 291, others = 105); and KIF5B siRNA, n = 312 (on Detyro = 124, others = 188). Bar, 2 µm. (F–I) Conventional epifluorescence images of cells transiently expressing LC3B-GFP-RFP, cotransfected with scrambled siRNA (F), KIF3A siRNA (G), KIF1B siRNA (H), and KIF5B siRNA (I). (J) Quantification of the percentage of autophagosomes and autolysosomes for 10 different cells in each case. The asterisk indicates the statistical significance for a two-tailed two-sample t test (*, P < 0.05). OE, overexpressing KIF5B.
Figure 6.
Figure 6.
Proposed model. Lysosomes (magenta) and autophagosomes (green) are enriched on a small subset of microtubules that are detyrosinated, where they can encounter each other, interact, and undergo fusion. KIF5B preferentially biases the localization of lysosomes to detyrosinated microtubules, where their mobility is hindered (wiggly line compared with long arrows). KIF1B, on the other hand, is more involved in lysosome motility along tyrosinated microtubules. The potential preference of KIF5B for detyrosinated microtubules and/or its hindered motility on detyrosinated microtubules may help concentrate lysosomes on this small population of microtubules, enabling their efficient fusion with autophagosomes to initiate autophagy.

References

    1. Aillaud C., Bosc C., Peris L., Bosson A., Heemeryck P., Van Dijk J., Le Friec J., Boulan B., Vossier F., Sanman L.E., et al. . 2017. Vasohibins/SVBP are tubulin carboxypeptidases (TCPs) that regulate neuron differentiation. Science. 358:1448–1453. 10.1126/science.aao4165 - DOI - PubMed
    1. Bálint Š., Verdeny Vilanova I., Sandoval Álvarez Á., and Lakadamyali M.. 2013. Correlative live-cell and superresolution microscopy reveals cargo transport dynamics at microtubule intersections. Proc. Natl. Acad. Sci. USA. 110:3375–3380. 10.1073/pnas.1219206110 - DOI - PMC - PubMed
    1. Barisic M., Silva e Sousa R., Tripathy S.K., Magiera M.M., Zaytsev A.V., Pereira A.L., Janke C., Grishchuk E.L., and Maiato H.. 2015. Mitosis. Microtubule detyrosination guides chromosomes during mitosis. Science. 348:799–803. 10.1126/science.aaa5175 - DOI - PMC - PubMed
    1. Barlan K., Lu W., and Gelfand V.I.. 2013. The microtubule-binding protein ensconsin is an essential cofactor of kinesin-1. Curr. Biol. 23:317–322. 10.1016/j.cub.2013.01.008 - DOI - PMC - PubMed
    1. Bates M., Huang B., Dempsey G.T., and Zhuang X.. 2007. Multicolor super-resolution imaging with photo-switchable fluorescent probes. Science. 317:1749–1753. 10.1126/science.1146598 - DOI - PMC - PubMed

Publication types

MeSH terms