Clinical Trial
. 2019 Jan 31;133(5):436-445.
doi: 10.1182/blood-2018-09-875732. Epub 2018 Dec 19.

Phase 1b trial of an ibrutinib-based combination therapy in recurrent/refractory CNS lymphoma

Affiliations
Clinical Trial

Phase 1b trial of an ibrutinib-based combination therapy in recurrent/refractory CNS lymphoma

Christian Grommes et al. Blood. .

Abstract

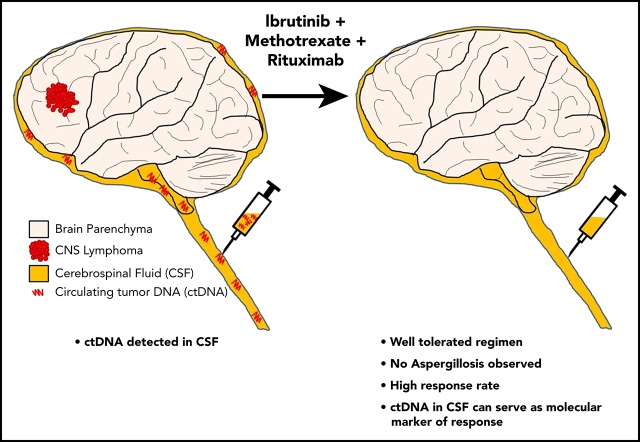
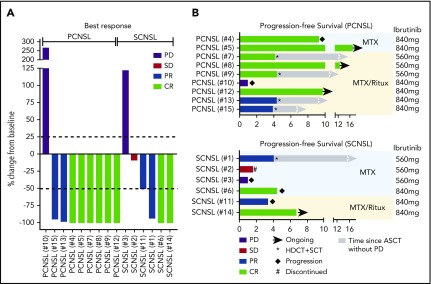
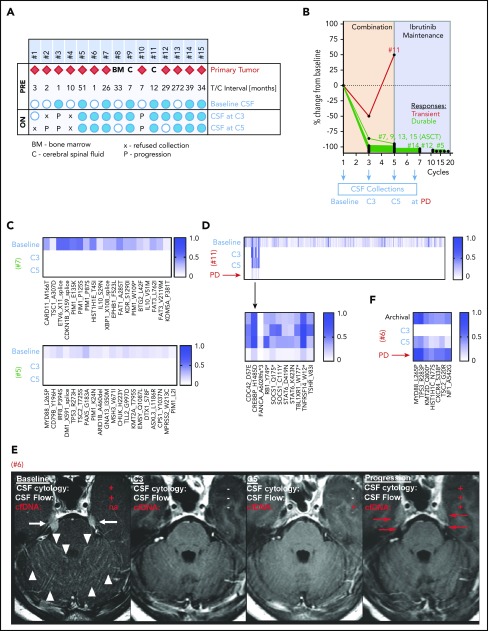
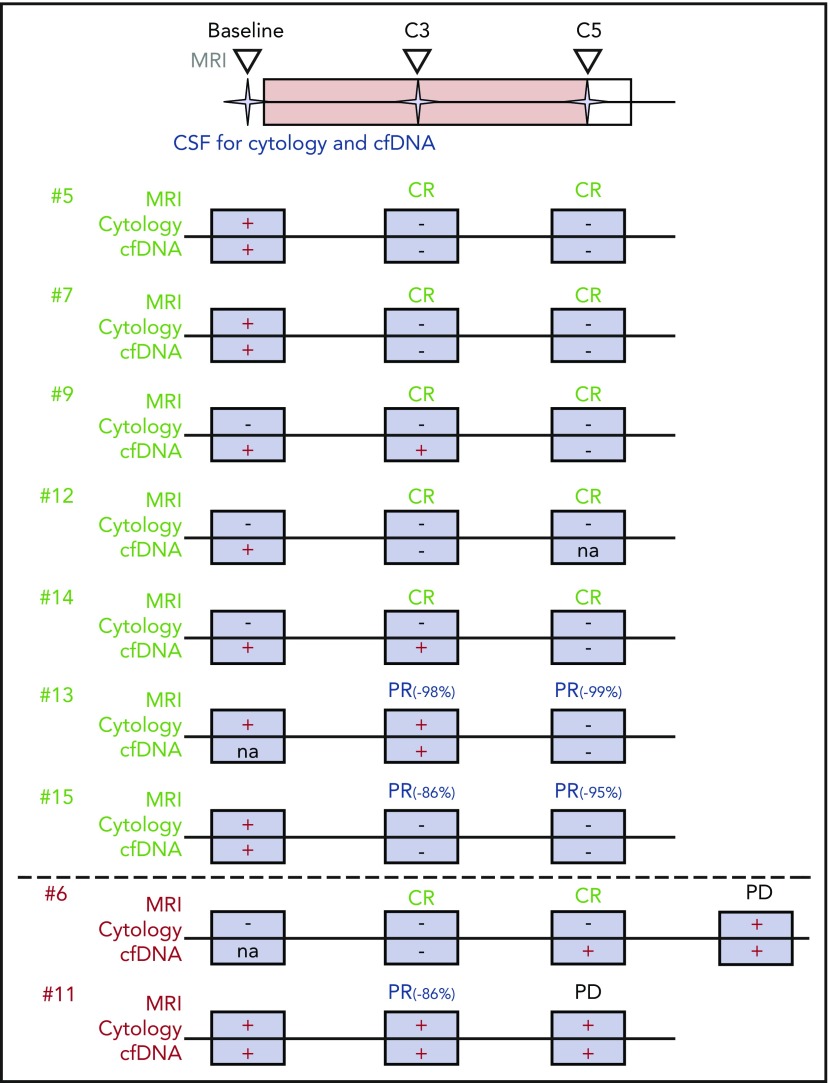
Ibrutinib is a first-in-class inhibitor of Bruton tyrosine kinase (BTK) and has shown single-agent activity in recurrent/refractory central nervous system (CNS) lymphoma. Clinical responses are often transient or incomplete, suggesting a need for a combination therapy approach. We conducted a phase 1b clinical trial to explore the sequential combination of ibrutinib (560 or 840 mg daily dosing) with high-dose methotrexate (HD-MTX) and rituximab in patients with CNS lymphoma (CNSL). HD-MTX was given at 3.5 g/m2 every 2 weeks for a total of 8 doses (4 cycles; 1 cycle = 28 days). Ibrutinib was held on days of HD-MTX infusion and resumed 5 days after HD-MTX infusion or after HD-MTX clearance. Single-agent daily ibrutinib was administered continuously after completion of induction therapy until disease progression, intolerable toxicity, or death. We also explored next-generation sequencing of circulating tumor DNA (ctDNA) in cerebrospinal fluid (CSF) before and during treatment. The combination of ibrutinib, HD-MTX, and rituximab was tolerated with an acceptable safety profile (no grade 5 events, 3 grade 4 events). No dose-limiting toxicity was observed. Eleven of 15 patients proceeded to maintenance ibrutinib after completing 4 cycles of the ibrutinib/HD-MTX/rituximab combination. Clinical responses occurred in 12 of 15 patients (80%). Sustained tumor responses were associated with clearance of ctDNA from the CSF. This trial was registered at www.clinicaltrials.gov as #NCT02315326.


Conflict of interest statement

Conflict-of-interest disclosure: C.G. has acted as a consultant for BTH and Kite. E.I.P. has acted as an advisor for AstraZeneca. A.L. has received research funding from Nantomics and Bristol-Myers Squibb. K.S.P. owns stock in Johnson & Johnson, Pfizer, Viking Therapeutics, and Catalyst Biotech. L.M.D. has acted as an advisor for Sapience Therapeutics, Tocagen, BTG International, Roche, and Syndax. M.F.B. has acted as an advisor for Roche and has received research funding from Illumina. I.K.M. has received research funding from General Electric, Amgen, and Lilly; has acted as an advisor for Agios, Puma Biotechnology, and Debiopharm Group; and has received honoraria from Roche for a presentation. The remaining authors declare no competing financial interests.

Figures

None
Graphical abstract
Figure 1.
Figure 1.
Clinical response to ibrutinib-based combination therapy in CNSL. (A) Best response to ibrutinib-based combination therapy. Displayed is the change in target lesion diameter from baseline (%) by MRI or clearance of malignant cells in CSF; negative values indicate tumor shrinkage. Eight of 9 (89%) PCNSL patients and 4 of 6 (67%) SCNSL patients responded to ibrutinib-based combination therapy. (B) PFS in patients with PCNSL (upper panel) and SCNSL (lower panel).
Figure 2.
Figure 2.
Molecular response to ibrutinib-based therapy. (A) Biospecimen collection for all patients enrolled in our study. Included is the time between the tumor and CSF collection (T/C interval). Red diamonds indicate primary tumor tissue that was collected and sequenced (BM: diagnosed by bone marrow biopsy; C: diagnosed by CSF cytology). X, patient refused CSF collection. P, patient off study for disease progression. Blue circles represent sequenced CSF samples, and white circles represent samples with insufficient volume to perform sequencing. (B) Imaging was performed at baseline and at C3 and C5 in 9 patients. Shown is the spider plot of patients with measurable disease, 1 of whom had disease progression after an initial response to therapy (#11) and 7 patients (#5, #7, #9, #12, #13, #14, #15) had a PR > 90% or CRs on MRI. (C) Heat maps of the variant allelic frequencies of all of the mutations present in CSF collected before treatment initiation (baseline), during ibrutinib-based combination therapy (C3, C5), and at progression (PD) in representative patients with sustained response demonstrating a “clearance” of tumor DNA (for all CSF profiles, see supplemental Figure 6). Variant allelic frequency scale = 0 (white) or 1 (dark blue). (D) Heat map of the variant allelic frequencies (baseline, C3, C5, and at progression [PD]) and early progression, demonstrating a persistent clone (#11). (E) Patient with nonmeasurable leptomeningeal disease on MRI (T1 postcontrast sequences) and CSF (cytology and flow cytometry) at baseline. After 2 cycles of study therapy, the MRI changes resolved. No malignant cells and no ctDNA was detectable in the CSF (C3). After completion of the induction therapy (C5), the brain MRI and CSF (cytology and flow cytometry) continued to show a response, whereas ctDNA was detectable in the CSF. Ultimately, the patient developed progression of disease on MRI, CSF cytology, and CSF flow cytometry after 1 month of maintenance ibrutinib. White arrowheads, leptomeningeal involvement in the cerebellar folia; white arrows, leptomeningeal involvement of both trigeminal nerves; red arrows, recurrent leptomeningeal disease affecting both trigeminal nerves. (F) Heat map of the variant allelic frequencies in a case of early progression with reemergence of genetic alterations (#6). Variant allelic frequency scale = 0 (white) or 1 (dark blue).
Figure 3.
Figure 3.
Integration of clinical and molecular response assessment. Conventional treatment response assessment using MRI and cytology is combined with genomic testing of ctDNA in CSF. CSF and imaging were performed at baseline prior to treatment initiation and at C3 and C5. Shown are patients with serial CSF collections and their response to study treatment using MRI, cytology, and ctDNA. Patient #6 had radiographic progression of disease at cycle 7.

References

    1. Mendez JS, Ostrom QT, Gittleman H, et al. . The elderly left behind - changes in survival trends of primary central nervous system lymphoma over the past 4 decades. Neuro-oncol. 2018;20(5):687-694. - PMC - PubMed
    1. Grommes C, DeAngelis LM. Primary CNS lymphoma. J Clin Oncol. 2017;35(21):2410-2418. - PMC - PubMed
    1. Grommes C, Pastore A, Palaskas N, et al. . Ibrutinib unmasks critical role of Bruton tyrosine kinase in primary CNS lymphoma. Cancer Discov. 2017;7(9):1018-1029. - PMC - PubMed
    1. Nakamura T, Tateishi K, Niwa T, et al. . Recurrent mutations of CD79B and MYD88 are the hallmark of primary central nervous system lymphomas. Neuropathol Appl Neurobiol. 2016;42(3):279-290. - PubMed
    1. Braggio E, McPhail ER, Macon W, et al. . Primary central nervous system lymphomas: a validation study of array-based comparative genomic hybridization in formalin-fixed paraffin-embedded tumor specimens. Clin Cancer Res. 2011;17(13):4245-4253. - PMC - PubMed

Publication types

MeSH terms

Associated data