. 2019 Mar 5;93(6):e02017-18.
doi: 10.1128/JVI.02017-18. Print 2019 Mar 15.

Resistance to Second-Generation HIV-1 Maturation Inhibitors

Affiliations

Resistance to Second-Generation HIV-1 Maturation Inhibitors

Emiko Urano et al. J Virol. .

Abstract

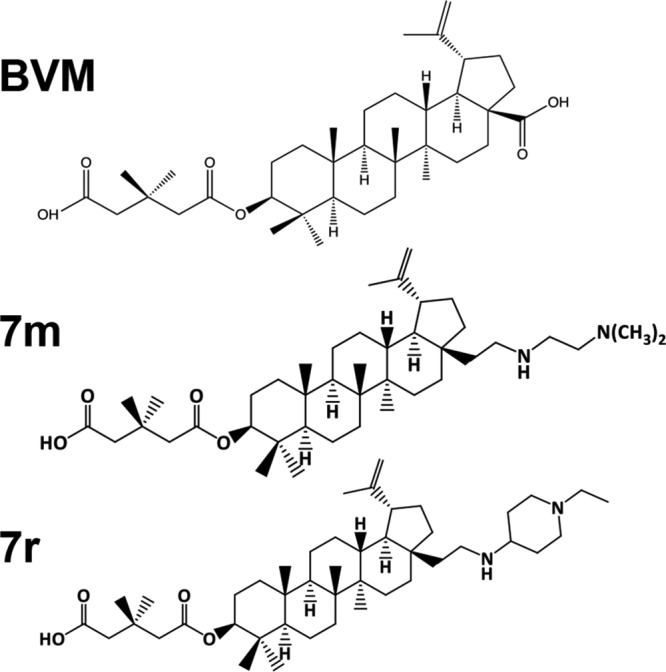
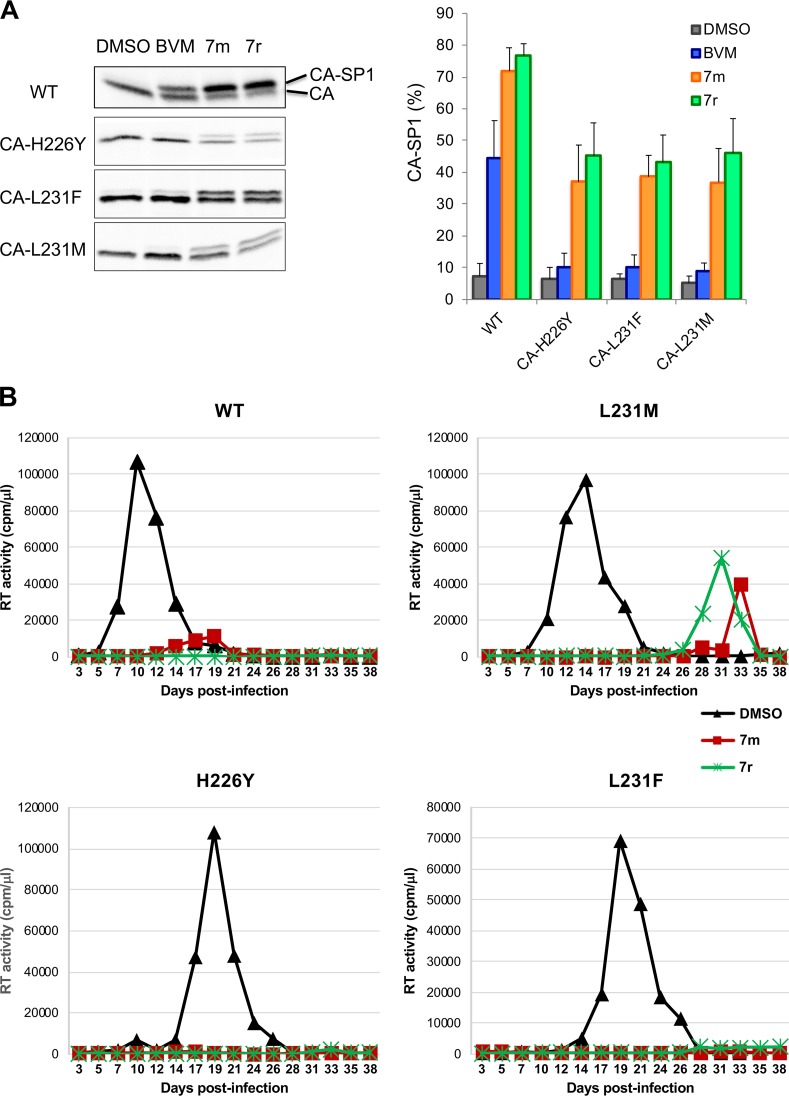
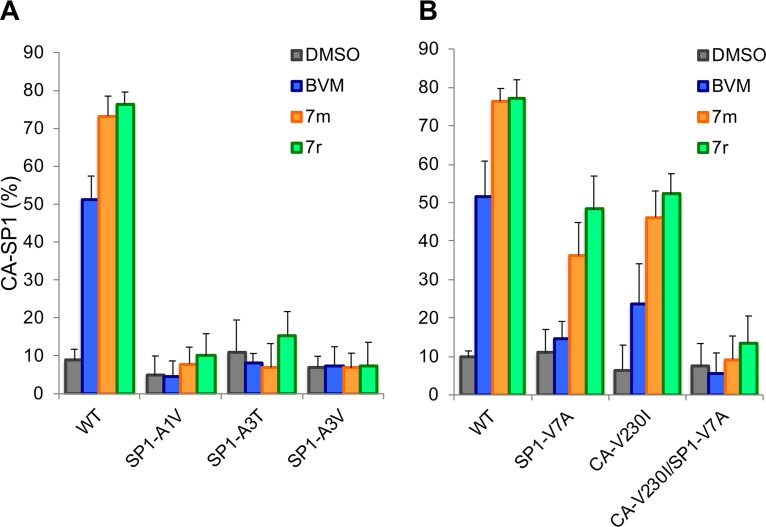
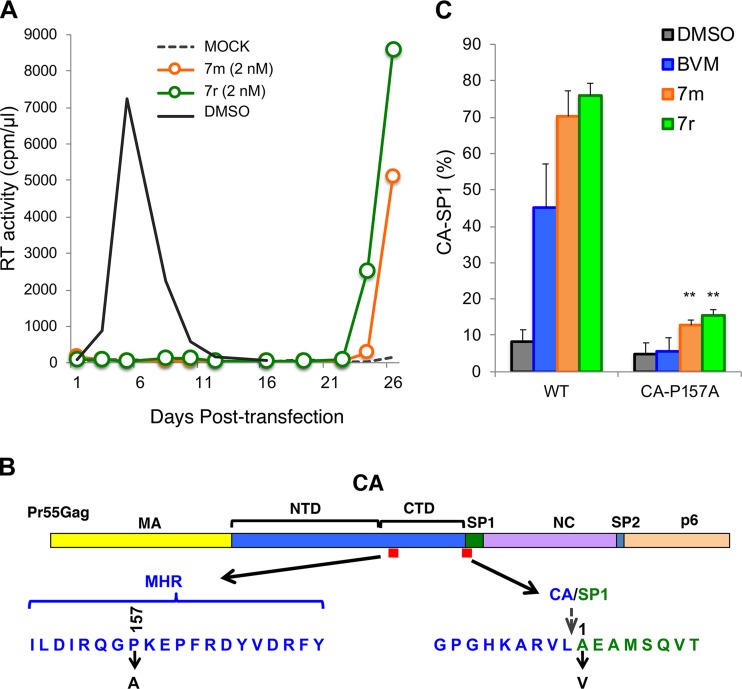
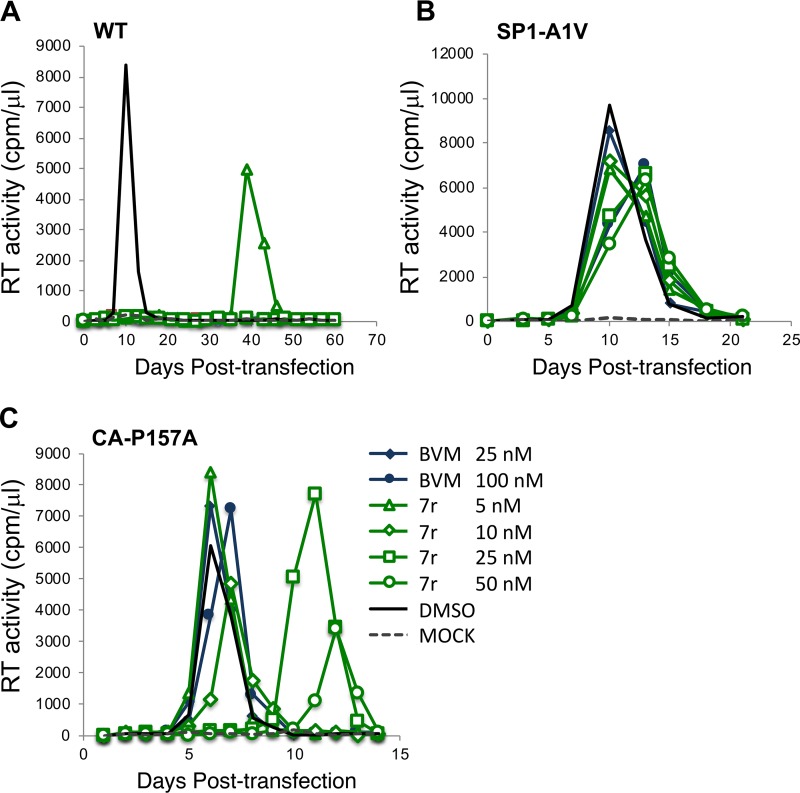
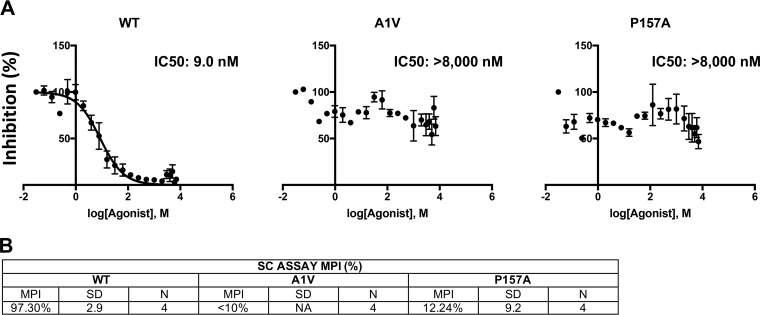
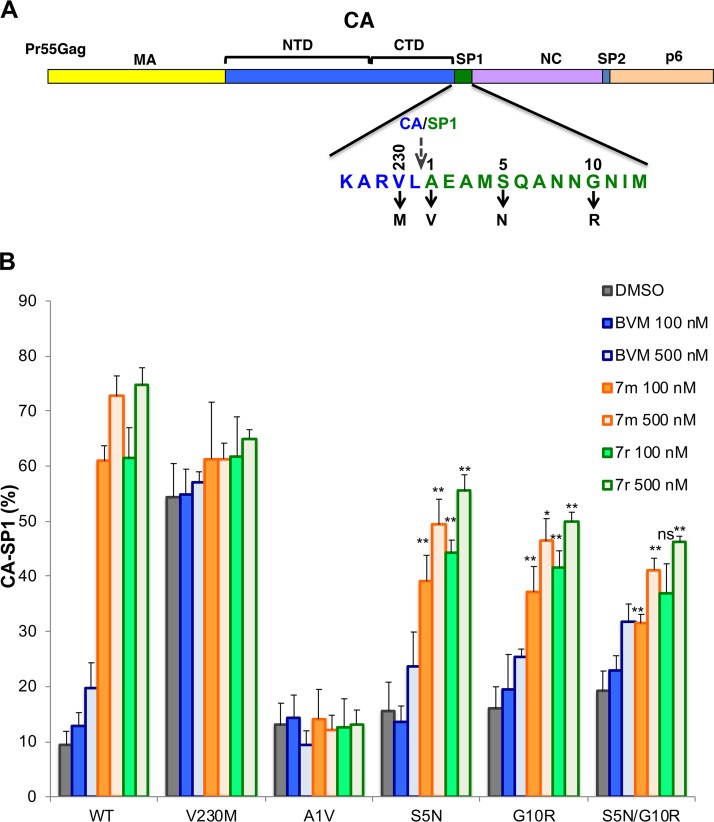
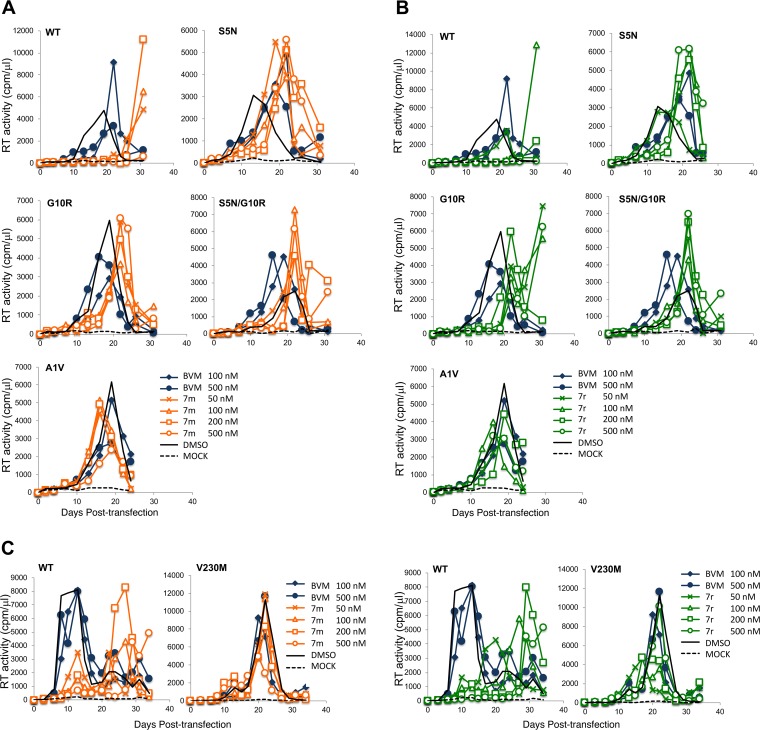
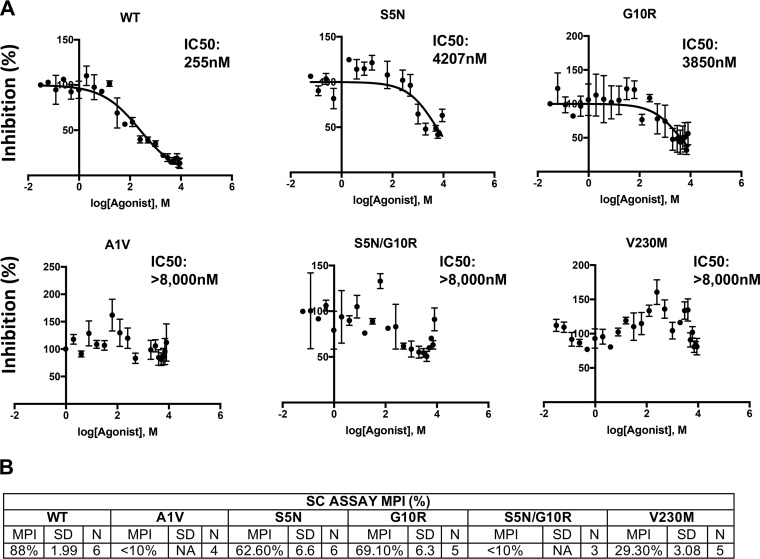
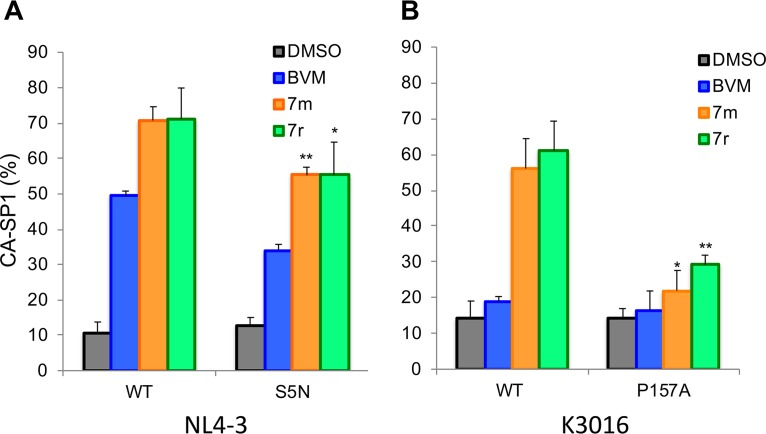
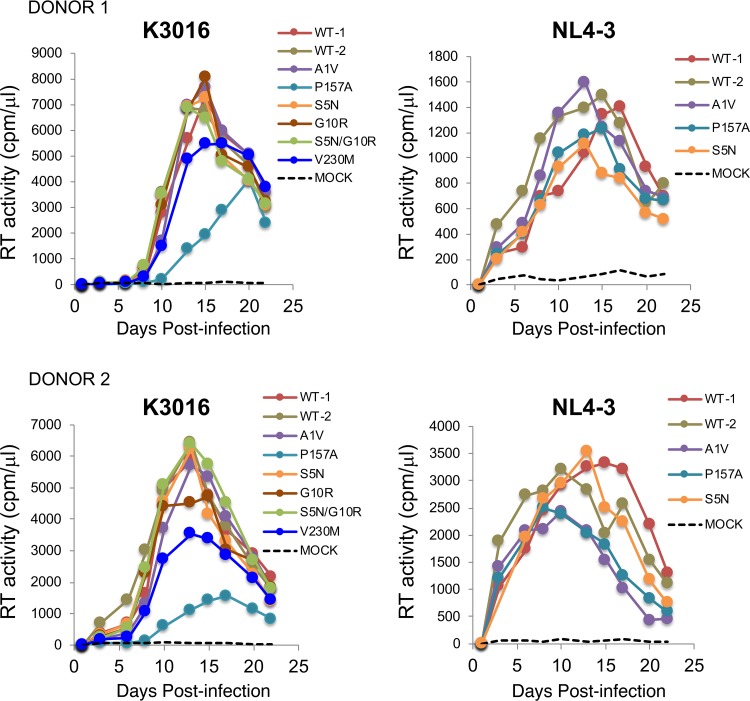
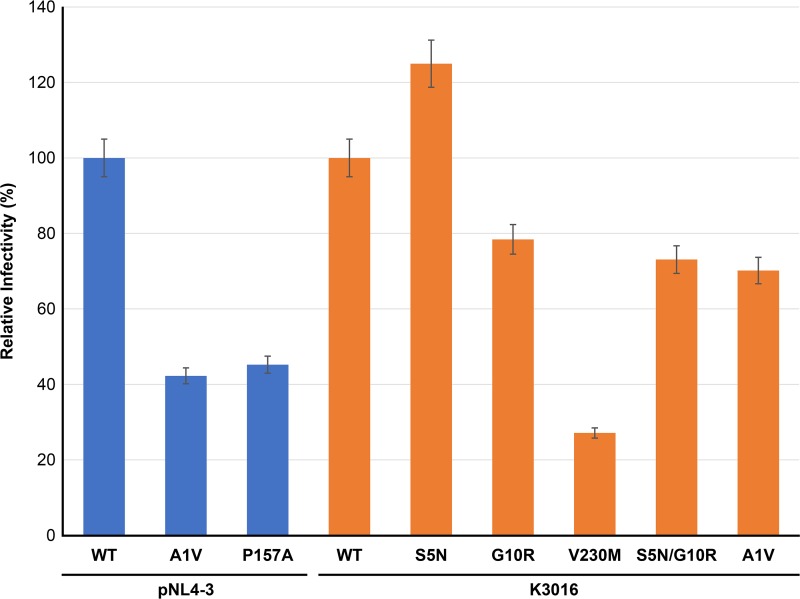
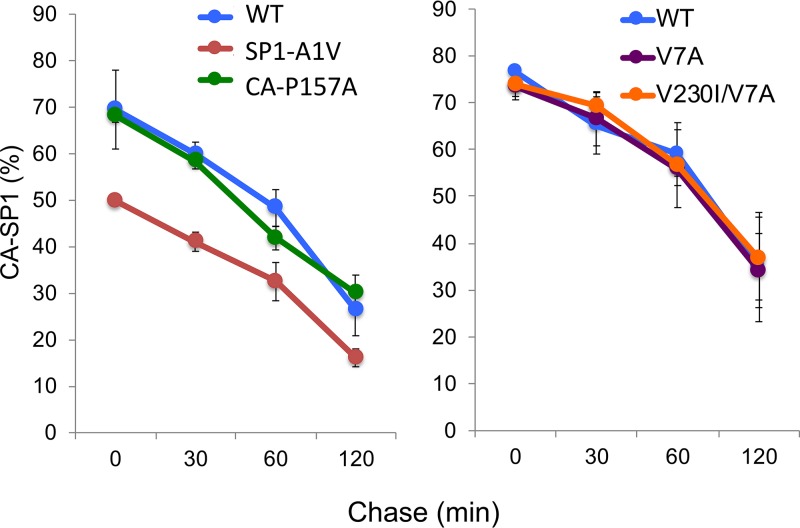
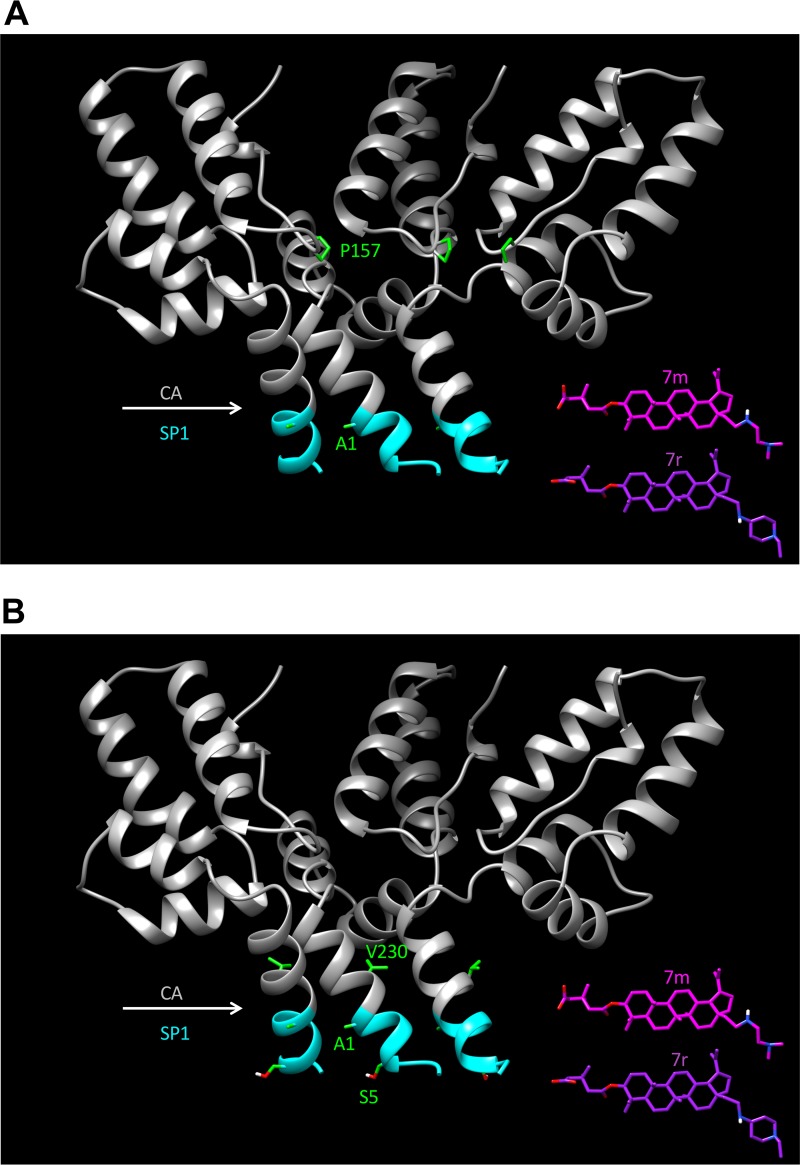
A betulinic acid-based compound, bevirimat (BVM), inhibits HIV-1 maturation by blocking a late step in protease-mediated Gag processing: the cleavage of the capsid-spacer peptide 1 (CA-SP1) intermediate to mature CA. Previous studies showed that mutations conferring resistance to BVM cluster around the CA-SP1 cleavage site. Single amino acid polymorphisms in the SP1 region of Gag and the C terminus of CA reduced HIV-1 susceptibility to BVM, leading to the discontinuation of BVM's clinical development. We recently reported a series of "second-generation" BVM analogs that display markedly improved potency and breadth of activity relative to the parent molecule. Here, we demonstrate that viral clones bearing BVM resistance mutations near the C terminus of CA are potently inhibited by second-generation BVM analogs. We performed de novo selection experiments to identify mutations that confer resistance to these novel compounds. Selection experiments with subtype B HIV-1 identified an Ala-to-Val mutation at SP1 residue 1 and a Pro-to-Ala mutation at CA residue 157 within the major homology region (MHR). In selection experiments with subtype C HIV-1, we identified mutations at CA residue 230 (CA-V230M) and SP1 residue 1 (SP1-A1V), residue 5 (SP1-S5N), and residue 10 (SP1-G10R). The positions at which resistance mutations arose are highly conserved across multiple subtypes of HIV-1. We demonstrate that the mutations confer modest to high-level maturation inhibitor resistance. In most cases, resistance was not associated with a detectable increase in the kinetics of CA-SP1 processing. These results identify mutations that confer resistance to second-generation maturation inhibitors and provide novel insights into the mechanism of resistance.IMPORTANCE HIV-1 maturation inhibitors are a class of small-molecule compounds that block a late step in the viral protease-mediated processing of the Gag polyprotein precursor, the viral protein responsible for the formation of virus particles. The first-in-class HIV-1 maturation inhibitor bevirimat was highly effective in blocking HIV-1 replication, but its activity was compromised by naturally occurring sequence polymorphisms within Gag. Recently developed bevirimat analogs, referred to as "second-generation" maturation inhibitors, overcome this issue. To understand more about how these second-generation compounds block HIV-1 maturation, here we selected for HIV-1 mutants that are resistant to these compounds. Selections were performed in the context of two different subtypes of HIV-1. We identified a small set of mutations at highly conserved positions within the capsid and spacer peptide 1 domains of Gag that confer resistance. Identification and analysis of these maturation inhibitor-resistant mutants provide insights into the mechanisms of resistance to these compounds.

Keywords: antiretroviral; human immunodeficiency virus; retrovirus; virus assembly; virus maturation.


Figures

FIG 1
FIG 1
Structures of BVM and second-generation MIs 7m and 7r (36).
FIG 2
FIG 2
Second-generation MIs can inhibit CA-SP1 processing of BVM-resistant C-terminal CA mutants. (A) CA-SP1 processing data for CA-H226Y, L231F, and L231M C-terminal CA mutants, with quantification of percent CA-SP1 accumulation indicated in the graph, using the radiolabeling-based CA-SP1 processing assay (see Materials and Methods) (n ≥ 3 independent assays; means ± standard deviations [SD]). (B) Replication kinetics of WT, CA-L231M, CA-H226Y, and CA-L231M in the absence (dimethyl sulfoxide [DMSO]) or presence of 7m or 7r. Virus stocks were generated in 293T cells, normalized for RT activity, and used to infect the Jurkat T-cell line. Cells were split every 2 days, and virus replication was monitored by RT activity.
FIG 3
FIG 3
Quantification of CA-SP1 processing in the presence of 7m or 7r for SP1-A1V, A3T, and A3V (A) and SP1-V7A, CA-V230I, and CA-V230I/SP1-V7A (B). BVM and the DMSO vehicle were included as controls (n ≥ 3 independent assays; means ± SD).
FIG 4
FIG 4
Selection and analysis of mutants resistant to second-generation MIs in the subtype B context. (A) The Jurkat T-cell line was transfected with pNL4-3 and cultured in the presence or absence of 2 nM compound 7m or 7r. DMSO served as the vehicle control. Virus replication was monitored by an RT assay. (B) Location of the mutations identified in selection experiments: P157A in the CA major homology region (MHR) and SP1-A1V. The top shows the general organization of Pr55Gag; the sequences corresponding to the red boxes are indicated by arrows. The stippled arrow denotes the location of the CA-SP1 cleavage site. NTD, N-terminal domain. (C) Effect of the CA-P157A mutation on the ability of 7m and 7r to block CA-SP1 processing, using the radiolabeling-based CA-SP1 processing assay (see Materials and Methods). DMSO and BVM are included as controls. The 7m and 7r compounds caused a small but statistically significant (** denotes a P value of <0.02 by Student’s t test) increase in the accumulation of CA-P157A CA-SP1 relative to the DMSO control (n ≥ 3 independent experiments).
FIG 5
FIG 5
Resistance to second-generation MIs is conferred by SP1-A1V and CA-P157A mutations in spreading HIV-1 infections. The Jurkat T-cell line was transfected with WT pNL4-3 or the indicated mutant derivatives and cultured in the absence of MI or in the presence of the indicated concentrations of BVM or 7r. Virus replication was monitored by an RT assay.
FIG 6
FIG 6
Quantitative assessment of MI resistance conferred by CA-P157A and SP1-A1V. 293T cell were transfected with WT or mutant molecular clones, and the transfected cells were treated with 22 concentrations of 7r from 0 to 8 μM (see Materials and Methods). Virus-containing supernatants were harvested, normalized for RT activity, and used to infect TZM-bl cells. Infectivity data were analyzed with GraphPad Prism 7 for Mac OS X from four independent experiments. Curves were fit using nonlinear regression as log(inhibitor) versus normalized response, with a variable slope using a least-squares (ordinary) fit. (A) Data from one representative experiment. (B) Maximum percent inhibition (MPI) calculated from the single-cycle (SC) assays described above for panel A, using the equation MPI = 1 − (signal from the average at the two highest drug concentrations)/(signal from the no-drug control) × 100. The SD is indicated (n = 4). NA, not applicable.
FIG 7
FIG 7
Selection and analysis of mutants resistant to second-generation MIs in the subtype C context. (A) Location of the mutations identified in selection experiments with the subtype C clone K3016: CA-V230M, SP1-A1V, S5N, and G10R. The top shows the general organization of Pr55Gag; the amino acid sequence at the CA-SP1 junction is indicated. The stippled arrow denotes the location of the CA-SP1 cleavage site. (B) Effect of the subtype C mutations on the ability of 7m and 7r to block CA-SP1 processing, using the radiolabeling-based CA-SP1 processing assay (see Materials and Methods). DMSO and BVM are included as controls. Statistical significance was calculated using Student’s t test. For SP1-S5N, G10R, and S5N/G10R, statistical significance for decreased CA-SP1 accumulation relative to the WT was calculated. ns, not significant (P > 0.05); *, P < 0.05; **, P < 0.02 (n ≥ 3 independent experiments).
FIG 8
FIG 8
Effect of MIs on the replication of subtype C mutants. (A) SP1-S5N, G10R, S5N/G10R, and A1V replication in the presence of BVM or 7m. (B) SP1-S5N, G10R, S5N/G10R, and A1V replication in the presence of BVM or 7r. (C) CA-V230M replication in the presence of BVM, 7m, or 7r. The HUTR5 T-cell line was transfected with the WT K3016 molecular clone or the indicated mutant derivatives. Virus replication was monitored by an RT assay. Replication curves for the WT without MIs and replication of the mutants with BVM are replotted in multiple panels for ease of comparison.
FIG 9
FIG 9
Quantitative assessment of MI resistance conferred by CA-V230M, SP1-A1V, S5N, G10R, and S5N/G10R. 293T cells were transfected with WT or mutant molecular clones, and the transfected cells were treated with 22 concentrations of compound 7r between 0 and 8 μM (see Materials and Methods). Virus-containing supernatants were harvested, normalized for RT activity, and used to infect TZM-bl cells. Infectivity data were analyzed with GraphPad Prism 7 for Mac OS X from 3 to 5 independent experiments, as described in the Fig. 6 legend and Materials and Methods. (A) Data from one representative experiment. (B) Maximum percent inhibition (MPI) calculated from the single-cycle (SC) assays as described in the Fig. 6 legend. The SD is indicated (n = 3 to 5).
FIG 10
FIG 10
Effect of the SP1-S5N mutation in NL4-3 and the CA-P157A mutation in K3016 on inhibition by MIs. Cells were transfected with WT pNL4-3 or the SP1-S5N derivative (A) or WT K3016 or the CA-P157A derivative (B) and treated with 100 nM BVM, 7m, or 7r. CA-SP1 processing was quantified by using the radiolabeling-based CA-SP1 processing assay (see Materials and Methods). DMSO alone was included as a control. In panel A, statistical significance of decreased CA-SP1 accumulation relative to the WT controls was calculated using Student’s t test (*, P < 0.05; **, P < 0.02). In panel B, statistical significance of increased CA-SP1 accumulation relative to the DMSO control was calculated using Student’s t test. (*, P < 0.05; **, P < 0.02) (n ≥ 3 independent experiments).
FIG 11
FIG 11
Replicative fitness of the second-generation MI-resistant mutants in PBMCs. Virus stocks of WT K3016 and NL4-3 and the indicated mutant derivatives were prepared by transfection of 293T cells. RT-normalized virus stocks were used to infect PBMCs from two different donors. Virus replication was monitored by an RT assay.
FIG 12
FIG 12
Specific infectivities of mutants resistant to second-generation MIs. 293T cells were transfected with the indicated WT and mutant molecular clones. Virus-containing supernatants were harvested, normalized for RT activity, and used to infect the TZB-bl indicator cell line. Luciferase activity was measured at 2 days postinfection. Infectivity of subtype B (NL4-3) clones is in blue, and that of subtype C (K3016) clones is in orange. The specific infectivities are presented relative to those of the WT (100%). Error bars indicate SDs (n = 4 independent assays performed in duplicate).
FIG 13
FIG 13
Effect of MI resistance mutations or CA-SP1 region polymorphisms on CA-SP1 processing kinetics. HeLa cells were transfected with WT pNL4-3 or the indicated mutants and cultured for 24 h. The cells were starved in Met-Cys-free medium for 30 min and then pulse-labeled with [35S]Met-Cys medium for 20 min. The cells were then washed, cultured, and lysed at 0, 30, 60, or 120 min. Lysates were immunoprecipitated with HIV-Ig (n = 3).
FIG 14
FIG 14
Crystal structural model for the CA-SP1 six-helix bundle and location of residues at which mutations arose during selection experiments with compounds 7m and 7r. Cutaway ribbon diagrams show the back three helices of the CA-SP1 six-helix bundle. The CA region is in gray, and SP1 residues 1 to 7 are in cyan. (A) Location of subtype B mutations CA-P157 and SP1-A1; (B) location of subtype C mutations CA-V230, SP1-A1, and SP1-S5. To-scale structures of compounds 7m and 7r are also included. The CA-SP1 structure is based on that reported under PDB accession number 5I4T (22).

References

    1. Kinch MS, Patridge E. 2014. An analysis of FDA-approved drugs for infectious disease: HIV/AIDS drugs. Drug Discov Today 19:1510–1513. doi: 10.1016/j.drudis.2014.05.012. - DOI - PubMed
    1. Bertagnolio S, Perno CF, Vella S, Pillay D. 2013. The impact of HIV drug resistance on the selection of first- and second-line ART in resource-limited settings. J Infect Dis 207:S45–S48. doi: 10.1093/infdis/jit121. - DOI - PubMed
    1. Guichet E, Aghokeng A, Serrano L, Bado G, Toure-Kane C, Eymard-Duvernay S, Villabona-Arenas CJ, Delaporte E, Ciaffi L, Peeters M. 2016. Short communication: high viral load and multidrug resistance due to late switch to second-line regimens could be a major obstacle to reach the 90-90-90 UNAIDS objectives in sub-Saharan Africa. AIDS Res Hum Retroviruses 32:1159–1162. doi: 10.1089/AID.2016.0010. - DOI - PubMed
    1. Hosseinipour MC, Gupta RK, Van Zyl G, Eron JJ, Nachega JB. 2013. Emergence of HIV drug resistance during first- and second-line antiretroviral therapy in resource-limited settings. J Infect Dis 207:S49–S56. doi: 10.1093/infdis/jit107. - DOI - PMC - PubMed
    1. Iyidogan P, Anderson KS. 2014. Current perspectives on HIV-1 antiretroviral drug resistance. Viruses 6:4095–4139. doi: 10.3390/v6104095. - DOI - PMC - PubMed

Publication types