. 2018 Dec 20;3(24):e123673.
doi: 10.1172/jci.insight.123673.

Human kidney on a chip assessment of polymyxin antibiotic nephrotoxicity

Affiliations

Human kidney on a chip assessment of polymyxin antibiotic nephrotoxicity

Elijah J Weber et al. JCI Insight. .

Abstract

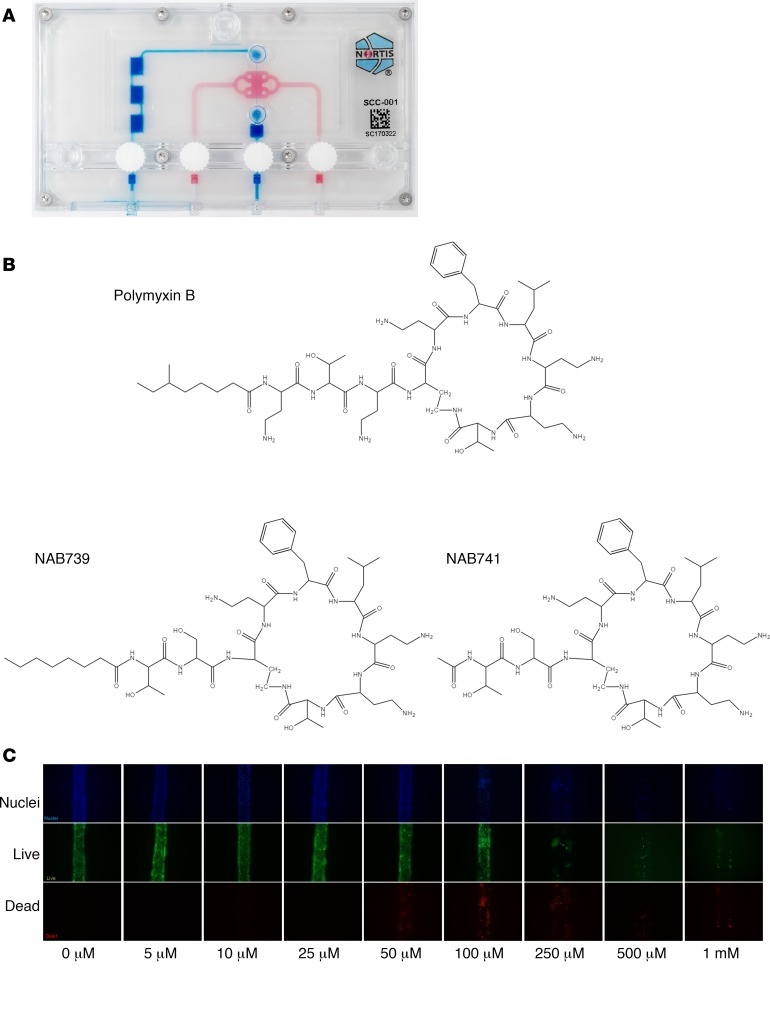
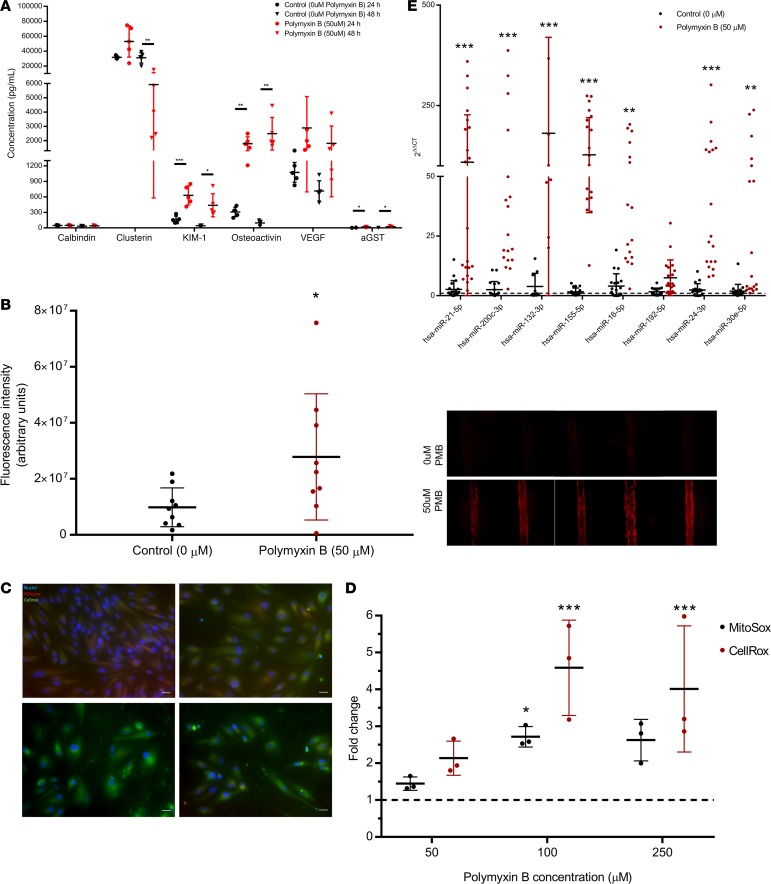
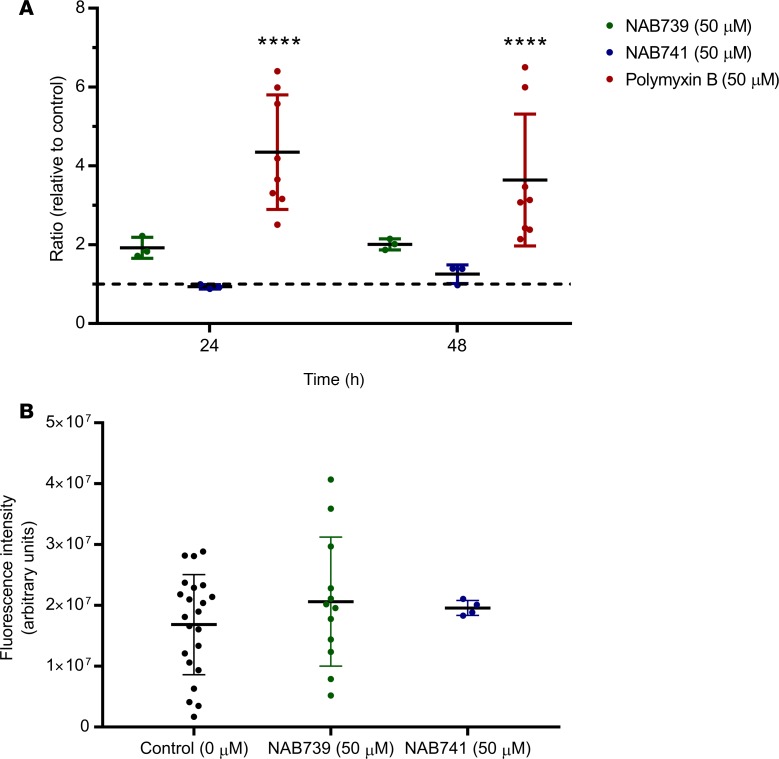
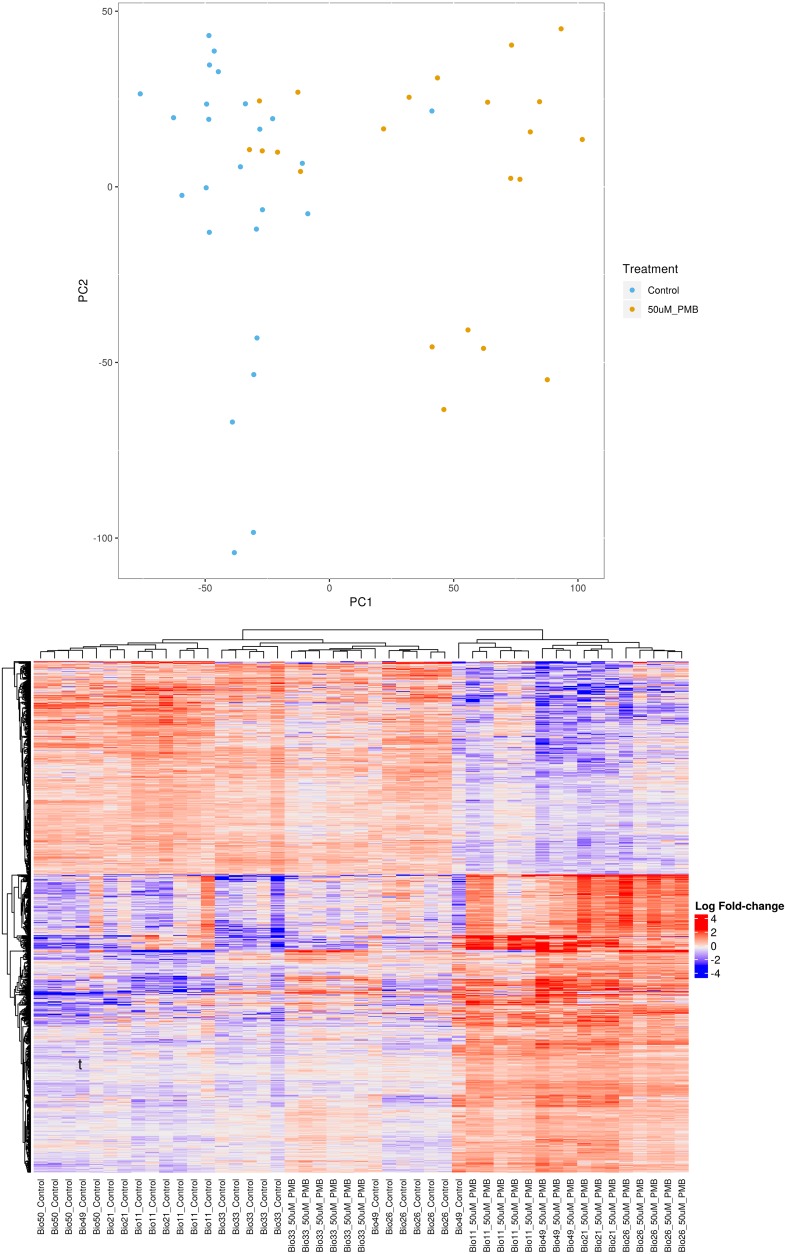
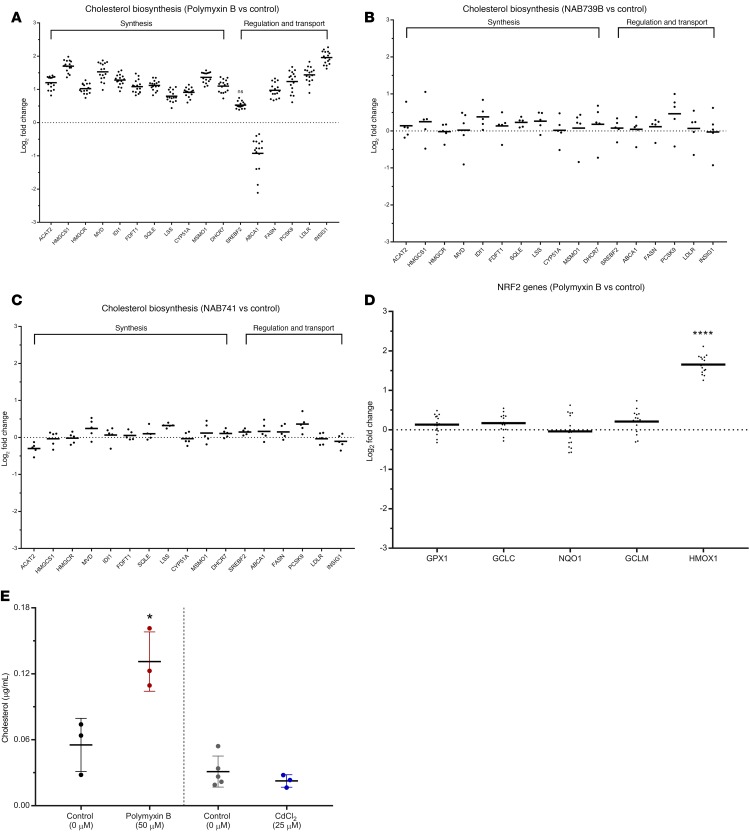
Drug-induced kidney injury, largely caused by proximal tubular intoxicants, limits development and clinical use of new and approved drugs. Assessing preclinical nephrotoxicity relies on animal models that are frequently insensitive; thus, potentially novel techniques - including human microphysiological systems, or "organs on chips" - are proposed to accelerate drug development and predict safety. Polymyxins are potent antibiotics against multidrug-resistant microorganisms; however, clinical use remains restricted because of high risk of nephrotoxicity and limited understanding of toxicological mechanisms. To mitigate risks, structural analogs of polymyxins (NAB739 and NAB741) are currently in clinical development. Using a microphysiological system to model human kidney proximal tubule, we exposed cells to polymyxin B (PMB) and observed significant increases of injury signals, including kidney injury molecule-1 KIM-1and a panel of injury-associated miRNAs (each P < 0.001). Surprisingly, transcriptional profiling identified cholesterol biosynthesis as the primary cellular pathway induced by PMB (P = 1.22 ×10⁻¹⁶), and effluent cholesterol concentrations were significantly increased after exposure (P < 0.01). Additionally, we observed no upregulation of the nuclear factor (erythroid derived-2)-like 2 pathway, despite this being a common pathway upregulated in response to proximal tubule toxicants. In contrast with PMB exposure, minimal changes in gene expression, injury biomarkers, and cholesterol concentrations were observed in response to NAB739 and NAB741. Our findings demonstrate the preclinical safety of NAB739 and NAB741 and reveal cholesterol biosynthesis as a potentially novel pathway for PMB-induced injury. To our knowledge, this is the first demonstration of a human-on-chip platform used for simultaneous safety testing of new chemical entities and defining unique toxicological pathway responses of an FDA-approved molecule.

Keywords: Cell stress; Nephrology; Toxicology; Toxins/drugs/xenobiotics.


Conflict of interest statement

Conflict of interest: MV and TV are employees of Northern Antibiotics Ltd, Espoo, Finland. SR is an employee of AstraZeneca, and VV is an employee of Pfizer.

Figures

Figure 1
Figure 1. Kidney microphysiological system, PMB/analog structural variants, and PMB dosimetry in the microphysiological system.
(A) Single-channel Nortis microphysiological system (MPS). (B) Structural comparisons of PMB and polymyxin analogs (NAB739 and NAB741). (C) PMB dosimetry in the MPS after 48 hours of treatment with increasing PMB concentrations. Cell survival was assessed for differences in viability (green) and toxicity (red) with increasing concentrations of PMB. Devices exposed to 250 μM or higher resulted in severe cell death and loss of tubule integrity while 50 μM PMB caused detectable but modest injury (n = 1).
Figure 2
Figure 2. Effluent and cell-associated biomarkers of nephrotoxicity.
(A) Urinary kidney injury biomarkers (osteoactivin, KIM-1, VEGF, and α-GST) were assayed from MPS effluents. There was a significant difference between PMB-treated control MPS effluent for urinary biomarkers KIM-1, osteoactivin, and α-GST. (B) Cell-associated HMOX1. HMOX1 was detected by immunocytochemistry (left panel, representative donor) and quantified (right panel, n = 2 donors, 9 controls, 8 treated). A significant induction (P < 0.05) for devices treated with 50 μM PMB relative to controls was observed. Values are reported as MFI ± SD. (C) PTECs in 2-D culture for 72 hours were exposed to increasing concentrations (top left, 0 μM; top right, 50 μM; bottom left, 100 μM; bottom right, 250 μM) of PMB for 24 hours. Using cellular stains, MitoSOX (red) and CellROX (green), ROS was measured. (D) ROS quantitation. Fluorescence intensity was quantified and normalized to control intensity values. A significant (P < 0.001) increase of cellular ROS was observed at 100 μM and 250 μM PMB. MitoSOX, an indicator of mitochondrial-specific ROS, showed a significant increase at doses higher than 50 μM PMB (100 μM) (n = 3 fields of view/dose for image quantitation, P < 0.05). (E) Urinary miRNA biomarkers. The effluent at 48 hours showed significant induction of miRNA-21, -200c, -132, -155, -16, -24, and -30e across multiple human donor cells (n = 3) cultured within the 3-D kidney MPS. Values are reported as the mean ± SD (*P < 0.05, **P < 0.01, ***P < 0.001).
Figure 3
Figure 3. PMB versus NAB739/NAB741 demonstrates mitigated toxicity with analogs.
(A) Effluents were collected at 24 and 48 hours of treatment and analyzed for KIM-1 levels (n = 8 donors). Significant accumulation of KIM-1 in the effluent was observed only in the PMB group. (B) Cell-associated HMOX1. HMOX1 expression was measured by immunostaining, with no significant differences observed for either NAB739 or NAB741 relative to controls across several donors treated with 50 μM NAB739 (n = 3) and 50 μM NAB741 (n = 3) relative to controls (n = 5). Values are reported as the mean ± SD (****P < 0.0001).
Figure 4
Figure 4. RNA-Seq and transcriptional response to PMB exposure.
PCA reveals clustering within respective groups of treatment (control versus 50 μM PMB) as well as a distinction of the treated and control (PC1) and between the individual donors (PC2). Heatmap analysis of individual MPSs grouped by donors and treatment groups.
Figure 5
Figure 5. RNA-Seq identifies novel injury pathways that are PMB specific.
(AC) Transcriptional response, via activation of cholesterol biosynthesis pathways, was visualized for the top 10 genes for PTECs in the MPS exposed to (A) PMB, (B) NAB739, and (C) NAB741. (D) PMB exposure shows little/no activation of the NRF2-mediated antioxidant response pathway. Control and PMB-treated MPS effluents were tested for the presence of cholesterol following 48 hours of treatment. (E) Effluent cholesterol analysis. In response to PMB exposure (left panel), cholesterol levels showed a significant increase at 48 hours (P < 0.05) while cadmium chloride exposure (right panel, 25 μM for 48 hours) exhibited similar levels of cholesterol to controls (*P < 0.05, **P < 0.01, ***P < 0.001, ****P < 0.0001).
Figure 6
Figure 6. SPR experiments demonstrate high affinity and capacity of PMB–lipid nanodisc interactions.
(A) Binding data for PMB (2.3, 6.9, 20.6, 61.9, and 186.557.1670 μM) to nanodiscs. Equilibrium binding constant determined by fitting equilibrium responses to a steady-state binding model (inset). (B) Binding data for NAB741 (26, 78, 235.704.2111, 6,333, and 19,000 μM) to nanodiscs. Binding isotherm fit to a steady-state binding model for NAB741 (inset). (C) Representative sensorgrams showing overlapping duplicates. Linearity observed for equilibrium response data (duplicates), at lower concentrations (2.3, 6.9, 20.6, 61.9, 186.557.1670 μM) of NAB741 (dotted lines, inset). (D) Strategy for immobilization of 1-pal- mitoyl-2-oleoyl-sn-glycero-3-phosphocholine (POPC) lipid nanodiscs on sample flow cell surface and MSP1D1 (Protein Data Bank 2A01, depicted as lipid-free ApoA1 with N-terminal region in yellow) on the reference surface (left panel). Partitioning of PMB and NAB741 into the lipid bilayer determined by the Orientation of Proteins and Membranes database (https://opm.phar.umich.edu; OPM database). Conformation of NAB741 is based on PMB (Protein Data Bank 5L3F) and is not intended to be an exhaustive representation of conformers. Values are reported as the mean ± SD.

References

    1. Chakradhar S. What’s old is new: reconfiguring known antibiotics to fight drug resistance. Nat Med. 2016;22(11):1197–1199. doi: 10.1038/nm1116-1197. - DOI - PubMed
    1. Bergen PJ, et al. Polymyxin combinations: pharmacokinetics and pharmacodynamics for rationale use. Pharmacotherapy. 2015;35(1):34–42. doi: 10.1002/phar.1537. - DOI - PMC - PubMed
    1. Storm DR, Rosenthal KS, Swanson PE. Polymyxin and related peptide antibiotics. Annu Rev Biochem. 1977;46:723–763. doi: 10.1146/annurev.bi.46.070177.003451. - DOI - PubMed
    1. Velkov T, Roberts KD, Nation RL, Thompson PE, Li J. Pharmacology of polymyxins: new insights into an ‘old’ class of antibiotics. Future Microbiol. 2013;8(6):711–724. doi: 10.2217/fmb.13.39. - DOI - PMC - PubMed
    1. Clausell A, Garcia-Subirats M, Pujol M, Busquets MA, Rabanal F, Cajal Y. Gram-negative outer and inner membrane models: insertion of cyclic cationic lipopeptides. J Phys Chem B. 2007;111(3):551–563. doi: 10.1021/jp064757+. - DOI - PubMed

Publication types