. 2018 Dec 19;8(1):17967.
doi: 10.1038/s41598-018-36272-9.

Vinculin and the mechanical response of adherent fibroblasts to matrix deformation

Affiliations

Vinculin and the mechanical response of adherent fibroblasts to matrix deformation

Kathryn A Rosowski et al. Sci Rep. .

Abstract

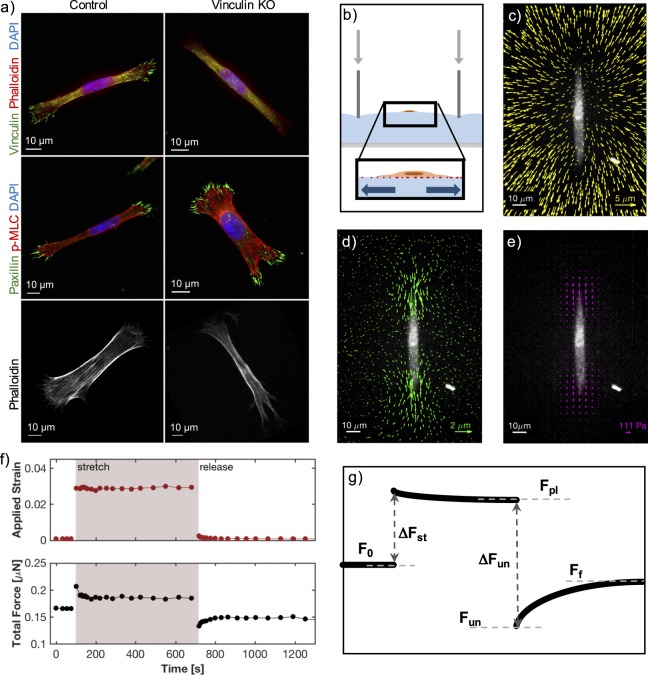
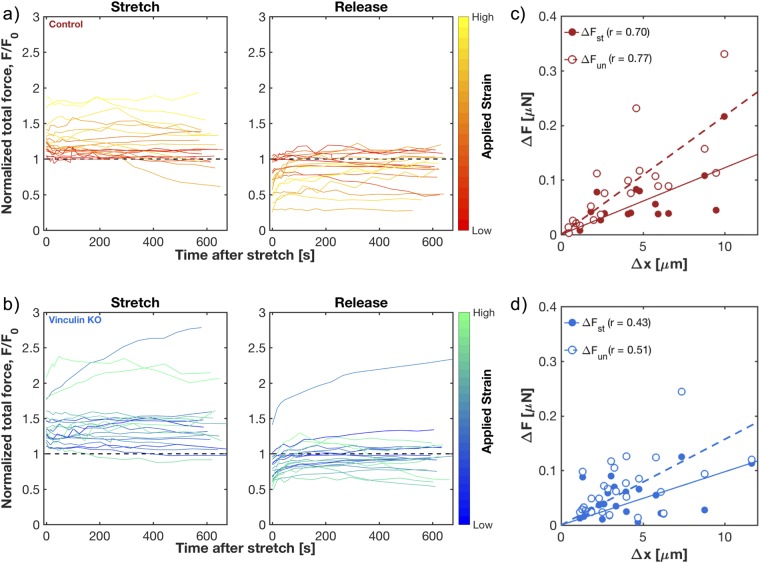
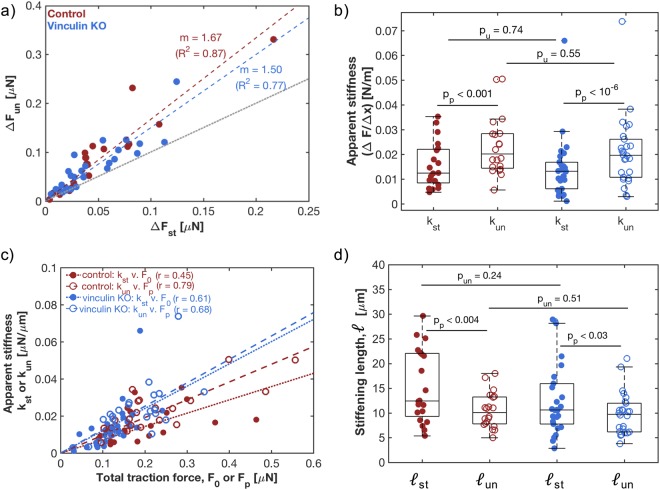
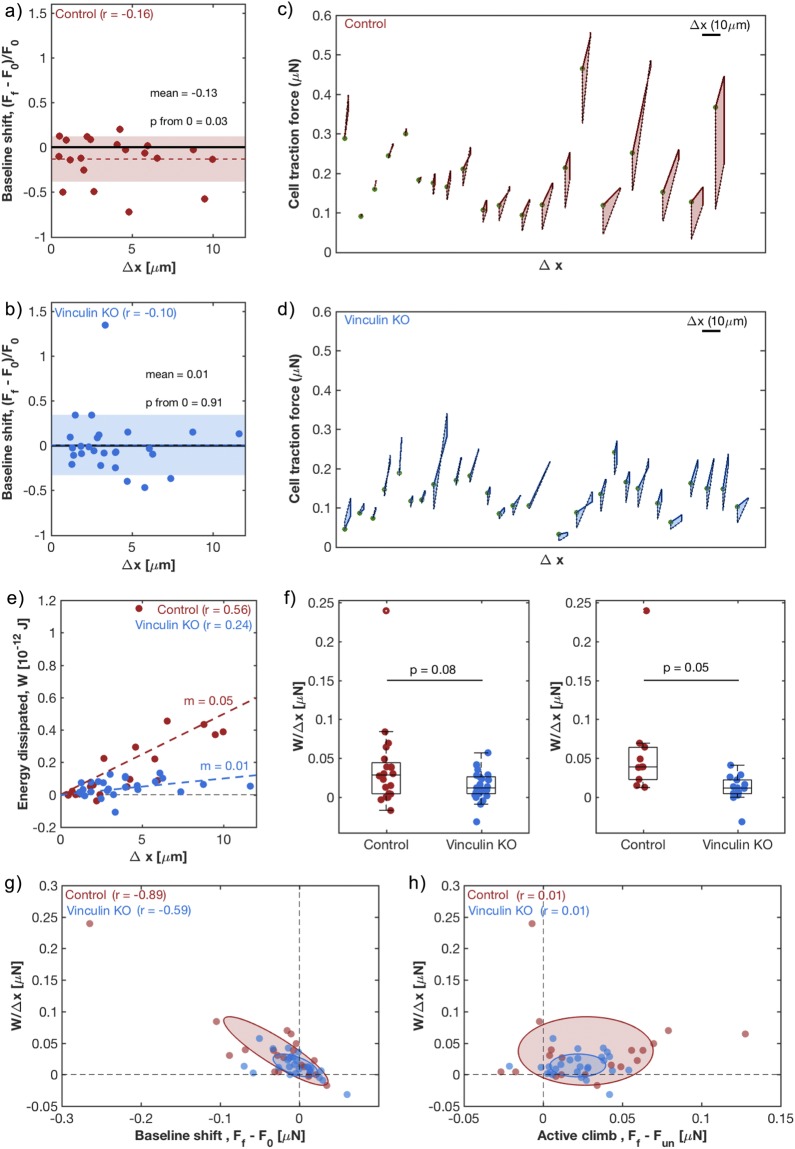
Cells respond to the mechanics of their environment. Mechanical cues include extracellular matrix (ECM) stiffness and deformation, which are primarily sensed through integrin-mediated adhesions. We investigated the impact of ECM deformation on cellular forces, measuring the time-evolution of traction forces of isolated mouse fibroblasts in response to stretch and release. Stretch triggered a marked increase of traction stresses and apparent stiffness. Expression of the focal adhesion protein vinculin not only increased baseline traction forces, but also increased dissipation of mechanical energy, which was correlated with the cells' failure to recover baseline traction forces after release of stretch.


Conflict of interest statement

The authors declare no competing interests.

Figures

Figure 1
Figure 1
Experimental design. (a) Immunofluorescent images of adherent control (left panels) and vinculin KO (right panels) cells on silicone-coated glass coverslips. Vinculin and paxillin are focal adhesion proteins. Phalloidin stains for actin and DAPI for cell nuclei. p-MLC (phospho-myosin light chain) marks active myosin. (b) Schematic of the set-up for cell stretching. As a thick silicone substrate is indented with a glass capillary tube, the surface is stretched equi-biaxially, stretching the attached cell. (c) Beads embedded under the silicone surface are tracked from an un-stretched to stretched state, showing the magnitude of applied strain. (d) The far-field strain is subtracted from the displacement map of the embedded beads (in c), leaving only the residual displacements caused by the pulling of the cell. (e) Stresses are calculated from the displacement map (in d). (ce) White lines represent the scale bar of the fluorescent cell image. Colored arrows represent the scale bar of the overlaid displacements or stresses. (f) An example of real data showing the evolution of force changes. The applied strain is plotted over the time of the experiment, showing the pre-stretched, stretched and post-release state of the cell (above). The force magnitudes applied by the cell are integrated and shown throughout the same course of the experiment (below). (g) A schematic showing the force trace over time and the quantities focused on in our analysis.
Figure 2
Figure 2
Mechanical response of fibroblasts to stretch. (a,b) Traces of individual control cells (a) and vinculin KO cells (b), showing force changes over the time of stretch (left) and after release of stretch (right). Total force magnitudes are normalized by the initial baseline traction force magnitude, F0. Colors correspond to amount of applied stretch, with brighter colors corresponding to higher applied strain. (c,d) Plot of the change in force versus the change in cell length, Δx, for two states: the jump at onset of stretch, ΔFst (solid circles), and the drop at release of stretch, ΔFun (empty circles). Each set of the two conditions represents a single cell. Each change in force is relative to that cell’s baseline traction force magnitude before change in applied strain. High Pearson’s correlation coefficient values (r) suggest a strong linear relation. Linear best of fit lines (solid for ΔFst v. Δx,and dashed for ΔFun v. Δx) display a positive slope for both relations.
Figure 3
Figure 3
Stress-stiffening of stretched fibroblasts. (a) For each control cell (red) and vinculin KO cell (blue), ΔFun values plotted as a function of ΔFst. Each data point represents a single cell, and the dashed line shows a linear best of fit through all data points, with fit slope m. R2 represents the coefficient of determination for linear regression. The dotted gray line shows a slope of 1. (b) Apparent stiffnesses for control (red) and vinculin KO (blue) cells, at stretch, kst, and un-stretch, kun. Means from left to right: 0.016, 0.023, 0.014, and 0.021 N/m. (c) Stress stiffening shown through the apparent stiffness plotted as a function of total traction force before stretch (kstv.F0, solid circles) and un-stretch (kunv.Fpl, empty circles). Moderate to high Pearson’s correlation coefficient values (r) suggest a linear relation. Dashed and dotted lines show the linear best of fit lines. (d) The stiffening length, , for each individual cell in each condition, given as the ratio between total traction force and apparent stiffness. Means from left to right: 15.3, 10.5, 12.7, 9.7 µm. (b,d) Each data point represents a single cell, and the box and whisker plots summarize the entire population. The middle line represents the median of the population, while the bottom and top of the boxes represent the 1st and 3rd quartile, respectively. p-values were calculated by either a Welch’s t-test between conditions (pu) or a paired Student’s t-test within a condition (pp).
Figure 4
Figure 4
Dissipated energy in the stretch cycle is correlated with a baseline shift in traction forces. (a,b) Shift in baseline traction forces throughout the entire stretch and release process, FfF0, normalized by the initial baseline, F0, for control (a) and vinculin KO (b) cells. Each data point represents a single cell and the colored region spans the mean +/− standard deviation. Low Pearson’s correlation coefficient (r) values suggest no relation between baseline shift and the change in cell length, Δx. (c,d) Force-displacement diagram for control (c) and vinculin KO (d) cells, showing total traction force of each individual cell throughout the cycle of stretch and release. Cells are arranged from left to right based on the area inside this curve, which is the dissipated mechanical energy. Scale bar shows the scale of Δx, change in cell length. Green dots indicate each cell’s initial traction force/zero displacement point. (e) Dissipated energy, W, for each cell as a function of cell length change. For control cells (red), a moderate r value and a positive fit slope (m) suggest a linear correlation. For vinculin KO cells (blue), a low r and small m, suggest a lack of correlation. (f) The dissipated energy per unit length, WΔx, across control (red) and vinculin KO (blue) cells, for the full population (left) and for cells with Δx.>3 µm (right). Each data point represents a single cell while the box and whisker plots summarize the population. The middle line represents the median of the population, while the box top and bottom represent the 1st and 3rd quartile, respectively. p-values were calculated by Welch’s t-test. Means from left to right: 0.037, 0.014, 0.059, 0.011 µN. (g) Relationship between dissipation per unit length, WΔx, and baseline traction force shift,FfF0. Moderate to high negative r values suggest a strong anti-correlation. (h) The relationship between the dissipation per unit length, WΔx, and active climb in force after un-stretch,FfFun. Very low r values suggest a lack of relation. (g,h) Each data point represents a single cell. The axes of the ellipses are the eigenvectors of the covariance matrix between x and y coordinates. The widths of the ellipses are the square root of the variances along these vectors, showing the variation in the populations.

References

    1. Humphrey JD, Dufresne ER, Schwartz MA. Mechanotransduction and extracellular matrix homeostasis. Nature Reviews Molecular Cell Biology. 2014;15:802–812. doi: 10.1038/nrm3896. - DOI - PMC - PubMed
    1. Vogel V, Sheetz M. Local force and geometry sensing regulate cell functions. Nature reviews. Molecular cell biology. 2006;7:265–275. doi: 10.1038/nrm1890. - DOI - PubMed
    1. Cui Y, et al. Cyclic stretching of soft substrates induces spreading and growth. Nature Communications. 2015;6:6333–6333. doi: 10.1038/ncomms7333. - DOI - PMC - PubMed
    1. Livne A, Bouchbinder E, Geiger B. Cell reorientation under cyclic stretching. Nature communications. 2014;5:3938–3938. doi: 10.1038/ncomms4938. - DOI - PMC - PubMed
    1. Wang JHC, Goldschmidt-Clermont P, Wille J, Yin FCP. Specificity of endothelial cell reorientation in response to cyclic mechanical stretching. Journal of Biomechanics. 2001;34:1563–1572. doi: 10.1016/S0021-9290(01)00150-6. - DOI - PubMed

Publication types