. 2019 Sep;26(9):1735-1749.
doi: 10.1038/s41418-018-0251-z. Epub 2018 Dec 19.

STING directly activates autophagy to tune the innate immune response

Affiliations

STING directly activates autophagy to tune the innate immune response

Dong Liu et al. Cell Death Differ. 2019 Sep.

Abstract

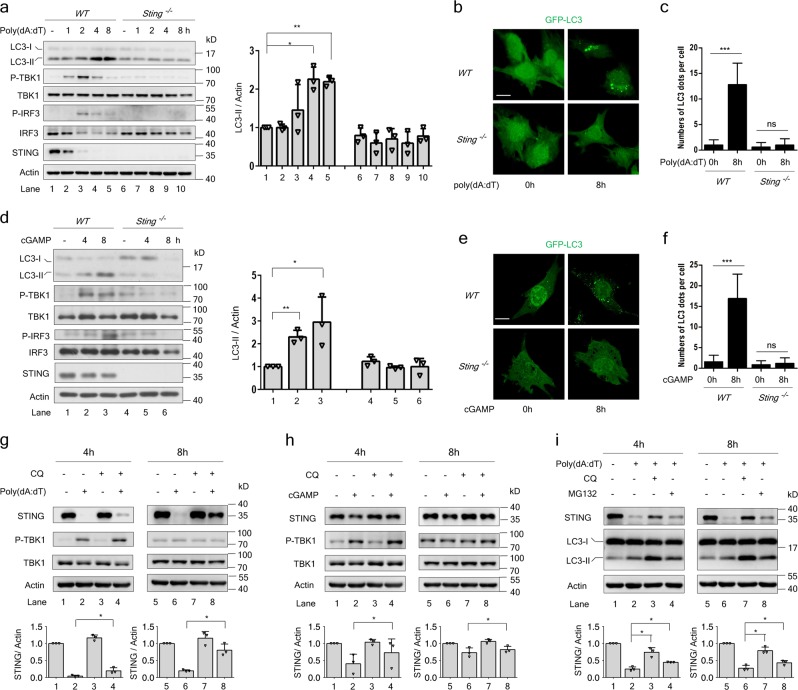
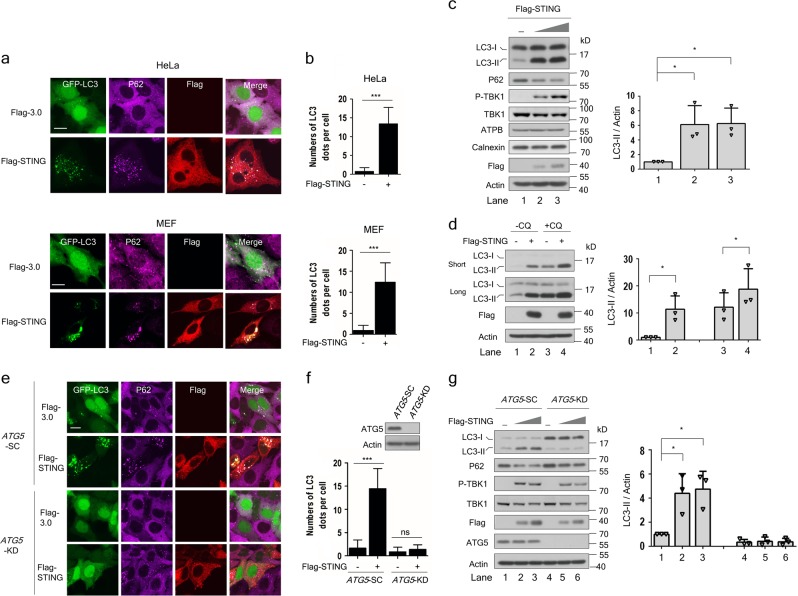
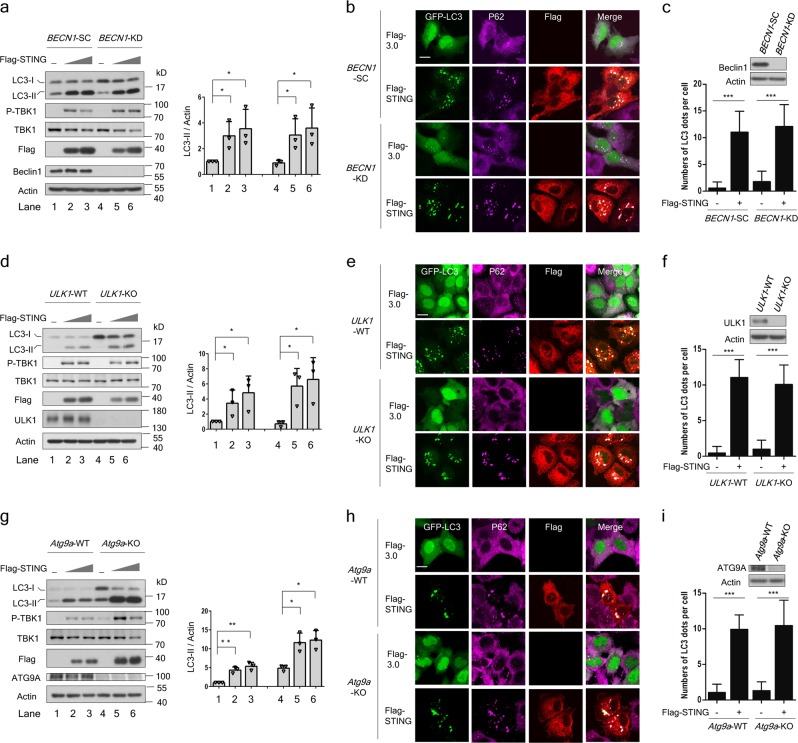
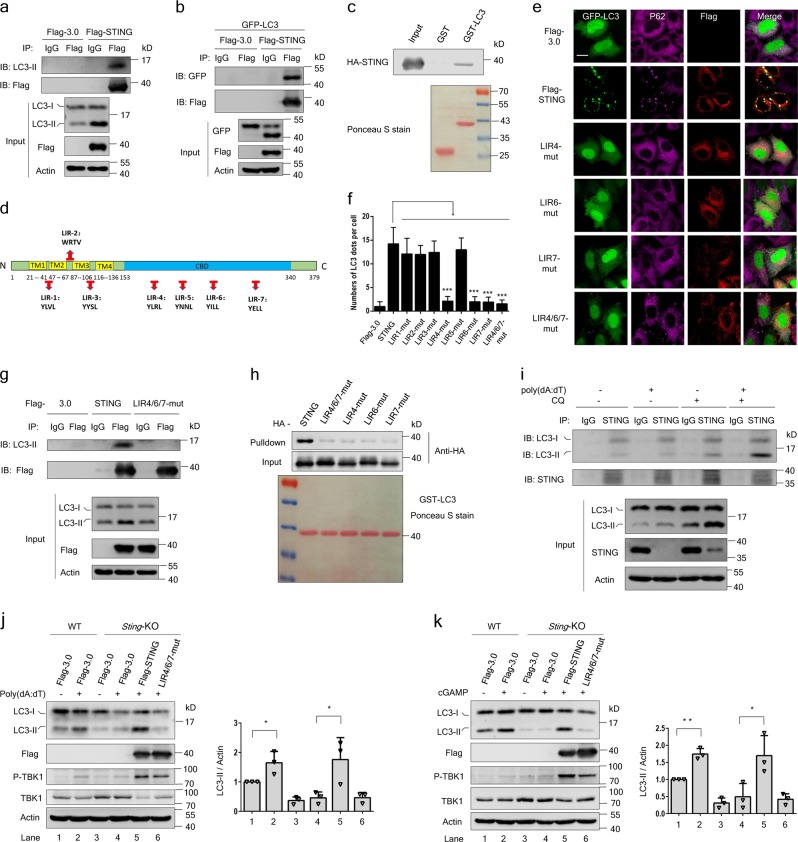
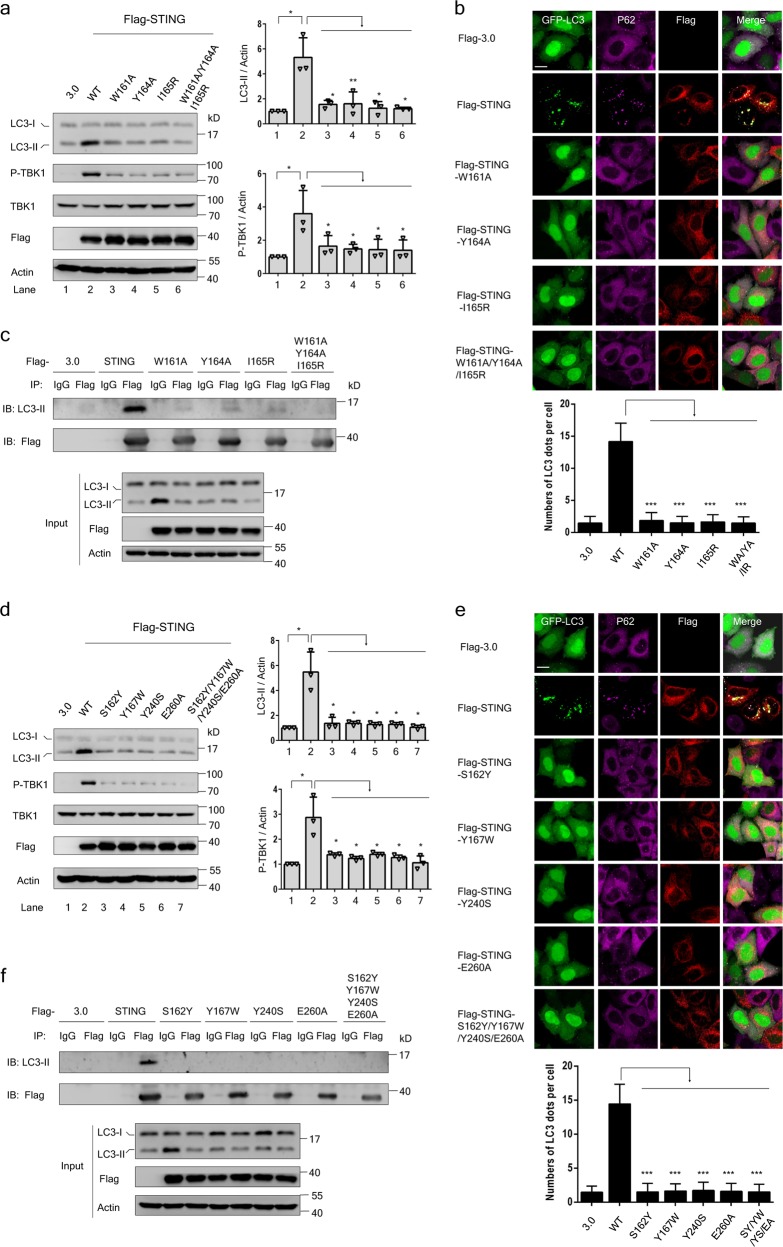
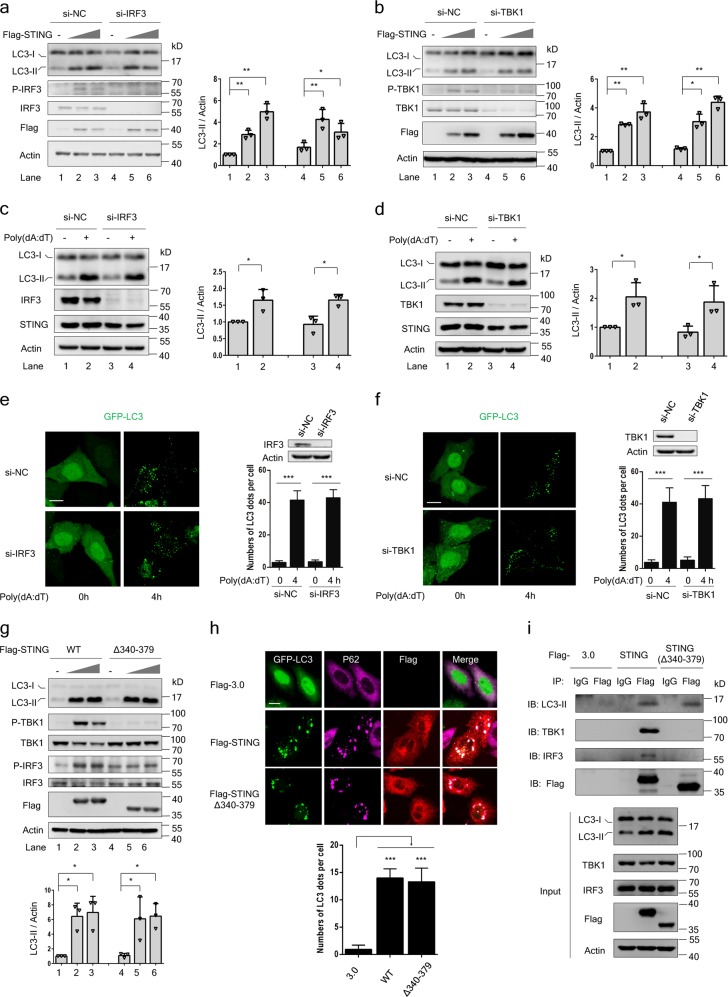
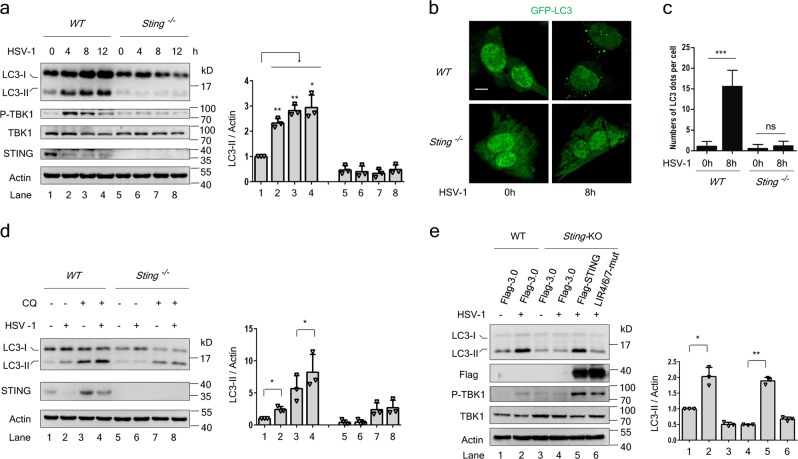
STING (stimulator of interferon genes) is a central molecule that binds to cyclic dinucleotides produced by the cyclic GMP-AMP synthase (cGAS) to activate innate immunity against microbial infection. Here we report that STING harbors classic LC-3 interacting regions (LIRs) and mediates autophagy through its direct interaction with LC3. We observed that poly(dA:dT), cGAMP, and HSV-1 induced STING-dependent autophagy and degradation of STING immediately after TBK1 activation. STING induces non-canonical autophagy that is dependent on ATG5, whereas other autophagy regulators such as Beclin1, Atg9a, ULK1, and p62 are dispensable. LIR mutants of STING abolished its interaction with LC3 and its activation of autophagy. Also, mutants that abolish STING dimerization and cGAMP-binding diminished the STING-LC3 interaction and subsequent autophagy, suggesting that STING activation is indispensable for autophagy induction. Our results thus uncover dual functions of STING in activating the immune response and autophagy, and suggest that STING is involved in ensuring a measured innate immune response.


Conflict of interest statement

The authors declare that they have no conflict of interest.

Figures

Fig. 1
Fig. 1
Poly(dA:dT) and cGAMP induce STING-dependent autophagy and degradation of STING. a Immunoblot analysis of LC3-ΙΙ expression levels in Sting wild-type and knockout MEF cells stimulated by poly(dA:dT) at a final concentration of 1 µg/ml. Quantification of LC3-II expression levels in a is shown in the right panel (mean ± s.d.; from three independent experiments). P < 0.05, ∗∗P < 0.01. b Sting wild-type and knockout MEFs were transfected with a plasmid expressing GFP-LC3 and stimulated with or without poly(dA:dT) for 8 h. Images were then captured by confocal microscopy. Scale bar: 10 µm. c The numbers of GFP-LC3 dots per cell in b were quantified (mean ± s.d.; n > 100 cells from three independent experiments). ∗∗∗P < 0.001. ns, not significant. d cGAMP was used to stimulate Sting wild-type and knockout MEFs for the indicated time, and cell lysates were then subjected to western blotting analysis of LC3-ΙΙ conversion. Quantification of LC3-II expression levels in d is shown in the right panel (mean ± s.d.; from three independent experiments). P < 0.05, ∗∗P < 0.01. e Sting wild-type and knockout MEFs were transfected with the GFP-LC3 plasmid and then treated with or without cGAMP at a final concentration of 5 µg/ml for 8 h. Formation of LC3 puncta was then examined by immunofluorescence microscopy. Scale bar: 10 µm. f Quantification of the numbers of LC3 dots per cell (mean ± s.d.; n > 100 cells from three independent experiments). ∗∗∗P < 0.001. ns, not significant. g Poly(dA:dT) was used to stimulate MEF cells for the indicated time without or with chloroquine (CQ) treatment. Western blotting was used to detect protein expression levels with the indicated antibodies. Quantification of STING expression levels is shown below the Fig. 1(g) (mean ± s.d.; from three independent experiments). P < 0.05. h cGAMP was used to stimulate MEF cells for the indicated time without or with chloroquine (CQ) treatment. Western blotting was used to detect protein expression levels with the indicated antibodies. Quantification of STING expression levels is shown below the Fig. 1(h) (mean ± s.d.; from three independent experiments). P < 0.05. i Poly(dA:dT) was used to stimulate MEF cells for the indicated time without or with chloroquine (CQ) or MG132 treatment, and the cell lysates were subjected to immunoblot analysis. Quantification of STING expression levels is shown below the Fig. 1(i) (mean ± s.d.; from three independent experiments). P < 0.05
Fig. 2
Fig. 2
STING overexpression induces ATG5-dependent autophagy. a HeLa and MEF cells were transfected with GFP-LC3 (green) plasmid together with an empty vector (Flag-3.0) or Flag-STING plasmid for 24 h. The cells were fixed and stained with anti-Flag antibodies (red) and anti-p62 antibodies (purple), and images were then captured by confocal microscopy. Scale bar: 10 µm. b The numbers of GFP-LC3 dots per cell in (a) were quantified (mean ± s.d.; n > 100 cells from three independent experiments). ∗∗∗P < 0.001. c HeLa cells were transfected with a control Flag vector or a Flag-STING plasmid (0.2 μg/ml and 0.5 μg/ml, respectively) for 24 h. Marker proteins for autophagy (LC3 and p62), mitochondria (ATPB) and the endoplasmic reticulum (Calnexin) were detected by immunoblotting analysis. Quantification of LC3-II expression levels in c is shown in the right panel (mean ± s.d.; from three independent experiments). P < 0.05. d Immunoblot analysis of LC3-ΙΙ expression in HeLa cells that were transfected with Flag vector or Flag-STING without or with chloroquine (CQ) treatment at a final concentration of 25 µM/ml. Quantification of LC3-II expression levels in d is shown in the right panel (mean ± s.d.; from three independent experiments). P < 0.05. e HeLa cells expressing ATG5-SC (scramble control) and ATG5-KD shRNAs were co-transfected with GFP-LC3 plasmid, Flag vector or Flag-STING plasmid for 24 h. The cells were fixed, stained and further visualized by confocal microscopy. Scale bar: 10 µm. f The numbers of GFP-LC3 dots per cell in e were quantified (mean ± s.d.; n > 100 cells from three independent experiments). ∗∗∗P < 0.001. ns, not significant. The inset shows immunoblot analysis of ATG5 KD HeLa cells (expressing ATG5 shRNA) and control cells (expressing scramble shRNA). g Immunoblot analysis of LC3 protein levels in ATG5 KD and control ATG5 SC cells transfected with Flag-vector or Flag-tagged STING plasmid (0.2 μg/ml and 0.5 μg/ml, respectively). Quantification of LC3-II expression levels in g is shown in the right panel (mean ± s.d.; from three independent experiments). P < 0.05
Fig. 3
Fig. 3
STING-induced autophagy is independent of BECN1, ULK1 and Atg9a. a Immunoblot analysis of LC3-ΙΙ expression levels in BECN1 knockdown cells and control cells transfected with Flag-vector or increasing amounts of Flag-STING plasmid. Quantification of LC3-II expression levels in a is shown in the right panel (mean ± s.d.; from three independent experiments). P < 0.05. b BECN1 knockdown cells and control cells were transfected with GFP-LC3 plasmid together with Flag-vector or Flag-STING plasmid. LC3 dot formation was examined by immunofluorescence microscopy. Scale bar: 10 µm. c The numbers of GFP-LC3 dots per cell in b were quantified (mean ± s.d.; n > 100 cells from three independent experiments). ∗∗∗P < 0.001. The inset shows immunoblot analysis of BECN1 KD HeLa cells (expressing BECN1 shRNA) and control cells (expressing scramble shRNA). d Flag-vector and Flag-STING plasmids were transfected into ULK1 wild-type and knockout cells for 24 h, followed by western blotting assays of LC3-ΙΙ conversion. Quantification of LC3-II expression levels in d is shown in the right panel (mean ± s.d.; from three independent experiments). P < 0.05. e ULK1 wild-type and knockout cells were transfected with GFP-LC3 and Flag-vector or Flag-STING plasmids, and images were captured by confocal microscopy. Scale bar: 10 µm. f Quantification of the numbers of LC3 dots per cell in e (mean ± s.d.; n > 100 cells from three independent experiments). ∗∗∗P < 0.001. The inset shows immunoblot analysis of ULK1 knockout HeLa cells and wild-type cells. g Western blotting analysis of LC3-ΙΙ expression levels in Atg9a wild-type and knockout HeLa cells transfected with Flag-vector or increasing amounts of Flag-STING plasmid. Quantification of LC3-II expression levels in g is shown in the right panel (mean ± s.d.; from three independent experiments). P < 0.05, ∗∗P < 0.01. h Atg9a wild-type and knockout HeLa cells were transfected with plasmids expressing GFP-LC3 and Flag-vector or Flag-STING. Formation of LC3 puncta was detected by immunofluorescence microscopy. Scale bar: 10 µm. i Quantification of the numbers of LC3 puncta per cell in h (mean ± s.d.; n > 100 cells from three independent experiments). ∗∗∗P < 0.001. The inset shows immunoblot analysis of Atg9a knockout HeLa cells and wild-type cells
Fig. 4
Fig. 4
STING has autophagy receptor properties and directly interacts with LC3 via its LIR motifs. a Sting knockout HeLa cells were transfected with the indicated plasmids for 24 h. Cells lysates were incubated with protein G agarose beads and indicated antibody at 4 °C overnight, then immunoblotted. b Sting knockout HeLa cells were co-transfected with GFP-LC3 and Flag-vector or Flag-STING plasmids. Cell lysates were subjected to immunoprecipitation with protein G agarose beads and immunoblot analysis with anti-GFP. c Purified GST or GST-LC3 proteins were incubated with lysates of HeLa cells transfected with a plasmid expressing HA-STING at 4 °C overnight. Immunoblot analysis was then carried out to detect the interaction between STING and LC3. Ponceau S staining shows the abundance of the GST and GST-LC3 proteins. d Graphical representation of the STING protein showing the three domains and the seven potential LIR motifs. The N-terminal domain contains 4 transmembrane regions (TM1-4), the CBD domain binds to c-di-GMP, and the C-terminal domain contains the cytoplasmic tail. The amino acid sequences of the predicted LIR motifs are indicated. e Sting knockout HeLa cells were transfected with plasmids encoding GFP-LC3 and wild-type STING or its LIR motif mutants. Formation of LC3 puncta was detected by immunofluorescence microscopy. f Quantification of the numbers of LC3 dots per cell (mean ± s.d.; n > 100 cells from three independent experiments). Scale bar: 10 µm. ∗∗∗P < 0.001. g Sting knockout HeLa cells were transfected with control vector (Flag-3.0), or plasmids expressing wild-type Flag-STING or its triple LIR motif mutant. Cell lysates were subjected to immunoprecipitation and immunoblot analysis of the interaction between LC3 and STING or its mutants. h GST-fused LC3 proteins were incubated with lysates of HeLa cells transfected with plasmids carrying genes for wild-type STING or the indicated mutants at 4 °C overnight. Immunoblotting was then performed to analyze the association between LC3 and STING or its mutants. Ponceau S staining shows the abundance of GST-LC3 proteins. i MEF cells were stimulated with or without poly(dA:dT) or chloroquine (CQ), then lysates were subjected to co-immunoprecipitation and immunoblotting to analyze the interaction between endogenous STING and LC3. j Immunoblot analysis of LC3-ΙΙ expression levels in Sting wild-type and knockout HeLa cells expressing the indicated plasmids with or without poly(dA:dT) stimulation. Quantification of LC3-II expression levels in j is shown in the right panel (mean ± s.d.; from three independent experiments). P < 0.05. k Immunoblot analysis of LC3-ΙΙ conversion in Sting wild-type and knockout HeLa cells transfected with the indicated plasmids with or without cGAMP stimulation. Quantification of LC3-II expression levels in k is shown in the right panel (mean ± s.d.; from three independent experiments). P < 0.05, ∗∗P < 0.01
Fig. 5
Fig. 5
STING activation is essential for the activation of autophagy. a Sting knockout HeLa cells were transfected with plasmids encoding wild-type Flag-STING or its dimerization mutants (W161A, Y164A, I165R, and W161A/Y164A/I165R) for 24 h. Lysates were then immunoblotted to analyze LC3-ΙΙ conversion. Quantification of LC3-II and P-TBK1 expression levels in a is shown in the right panel (mean ± s.d.; from three independent experiments). P < 0.05, ∗∗P < 0.01. b Sting knockout HeLa cells were transfected with plasmids expressing GFP-LC3 together with control vector (Flag-3.0), wild-type Flag-STING or the indicated STING dimerization mutants. LC3 punctum formation was assessed by immunofluorescence microscopy. Scale bar: 10 µm. Quantification of the numbers of LC3 puncta per cell in b is shown below the confocal images (mean ± s.d.; n > 100 cells from three independent experiments). ∗∗∗P < 0.001. c Sting knockout HeLa cells were transfected with the indicated plasmids for 24 h, and the cell lysates were incubated with protein G agarose beads and indicated antibody at 4 °C overnight, then immunoblotted to analyze the interaction between LC3 and STING or its dimerization mutants. d Immunoblot analysis of the expression levels of LC3-ΙΙ in Sting knockout HeLa cells transfected with Flag-tagged STING or its cGAMP-binding mutants (S162Y, Y167W, Y240S, E260A, and S162Y/Y167W/Y240S/E260A). Quantification of LC3-II and P-TBK1 expression levels in d is shown in the right panel (mean ± s.d.; from three independent experiments). P < 0.05. e Plasmids encoding GFP-LC3 together with wild-type STING or its cGAMP-binding mutants were transfected into Sting knockout HeLa cells for 24 h, and the LC3 dots were detected by immunofluorescence microscopy. Scale bar: 10 µm. Quantification of the numbers of LC3 dots per cell in e is shown below the confocal images (mean ± s.d.; n > 100 cells from three independent experiments). ∗∗∗P < 0.001. f Co-immunoprecipitation and immunoblot analysis of the interaction between LC3 and STING or its cGAMP-binding mutants in Sting knockout HeLa cells
Fig. 6
Fig. 6
TBK1 and IRF3 are not required for STING-induced autophagy. a–b Immunoblot analysis of LC3-ΙΙ conversion in HeLa cells transfected with the indicated siRNAs and increasing amounts of STING plasmid. Quantification of LC3-II expression levels in a–b is shown in the right panel (mean ± s.d.; from three independent experiments). P < 0.05, ∗∗P < 0.01. c–d HeLa cells were transfected with the indicated siRNAs, then stimulated with poly(dA:dT) or not. The LC3-ΙΙ expression levels were evaluated by western blotting. Quantification of LC3-II expression levels in c–d is shown in the right panel (mean ± s.d.; from three independent experiments). P < 0.05. ef HeLa cells stably expressing GFP-LC3 were transfected with the indicated siRNAs and subsequently stimulated with poly(dA:dT) for 4 h. LC3 dot formation was observed by immunofluorescence microscopy. Quantification of the numbers of LC3 puncta per cell and the knockdown efficiency of IRF3 and TBK1 are shown on the right (mean ± s.d.; n > 100 from three independent experiments cells). Scale bar: 10 µm. ∗∗∗P < 0.001. g HeLa cells were transfected with increasing amounts of plasmids expressing wild-type Flag-STING or the C-terminal truncation (Δ340–379). Cell lysates were subjected to western blotting analysis with the indicated antibodies. Quantification of LC3-II expression levels in g is shown below the Fig. 6g (mean ± s.d.; from three independent experiments). P < 0.05. h HeLa cells were co-transfected with plasmids encoding GFP-LC3 and wild-type Flag-STING or the C-terminal truncation mutant. Formation of LC3 puncta was then observed by immunofluorescence microscopy. Scale bar: 10 µm. Quantification of the numbers of LC3 dots per cell in h is shown below the confocal images (mean ± s.d.; n > 100 cells from three independent experiments). ∗∗∗P < 0.001. i Co-immunoprecipitation and immunoblot analysis of the interaction between LC3 and STING or its C-terminal truncation (Δ340–379) in Sting knockout HeLa cells
Fig. 7
Fig. 7
HSV-1 induces STING-dependent autophagy. a Sting wild-type and knockout MEF cells were infected with or without HSV-1 at a multiplicity of infection (MOI) of 1 for the indicated time. Cell lysates were then immunoblotted to analyze the LC3-ΙΙ conversion. Quantification of LC3-II expression levels in a is shown in the right panel (mean ± s.d.; from three independent experiments). P < 0.05, ∗∗P < 0.01. b Sting wild-type and deficient MEFs were transfected with GFP-LC3 plasmid with or without HSV-1 infection. Immunofluorescence microscopy was used to detect the formation of LC3 puncta. Scale bar: 10 µm. c Quantification of the numbers of LC3 puncta per cell in b (mean ± s.d.; n > 100 cells from three independent experiments). ∗∗∗P < 0.001. ns not significant. d Sting wild-type and knockout MEF cells were treated with or without HSV-1 or chloroquine (CQ), and autophagic flux was detected by western blotting. Quantification of LC3-II expression levels in d is shown in the right panel (mean ± s.d.; from three independent experiments). P < 0.05. e Immunoblot analysis of LC3-ΙΙ expression levels in Sting wild-type and knockout HeLa cells expressing the indicated plasmids with or without HSV-1 infection. Quantification of LC3-II expression levels in e is shown in the right panel (mean ± s.d.; from three independent experiments). P < 0.05, ∗∗P < 0.01

References

    1. Sun LJ, Wu JX, Du FH, Chen X, Chen ZJJ. Cyclic GMP-AMP synthase is a cytosolic DNA sensor that activates the type I interferon pathway. Science. 2013;339:786–91. doi: 10.1126/science.1232458. - DOI - PMC - PubMed
    1. Wu JX, Sun LJ, Chen X, Du FH, Shi HP, Chen C, et al. Cyclic GMP-AMP is an endogenous second messenger in innate immune signaling by cytosolic DNA. Science. 2013;339:826–30. doi: 10.1126/science.1229963. - DOI - PMC - PubMed
    1. Ishikawa H, Barber GN. STING is an endoplasmic reticulum adaptor that facilitates innate immune signalling. Nature. 2008;455:674–8. doi: 10.1038/nature07317. - DOI - PMC - PubMed
    1. Jin L, Waterman PM, Jonscher KR, Short CM, Reisdorph NA, Cambier JC. MPYS, a novel membrane tetraspanner, is associated with major histocompatibility complex class II and mediates transduction of apoptotic signals. Mol Cell Biol. 2008;28:5014–26. doi: 10.1128/MCB.00640-08. - DOI - PMC - PubMed
    1. Sun WX, Li Y, Chen L, Chen HH, You FP, Zhou X, et al. ERIS, an endoplasmic reticulum IFN stimulator, activates innate immune signaling through dimerization. Proc Natl Acad Sci USA. 2009;106:8653–8. doi: 10.1073/pnas.0900850106. - DOI - PMC - PubMed

Publication types

MeSH terms

Substances