. 2019 Jan;565(7738):180-185.
doi: 10.1038/s41586-018-0801-z. Epub 2018 Dec 19.

Thermal stress induces glycolytic beige fat formation via a myogenic state

Affiliations

Thermal stress induces glycolytic beige fat formation via a myogenic state

Yong Chen et al. Nature. 2019 Jan.

Abstract

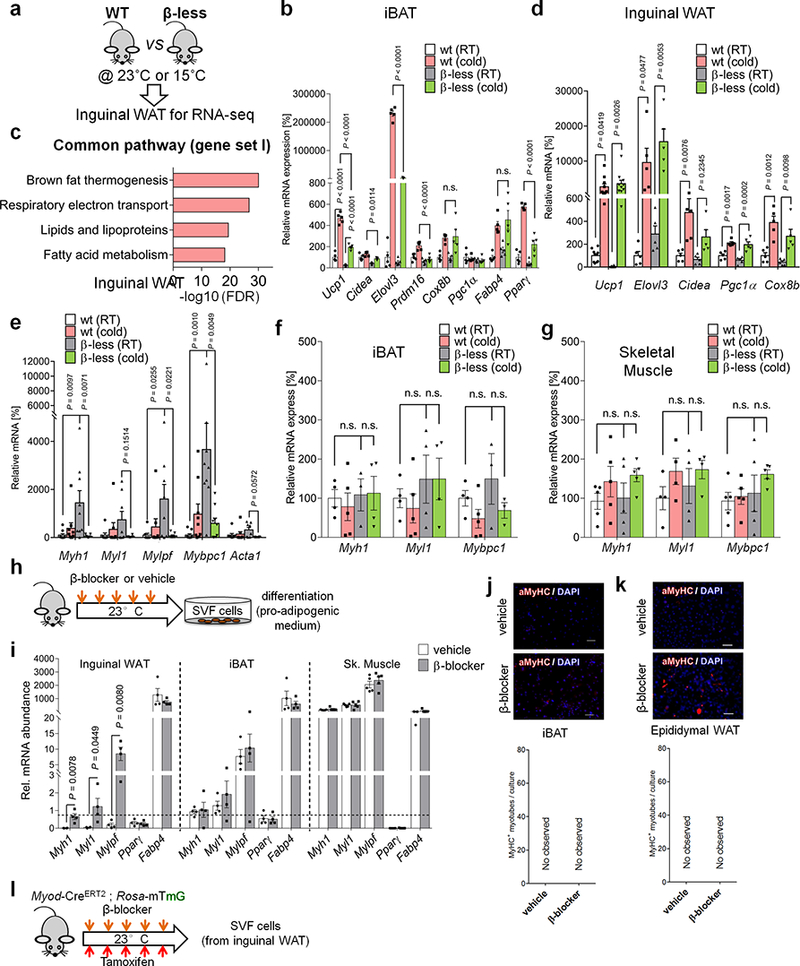
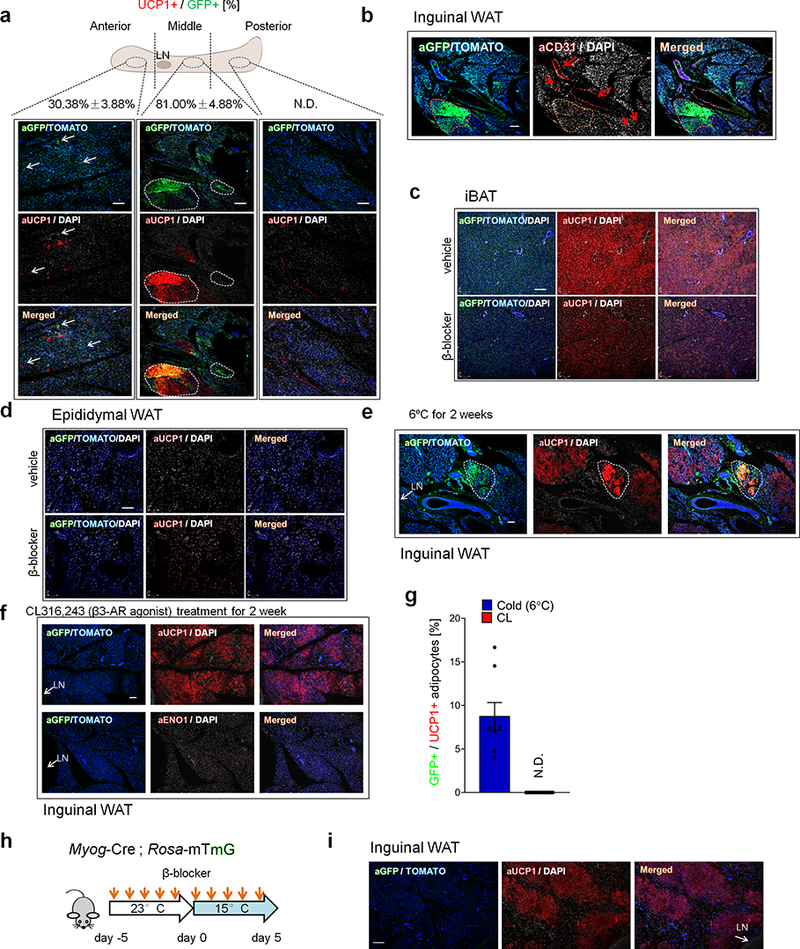
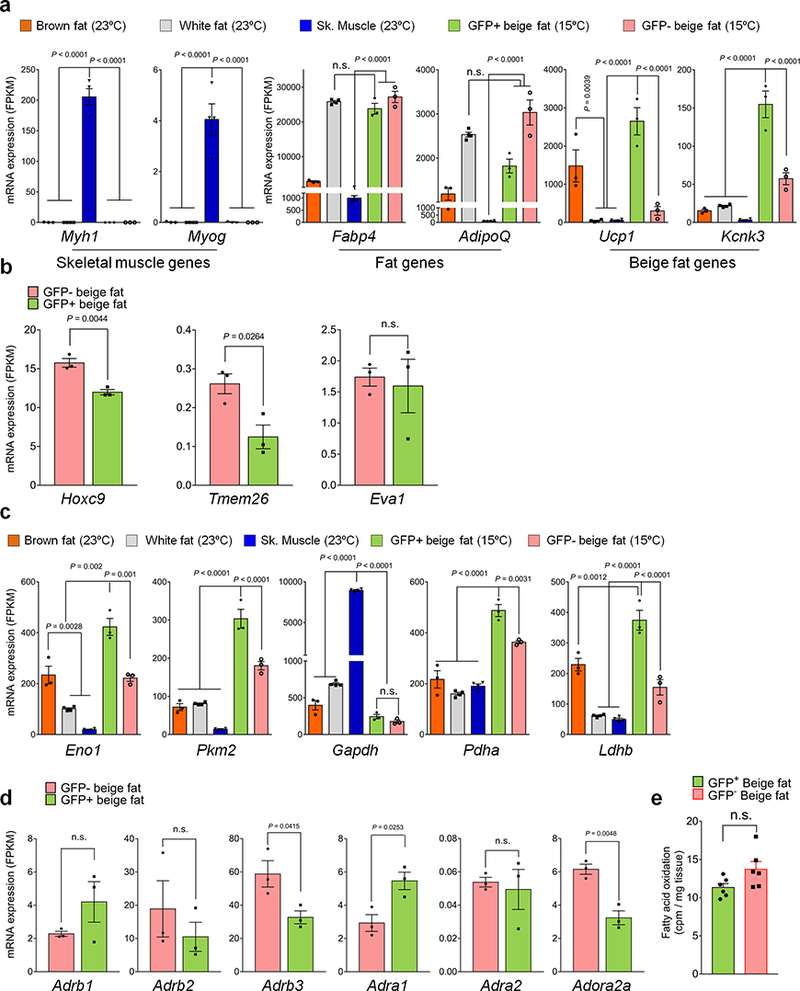
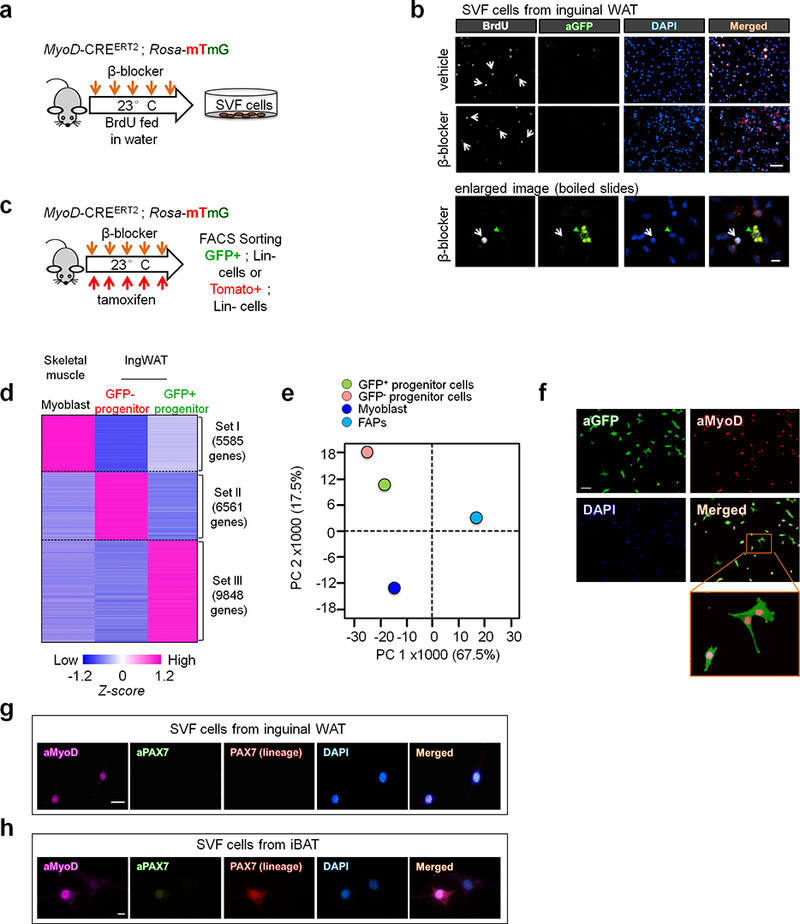
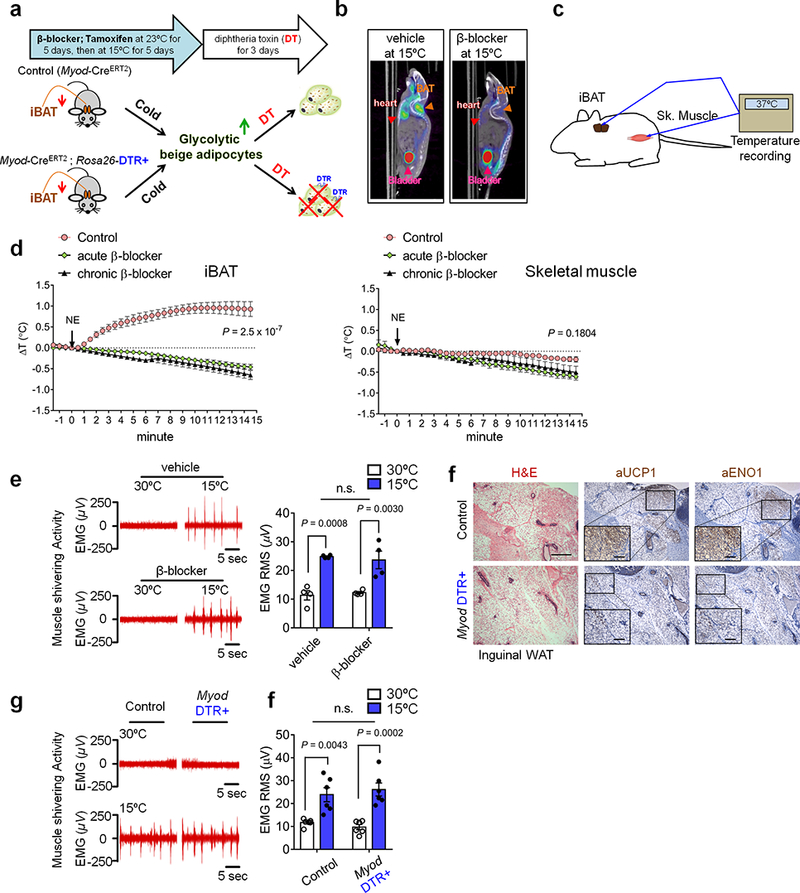
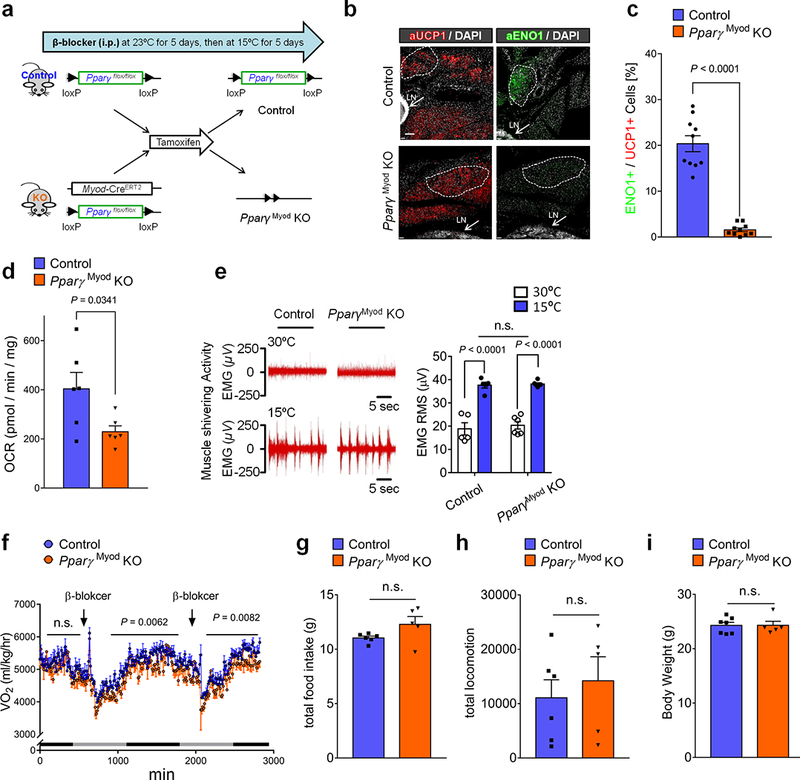
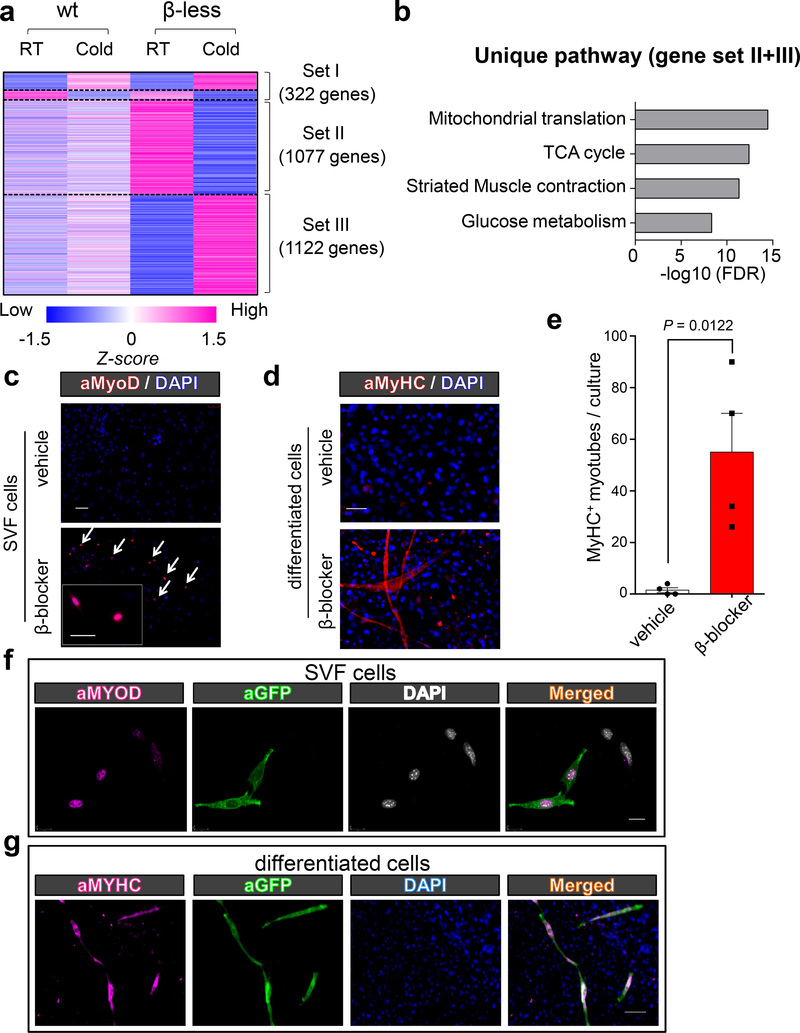
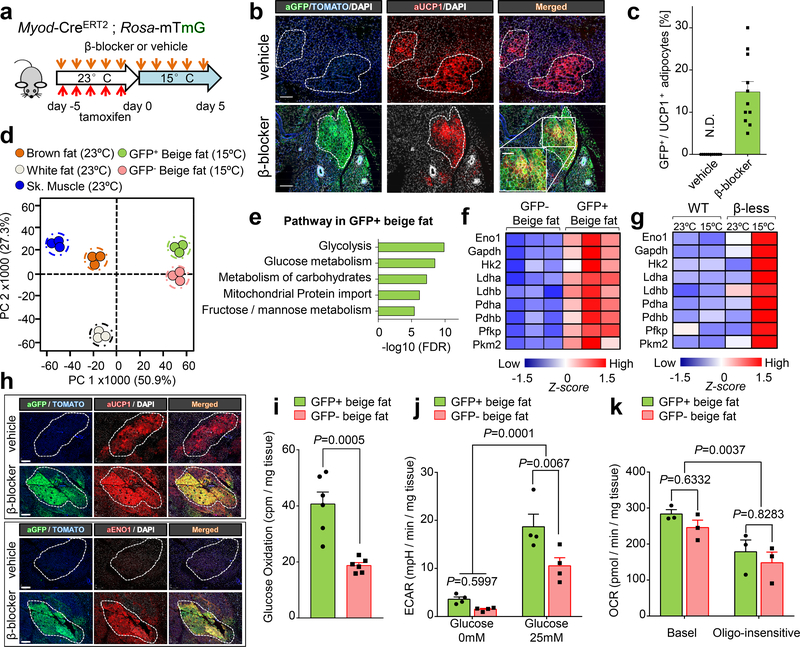
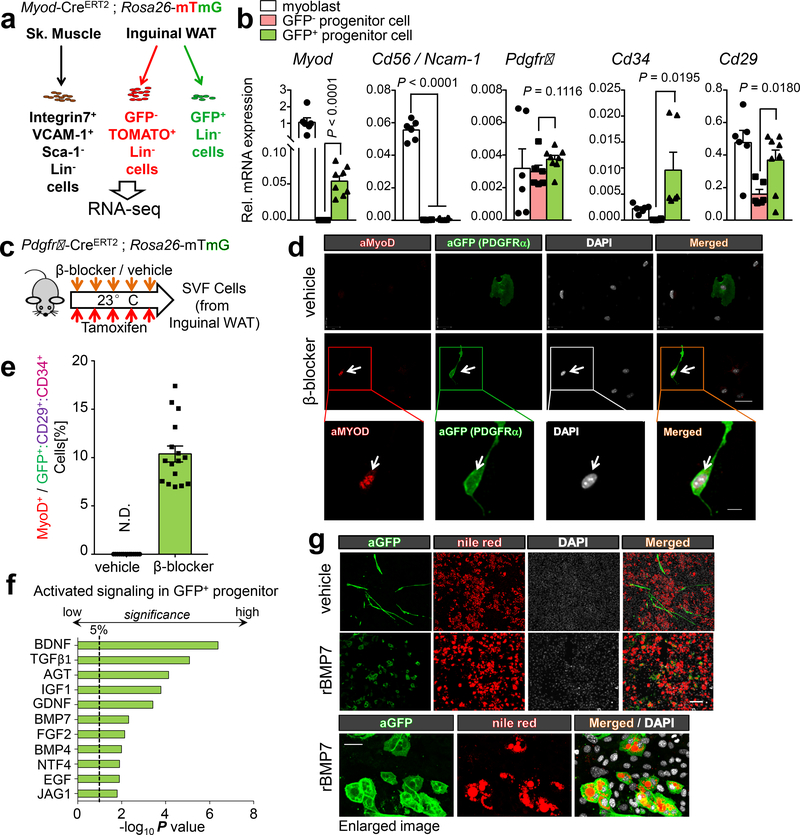
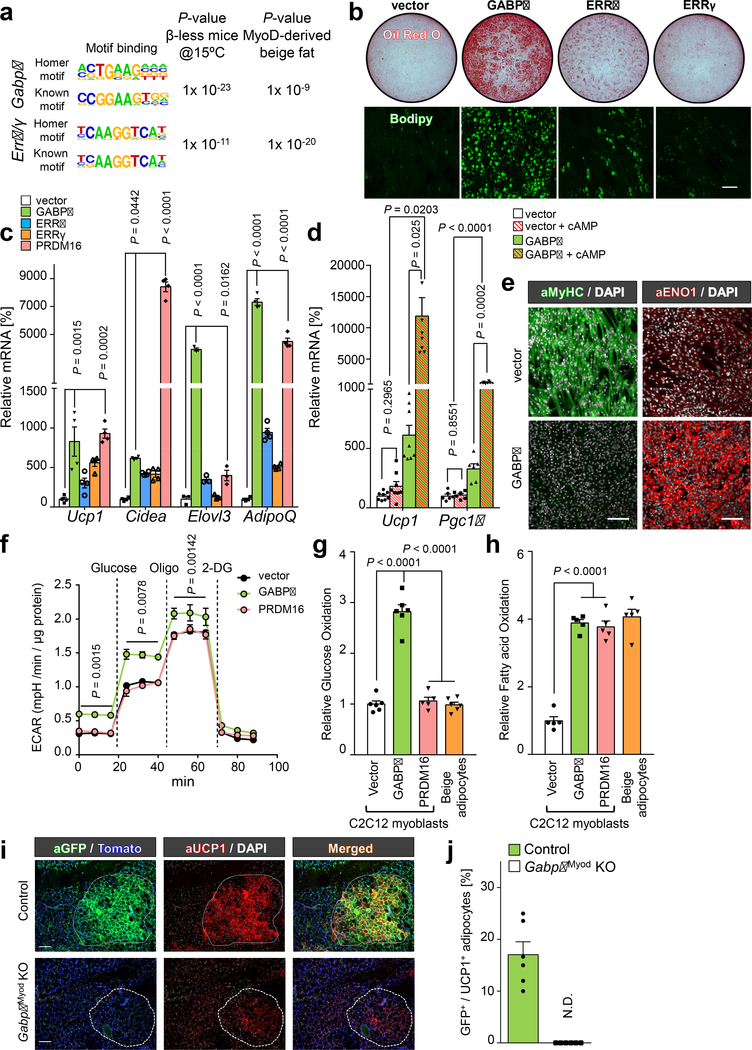
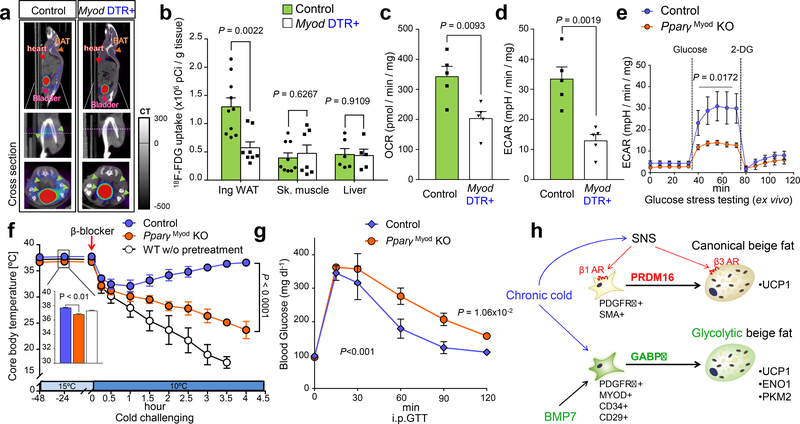
Environmental cues profoundly affect cellular plasticity in multicellular organisms. For instance, exercise promotes a glycolytic-to-oxidative fibre-type switch in skeletal muscle, and cold acclimation induces beige adipocyte biogenesis in adipose tissue. However, the molecular mechanisms by which physiological or pathological cues evoke developmental plasticity remain incompletely understood. Here we report a type of beige adipocyte that has a critical role in chronic cold adaptation in the absence of β-adrenergic receptor signalling. This beige fat is distinct from conventional beige fat with respect to developmental origin and regulation, and displays enhanced glucose oxidation. We therefore refer to it as glycolytic beige fat. Mechanistically, we identify GA-binding protein α as a regulator of glycolytic beige adipocyte differentiation through a myogenic intermediate. Our study reveals a non-canonical adaptive mechanism by which thermal stress induces progenitor cell plasticity and recruits a distinct form of thermogenic cell that is required for energy homeostasis and survival.


Conflict of interest statement

Author information The authors declare no competing interests.

Figures

Extended Data Fig.1.
Extended Data Fig.1.. Animal models with defects in β-AR signaling.
a, Schematic of the experiment. The inguinal WAT from WT and β-less mice at 23°C or 15ºC was harvested and analyzed by RNA-seq. b, mRNA expression of indicated genes in interscapular BAT (iBAT) of mice in Fig. 1a. n.s., not significant. n=5. c, GO analysis of Gene Set I in Fig. 1a. P values (−log10) by delta method–based test. d, mRNA expression of Gene Set I: Ucp1 (n=10); Elovl3 (n=5); Cidea (n=5); Pgc1α (n=5); Cox8b (n=5). e, mRNA expression of skeletal muscle related genes in inguinal WAT. Myh1 (n=9); Myl1 (n=8); Mylpf (n=8); Mybpc1 (n=9); Acta1 (n=8). f, mRNA expression of myogenesis-related genes in the iBAT of mice in (a). n.s., not significant. n=5. g, mRNA expression of indicated genes in the skeletal muscle of mice in (a). n.s., not significant. n=5. h, Schematic of the experiment. WT mice were treated with β-blocker or vehicle (saline) at 23°C for 5 days. i, mRNA expression of indicated genes in inguinal WAT (left), iBAT (middle), and skeletal muscle (right) of mice treated with β-blocker or vehicle. *P < 0.05. n=4. Data are mean ± SEM of biologically independent samples, and analyzed by unpaired two-sided Student’s t-test. j, Immuno-fluorescent staining of MyHC in differentiated SVFs from the iBAT of mice in (h). k, Immuno-fluorescent staining of MyHC in differentiated SVF cells from the epididymal WAT of mice (h). l, Schematic of the experiment. SVFs from β-blocker-treated Myod-CreERT2 reporter mice were cultured. (b,d-g) Data are mean ± SEM of biologically independent samples, and analyzed by one-way ANOVA followed by Tukey’s test. (j,k) DAPI for counter staining. The images represent three independent replicates. Scale bar=50 μm.
Extended Data Fig.2.
Extended Data Fig.2.. Myod-derived beige adipocytes in adipose tissue.
a, Immuno-fluorescent staining of GFP and UCP1 in the anterior, middle, and posterior regions of inguinal WAT of Myod-CreERT2 reporter mice. Mice were pre-treated with β-blocker and acclimated to 15°C. Scale bar=100 μm. Note that GFP+ adipocytes were enriched in the middle part of inguinal WAT near the lymph node (LN). The ratio (%) of UCP1+ cells among total GFP+ cells are shown on the top. N.D., not detected. b, Immuno-fluorescent staining of GFP and CD31 in the middle part of inguinal WAT. Myod-CreERT2 reporter mice treated with β-blocker. Scale bar=100 μm. Note that GFP+ adipocytes are localized near the CD31+ microvasculature. c, Immuno-fluorescent staining of GFP and UCP1 in the iBAT of Myod-CreERT2 reporter mice treated with β-blocker or vehicle. Scale bar=100 μm. d, Immuno-fluorescent staining of GFP and UCP1 in the epididymal WAT of mice in (c). Scale bar=100 μm. e, Immuno-fluorescent staining of GFP and UCP1 in the inguinal WAT of Myod-CreERT2 reporter mice that were acclimated to 6ºC for 2 weeks without β-blocker treatment. Scale bar=100 μm. f, Immuno-fluorescent staining of GFP and UCP1 in the inguinal WAT of Myod-CreERT2 reporter mice treated with CL316,243 (1mg kg−1 day−1) for 2 weeks. Scale bar=100 μm. g, Quantification of GFP+ beige adipocytes among total UCP1+ beige adipocytes in (e) and (f). N.D., not detected. n=8. Data are expressed as mean ± SEM of biologically independent experiments. h, Schematic of the experiment. Myog-Cre;Rosa26-mTmG reporter mice were treated with β-blocker at room temperature for 5 days and subsequently acclimated at 15° C for 5 days. i, Immuno-fluorescent staining of GFP and UCP1 in the inguinal WAT of mice in (h). Scale bar=100 μm. (a-f,i) tdTomato or DAPI for counter-stain. The images represent three independent replicates.
Extended Data Fig.3.
Extended Data Fig.3.. Molecular analyses of Myod-derived beige adipocytes.
a, mRNA expression (FPKM) of Myh1, Myog, Fabp4, Adiponectin, Ucp1, and Kcnk3 in indicated tissues. n.s., not significant. n=3 biologically independent experiments. Data are mean ± SEM, and analyzed by ANOVA followed by Tukey’s test. b, mRNA expression of beige fat markers in GFP+ and GFP- beige fat from Myod-CreERT2 reporter mice. n.s., not significant. n=3 biologically independent experiments. Data are mean ± SEM, and analyzed by unpaired Student’s t-test. c, mRNA expression of glucose metabolism genes in indicated tissues. n=3 biologically independent samples. Data are mean ± SEM, and analyzed by ANOVA followed by Tukey’s test. d, mRNA expression of adrenergic receptors in GFP+ and GFP- beige fat. n=3 biologically independent samples. Data are mean ± SEM, and analyzed by unpaired two-sided Student’s t-test. e, Fatty acid oxidation in GFP+ and GFP- beige fat. n.s., not significant. n=6 biologically independent samples. Data are mean ± SEM, and analyzed by unpaired two-sided Student’s t-test.
Extended Data Fig.4.
Extended Data Fig.4.. MyoD+ progenitors in inguinal WAT.
a, Schematic of the experiment. BrdU was administered in Myod-CreERT2 reporter mice during β-blocker treatment. b, Immuno-fluorescent staining of BrdU and GFP in the inguinal WAT-derived SVFs from Myod-CreERT2 reporter mice. Scale bar=50 μm. Enlarged image, scale bar=10 μm. c, Schematic of the experiment. GFP+ and GFP- progenitors were isolated from lineage-negative (Lin-) stromal cells in the inguinal WAT of Myod-CreERT2 reporter mice by FACS. d, Transcriptome analysis in (c). Each type of progenitors was pooled from 3 mice. Cut-off values was P < 0.05 by the delta-method-based hypothesis test. e, PCA of transcriptome dataset from indicated cells. Transcriptome of FAPs (GSE86073) is included in the analysis. f, Immuno-fluorescent staining of MyoD in isolated GFP+ progenitors in (c). Note that all the GFP+ cells express MyoD protein. Scale bar=100 μm. g, Immuno-fluorescent staining of MyoD and PAX7 in the SVFs from the inguinal WAT of Pax7-CreERT2;Rosa26-tdTomato reporter mice. Pax7 lineage cells were marked with Tomato. Scale bar=20 μm. h, Immuno-fluorescent staining of MyoD and PAX7 in the SVFs from iBAT of Pax7-CreERT2; Rosa26-tdTomato reporter mice in (g). Scale bar=10 μm. (b,f-h) DAPI was used as counter-stain. The images represent three independent experiments.
Extended Data Fig.5.
Extended Data Fig.5.. Isolation of MyoD+ progenitors from inguinal WAT.
a, Expression of CD29 and CD34 in the SVFs from Pdgfra-CreERT reporter mice. b, Sequential gating to isolate GFP+(PDGFRα+):CD34+:CD29+ cells in the SVFs from the inguinal WAT of Pdgfra-CreERT reporter mice treated with β-blocker. c, Immuno-fluorescent staining of MyoD in GFP+:CD34+:CD29+ cells isolated from the SVFs in (b). DAPI was used as counter-stain. Scale bar=25 μm. (a-c) represent three independent experiments.
Extended Data Fig.6.
Extended Data Fig.6.. Developmental regulation of MyoD+ progenitors in the inguinal WAT.
a, mRNA expression of indicated genes in isolated GFP+ and GFP- progenitors from the inguinal WAT of Myod-CreERT2 reporter mice treated with β-blocker. Smad5 (n=6 in GFP- group and n=8 in GFP+ group), Myod, Bmpr1a, Bmpr1b, and Bmpr2 (n=4). Data are mean ± SEM of biologically independent samples, and analyzed by unpaired two-sided Student’s t-test. b, Schematic of the experiment. The inguinal WAT-derived SVF cells from Myod-CreERT2 reporter mice were pre-treated with recombinant BMP7 (rBMP7) or vehicle for 2 days. Cells were subsequently differentiated under pro-adipogenic conditions for 8 days. c, Immuno-fluorescent staining of GFP and lipid droplets stained by Nile red staining in differentiated MyoD+ cells in (b). Cells were treated with indicated compounds, including Br-cAMP (200 μM), IBMX (0.5 μM), Adenosine (100 nM), agonists for α1-AR (phenylephrine, 10 μM), α2-AR (clonidine, 10 μM), β1-AR (denopamine, 10 μM), β2-AR agonist (formoterol, 2.5 μM), β3-AR (CL316,243, 0.1 μM), norepinephrine (1μM), and recombinant human BMP7 (rhBMP7, 3.3 nM), or vehicle control. DAPI was used as counter staining. The images represent three independent experiments. Scale bar=100μm.
Extended Data Fig.7.
Extended Data Fig.7.. Transcriptional regulation of g-beige adipocyte differentiation.
a, mRNA expression of Gabpα, Errα, and Errγ in GFP+ and GFP- progenitors in the inguinal WAT of Myod-CreERT2 reporter mice treated with β-blocker. n=4. b, mRNA expression of indicated genes in GFP+ and GFP- beige fat from Myod-CreERT2 reporter mice. n=3. c, Protein expression of PRDM16, EHMT1, and CKIIα in GFP+ and GFP- progenitors in the inguinal WAT of Myod-CreERT2 reporter mice. β-actin was used as a loading control. Molecular weight (kDa) is shown on the right. d, mRNA expression of indicated genes in C2C12 myoblasts expressing an empty vector, GABPα, ERRα, or ERRγ by lentivirus. n=3. e, mRNA expression of Myod in C2C12 myoblasts expressing an empty vector, GABPα, ERRα, or ERRγ by lentivirus. n.s., not significant. n=4. f, Protein expression of PPARγ and UCP1 in differentiated C2C12 cells expressing an empty vector or GABPα under pro-adipogenic conditions. β-actin was used as a loading control. Molecular weight (kDa) is shown on the right. The blots represent five independent samples. g, mRNA expression of Prdm16 in C2C12 myoblasts expressing an empty vector, GABPα, ERRα, or ERRγ by lentivirus. Differentiated immortalized beige adipocytes are included as a reference. n=4. (a,b) Data are mean ± SEM of biologically independent replicates, and analyzed by unpaired two-sided Student’s t-test. (d,e,g) Data are mean ± SEM of biologically independent replicates, and analyzed by ANOVA followed by Tukey’s test.
Extended Data Fig.8.
Extended Data Fig.8.. GABPα controls g-beige fat development.
a, Glucose uptake in differentiated cells expressing an empty vector or GABPα, and immortalized beige adipocytes. The values were normalized by total protein concentration. n=5. b, OCR of differentiated C2C12 cells expressing an empty vector, GABPα, or PRDM16. n.s., not significant. n=3. c, mRNA expression of Gabpα in differentiated cells expressing a scramble control (sh-SCR) or shRNAs targeting Gabpα (sh-Gabpα#1 and sh-Gabpα#2). n=4. d, Immuno-fluorescent staining of lipid droplets, MyHC, and GFP in differentiated C2C12 cells expressing sh-SCR or sh-Gabpα. Scale bar=50 μm. DAPI was used as counter staining. The images represent three independent experiments. e, mRNA expression of indicated genes in differentiated cells expressing sh-SCR or sh-Gabpα. Ucp1 (n=5); AdipoQ, Fabp4, Myh1, Myod (n=6). f, OCR in differentiated cells in (c). n=14. g, ECAR in differentiated cells in (c). n=14. (a-c,e) Data are mean ± SEM of biologically independent samples, and analyzed by one-way ANOVA followed by Tukey’s test. (f,g) Data are mean ± SEM of biologically independent samples, and analyzed by two-way ANOVA followed by Bonferroni’s test.
Extended Data Figure 9.
Extended Data Figure 9.. A mouse model of g-beige fat depletion.
a, Schematic of the experiment. Myod-DTR+ and control mice were pre-treated with β-blocker and tamoxifen, and subsequently acclimated to 15ºC for 5 days. DT was administered to deplete cold-induced Myod-derived g-beige fat. b,18F-FDG PET/CT images of vehicle- or β-blocker-treated mice at 15ºC. c, Schematic of tissue temperature recording in iBAT and skeletal muscle of mice. d, Changes in tissue temperature (ΔT) in iBAT and skeletal muscle. Mice were treated with saline (control) or β-blocker for 5 days (chronic β-blocker). A subset of the saline-treated mice was acutely treated with β-blocker (acute β-blocker). To stimulate thermogenesis, norepinephrine (NE) was administered at the indicated time point (black arrow). n=4 for control, n=6 for acute β-blocker treatment and n=6 for chronic β-blocker treatment. Data are expressed as mean ± SEM of biologically independent mice. P value by two-way ANOVA followed by Bonferroni’s test. e, Electromyography (EMG) measurement of skeletal muscle shivering in wild-type mice treated with β-blocker or vehicle (saline) at 30ºC or 15ºC. The shivering data were converted to the root mean square (RMS, μV). n.s., not significant. n=4 biologically independent mice. Data are expressed as mean ± SEM, and analyzed by ANOVA followed by Tukey’s test. f, H&E staining (left) and immuno-staining of UCP1 (middle) or ENO1 (right) in the inguinal WAT of control and Myod-DTR+ mice. Scale bar=100 μm; enlarged image scale bar=20 μm. The images represent five independent animals. g, EMG measurement of skeletal muscle shivering in control mice and Myod-DTR+ mice at 30ºC or 15ºC. h, Quantification of data in (g) converted to RMS (μV). n.s., not significant. n=6 biologically independent mice. Data are expressed as mean ± SEM, and analyzed by ANOVA followed by Tukey’s test.
Extended Data Fig.10.
Extended Data Fig.10.. Requirement of g-beige fat for adaptive thermogenesis in the absence of β-AR signaling.
a, Schematic of the experiment. PpargMyoD KO mice (Myod-CreERT2;Ppargflox/flox) and littermate control mice (Ppargflox/flox) were pretreated with β-blocker and tamoxifen. Subsequently, these mice were acclimated to 15°C for 5 days. b, Immuno-fluorescent staining of UCP1 and ENO1 in the inguinal WAT of PpargMyoD KO mice and controls. Scale bar=100 μm. The images represent three independent experiments. c, Quantification of glycolytic beige fat in (b). n=10. d, OCR in the inguinal WAT of PpargMyoD KO mice and littermate controls. n=6. e, EMG measurement of skeletal muscle shivering in PpargMyoD KO (n=6) and littermate control mice (n=5) at 30ºC or 15ºC. The shivering data were converted to RMS (μV). n.s., not significant. Data are mean ± SEM of biologically independent mice, and analyzed by ANOVA followed by Tukey’s test. f, Whole-body oxygen consumption (VO2) in PpargMyoD KO mice and littermate controls. Mice were treated with β-blocker treatment at indicated time points at 15°C. n=5 for PpargMyoD KO mice, n=6 for control. Data are expressed as mean ± SEM of biologically independent mice, and analyzed by two-way ANOVA followed by Bonferroni’s test. g, Total food intake in (f). h, Locomotor activity in (f). i, Body weight of PpargMyoD KO mice and littermate controls on a regular chow diet. Mice were treated with β-blocker and acclimated to 15°C for 5 days. n=5 for PpargMyoD KO mice, n=7 for littermate control mice. (c,d,g-i) Data are mean ± SEM of biologically independent samples, and analyzed by unpaired two-sided Student’s t-test.
Fig.1.
Fig.1.. β-AR blockade promotes myogenesis in inguinal WAT.
a, Transcriptomics in the inguinal WAT of WT and β-less mice at 23°C or 15ºC. n=3, biologically independent samples. P < 0.05 analyzed by two-sided t-test. b, GO analysis of Gene Set II & III. P values (−log10) by delta method–based test. c, Immuno-fluorescent staining of MyoD (arrows) in the inguinal WAT-derived SVFs from β-blocker or vehicle-treated mice. Scale bar=100 μm. d, Immuno-fluorescent staining of MyHC in differentiated SVF cells under pro-adipogenic conditions. Scale bar=100 μm. e, Quantification of MyHC+ myotubes in (d). n=4 biologically independent samples. Data are mean ± SEM, and analyzed by unpaired Student’s two-sided t-test. f, Immuno-fluorescent staining of MyoD (arrows) in the inguinal WAT-derived SVFs from Myod-CreERT2 reporter mice. Scale bar=20 μm. g, Immuno-fluorescent staining of MyHC in differentiated SVFs. Scale bar=100 μm. (c,d,f,g) DAPI as counter stain. The images represent four independent experiments.
Fig.2.
Fig.2.. MyoD+ progenitors in inguinal WAT give rise to glycolytic beige fat.
a, Schematic of the experiment. b, Immuno-fluorescent staining of GFP and UCP in the inguinal WAT of mice in (a). Scale bar=100 μm. c, Quantification of GFP+ beige adipocytes among total UCP1+ adipocytes in inguinal WAT. n=11 biologically independent samples. N.D., not detected. Data are mean ± SEM. d, PCA of transcriptome from indicated tissues. n=3 biologically independent samples. e, GO analysis of enriched genes in GFP+ beige fat in (d). f, Expression of glucose metabolism genes. n=3 biologically independent samples, P<0.05 by unpaired Student’s two-sided t-test. g, Expression of glucose metabolism genes in inguinal WAT of WT and β-less mice. n=3 biologically independent samples, P<0.05 by one-way ANOVA followed by Tukey’s test. h, Immuno-fluorescent staining of GFP, UCP1, and ENO1 in inguinal WAT of Myod-CreERT2 reporter mice at 15°C. Scale bar=100 μm. i, Glucose oxidation in GFP+ and GFP- beige fat from β-blocker-treated Myod-CreERT2 reporter mice at 15°C. n=6 biologically independent samples. Data are mean ± SEM, and analyzed by unpaired Student’s two-sided t-test. j, ECAR in GFP+ and GFP- beige fat from Myod-CreERT2 reporter mice under glucose free (0mM) or high glucose medium (25mM) conditions. n=4. k, OCR in GFP+ and GFP- beige fat from Myod-CreERT2 reporter mice. n=3. (b,h) DAPI and tdTomato for counter staining. The images represent three independent experiments. (j-k) Data are expressed as mean ± SEM of biologically independent samples, and analyzed by two-way ANOVA by Bonferroni’s test adjustment.
Fig.3.
Fig.3.. Characterization of MyoD+ progenitors.
a, GFP+ and GFP- SVFs from the inguinal WAT of Myod-CreERT2 reporter mice were applied for RNA-seq. b, Gene expression in GFP+ progenitors (n=8), GFP- progenitors (n=6), and myoblasts (n=6). Data are expressed as mean ± SEM of biologically independent samples, and analyzed by unpaired two-sided Student’s t-test. c, Inguinal WAT-derived SVFs were isolated from Pdgfrα-CreERT reporter mice with β-blocker or vehicle treatment. d, Immuno-fluorescent staining of MyoD and GFP in (c). DAPI for counter stain. Scale bar=25 μm. Enlarged image, Scale bar=10 μm. e, Quantification of MyoD+ cells in Lin-:PDGFRα+(GFP+):CD34+:CD29+ cells in the inguinal WAT of Pdgfrα-CreERT reporter mice. n=16 biologically independent samples. Data are mean ± SEM. f, Ingenuity upstream analysis of transcriptomics in GFP+ progenitors. Over-representation analysis is used and −log10 of the P values determined by the delta-method based hypothesis test. g, Immuno-fluorescent staining of GFP and Nile-red staining of lipid droplets on differentiated cells pre-treated with rBMP7 or vehicle. DAPI for counter staining. Scale bar=100 μm. Enlarged image represent of independent experiments, Scale bar=25 μm. (d,g) The images represent three independent experiments.
Fig.4.
Fig.4.. GABPα promotes g-beige fat differentiation in myoblasts.
a, HOMER motif analysis based on transcriptomics from β-less mice (left) and g-beige fat (right). P values represents enrichment of indicated binding motifs. b, Oil-O-Red staining and Bodipy staining of differentiated C2C12 cells expressing am empty vector or indicated factors under pro-adipogenic conditions. Scale bar=100 μm. c, mRNA expression of indicated genes in differentiated C2C12 cells. n=3–4. d, mRNA expression of Ucp1 and Pgc1α in differentiated C2C12 cells treated with or without forskolin (cAMP). n=6–8. e, Immuno-fluorescent staining of MyHC and ENO1 in differentiated C2C12 cells. DAPI for counter stain. Scale bar=100 μm. f, ECAR in differentiated C2C12 cells. n=10, biologically independent samples. Data are mean ± SEM, and analyzed by two-way ANOVA followed by Bonferroni’s test. g, Glucose oxidation in indicated cells. n=6. h, Fatty acid oxidation in indicated cells. n=5. i, Immuno-fluorescent staining of GFP and UCP1 in the inguinal WAT of control and GabpαMyod KO mice. Mice were pre-treated with β-blocker and acclimated to 15°C. tdTomato or DAPI for counter stain. Scale bar=100 μm. j, Quantification of GFP+:UCP1+ adipocytes in (i). n=6. N.D., not detected. Data are expressed as mean ± SEM. (b,e,j) The images represent three independent experiments. (c,d,g,h) Data are mean ± SEM of biologically independent samples and analyzed by ANOVA followed by Tukey’s test.
Fig.5.
Fig.5.. Requirement of g-beige fat for energy homeostasis.
d, 18F-FDG PET/CT images of control mice and Myod-DTR+ mice following cold acclimation. Green arrows indicate 18F-FDG uptake in inguinal WAT. e, Quantification of 18F-FDG uptake in indicated tissues. Inguinal WAT, Control, n=10; Myod-DTR+, n=8. In skeletal muscle, Control, n=9; Myod-DTR+, n=7. In liver, Control, n=6; Myod-DTR+, n=5. Data are expressed as mean ± SEM of biologically independent samples, and analyzed by two-sided unpaired Student’s t-test. f, OCR in inguinal WAT. n=5. g, ECAR in inguinal WAT. n=5. h, Glucose stress test in inguinal WAT of PpargMyoD KO and control mice. Glucose (25 mM) and 2-DG were added at indicated points. n=6. Data are mean ± SEM, and analyzed by ANOVA followed by Tukey’s test. i, Changes in rectal temperature during cold acclimation. Control and PpargMyoD KO mice were pre-treated with β-blocker for 5 days and acclimated to 15°C. WT mice did not receive pre-β-blocker-treatment. Acute β-blocker at the indicated arrow. Data are mean ± SD of biologically independent mice. n=6 for control mice, n=4 for PpargMyoD KO mice, and n=7 for WT mice. The inset graph: core-body temperature at 15°C. j, Glucose tolerance test in mice treated with β-blocker and acclimated to 15°C. n=7 for control, n=5 for PpargMyoD KO mice. Data are expressed as mean ± SEM of biologically independent mice. k, A mechanism of g-beige adipocyte development. see text in detail. (b,c,d) The images represent three independent experiments. (f,g) Data are mean ± SEM of biologically independent samples, and analyzed by two-sided unpaired Student’s t-test. (i,j) Data are analyzed by two-way ANOVA followed by Bonferroni’s test.

Comment in

  • Fat cells with a sweet tooth.
    Sun W, Wolfrum C. Sun W, et al. Nature. 2019 Jan;565(7738):167-168. doi: 10.1038/d41586-018-07739-6. Nature. 2019. PMID: 30622347 No abstract available.
  • A new shade of beige.
    Kriebs A. Kriebs A. Nat Rev Endocrinol. 2019 Mar;15(3):127. doi: 10.1038/s41574-019-0157-y. Nat Rev Endocrinol. 2019. PMID: 30651635 No abstract available.

References

    1. Collins S beta-Adrenoceptor Signaling Networks in Adipocytes for Recruiting Stored Fat and Energy Expenditure. Frontiers in endocrinology 2, 102, doi:10.3389/fendo.2011.00102 (2011). - DOI - PMC - PubMed
    1. Seale P et al. Prdm16 determines the thermogenic program of subcutaneous white adipose tissue in mice. The Journal of clinical investigation 121, 96–105 (2011). - PMC - PubMed
    1. Ikeda K et al. UCP1-independent signaling involving SERCA2b-mediated calcium cycling regulates beige fat thermogenesis and systemic glucose homeostasis. Nature medicine 23, 1454–1465, doi:10.1038/nm.4429 (2017). - DOI - PMC - PubMed
    1. Cohen P et al. Ablation of PRDM16 and Beige Adipose Causes Metabolic Dysfunction and a Subcutaneous to Visceral Fat Switch. Cell 156, 304–316, doi:10.1016/j.cell.2013.12.021 (2014). - DOI - PMC - PubMed
    1. Sharp LZ et al. Human BAT possesses molecular signatures that resemble beige/brite cells. PloS one 7, e49452 (2012). - PMC - PubMed

Publication types

MeSH terms

Substances