. 2018 Nov 27:13:8051-8062.
doi: 10.2147/IJN.S186644. eCollection 2018.

Chemiplasmonics for high-throughput biosensors

Affiliations

Chemiplasmonics for high-throughput biosensors

Achyut J Raghavendra et al. Int J Nanomedicine. .

Abstract

Background: The sensitivity of ELISA for biomarker detection can be significantly increased by integrating fluorescence with plasmonics. In surface-plasmon-coupled emission, the fluorophore emission is generally enhanced through the so-called physical mechanism due to an increase in the local electric field. Despite its fairly high enhancement factors, the use of surface-plasmon-coupled emission for high-throughput and point-of-care applications is still hampered due to the need for expensive focusing optics and spectrometers.

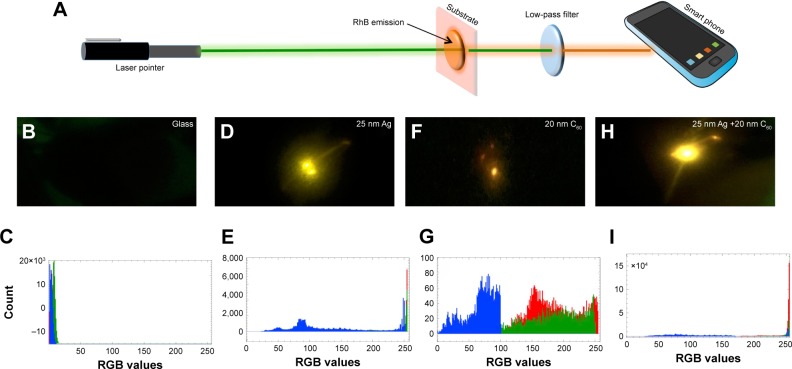
Methods: Here, we describe a new chemiplasmonic-sensing paradigm for enhanced emission through the molecular interactions between aromatic dyes and C60 films on Ag substrates.

Results: A 20-fold enhancement in the emission from rhodamine B-labeled biomolecules can be readily elicited without quenching its red color emission. As a proof of concept, we demonstrate two model bioassays using: 1) the RhB-streptavidin and biotin complexes in which the dye was excited using an inexpensive laser pointer and the ensuing enhanced emission was recorded by a smartphone camera without the need for focusing optics and 2) high-throughput 96-well plate assay for a model antigen (rabbit immunoglobulin) that showed detection sensitivity as low as 6.6 pM.

Conclusion: Our results show clear evidence that chemiplasmonic sensors can be extended to detect biomarkers in a point-of-care setting through a smartphone in simple normal incidence geometry without the need for focusing optics. Furthermore, chemiplasmonic sensors also facilitate high-throughput screening of biomarkers in the conventional 96-well plate format with 10-20 times higher sensitivity.

Keywords: biosensor; fluorescence; fullerenes; nanosilver; surface plasmons.


Conflict of interest statement

Disclosure The authors report no conflicts of interest in this work.

Figures

Figure 1
Figure 1
(A) The emission spectra of rhodamine B (RhB) adsorbed on bare glass and 25 nm Ag-coated glass with increasing thicknesses of C60 (0–35 nm). The solid traces represent fits to the spectra, from which the deconvoluted peaks for each spectrum were obtained. The area under the spectra was used to calculate the enhancement factors (relative to glass) as a function of C60 thickness shown in (B). (C) Schematic of the chemiplasmonic substrate used in this study for obtaining the emission spectra in (A).
Figure 2
Figure 2
Fluorescence microscope images of rhodamine B (RhB)-coated glass (A), glass +25 nm Ag (B), and glass +25 nm Ag +20 nm C60 (C). The bright spots arise from accumulated RhB. The figures are 100×100 microns. The magnification is 10×. (D) The corresponding RhB emission spectra from different substrates (glass, 25 nm Ag, 20 nm C60, and 25 nm Ag +20 nm C60) clearly show that the Ag layer quenches the red emission from RhB (shown by green hatched area in 25 nm Ag spectrum). The gray colored circles in the top two spectra show the magnified (×10) RhB spectrum on the glass for comparison.
Figure 3
Figure 3
(A) The emission spectra of rhodamine B (RhB) adsorbed on a bare glass substrate with increasing thickness of C60 (0–30 nm). The solid lines show the fits to the spectra along with the deconvoluted peaks under each spectrum. (B) When the C60 film thickness reached 20 nm, an emission enhancement of ~1.5 was observed due to the π–π interactions between the RhB molecules and C60. (C) The adsorption isotherms for RhB on C60 show an increasing trend unlike 25 nm Ag or bare glass substrates, suggesting the presence of strong π-orbital interactions between C60 and RhB.
Figure 4
Figure 4
(A) The molecular electrostatic potential for rhodamine B (RhB) shows that its carboxylic group is electron rich (yellow color). (B) The interaction of RhB with C60 results in the rotation of its carboxylic group in the benzoic acid above the xanthene ring by 32°.
Figure 5
Figure 5
(A) A schematic showing the model biotin–streptavidin assay on pure C60 layers of varying thickness. The biotin–streptavidin is flexible to allow the direct interaction between rhodamine B (RhB) attached to streptavidin with the underlying C60 layers. (B) The emission spectrum of the biotin–streptavidin–RhB complex on C60 layers with varying thickness displays a clear enhancement (shown in (C)) due to the chemical interactions between C60 and RhB. The solid lines in (B) show the fits to the spectra along with the deconvoluted peaks under each spectrum.
Figure 6
Figure 6
(A) The emission spectra of biotin–streptavidin–rhodamine B (RhB) adsorbed on the pure glass and 25 nm Ag-coated glass with different thicknesses of C60 (0–30 nm). The solid lines show the fits to the spectra along with the deconvoluted peaks under each spectrum. The area under the spectra was used to calculate the enhancement factors relative to glass shown in (B). (C) A schematic showing the model biotin–streptavidin assay on Ag + C60 layers of varying thickness geometry that was used for obtaining the emission spectra in (A).
Figure 7
Figure 7
Fluorescence microscope images of biotin–streptavidin–rhodamine B (RhB) on glass (A), glass +25 nm Ag (B), glass +25 nm Ag +20 nm C60 (C), and glass +25 nm Ag +30 nm C60 (D). All the scale bars are 50 µm; the magnification is 10×.
Figure 8
Figure 8
(A) A schematic showing the setup for smartphone-based sensing. A laser pointer emits green light to excite rhodamine B (RhB) coated on different substrates (shown in pink). The excited RhB molecules emit orange-red light, which could be captured by the smartphone through a low-pass filter. (BI) The photographs of RhB emission obtained using a smartphone. The photographs were analyzed using ImageJ software for obtaining the red, green, blue values. It should be noted that RGB values are integer values ranging between 0 and 255 and allow for the identification of ~16.7 million colors.
Figure 9
Figure 9
(A) A 96-well plate assay showing the scheme for rabbit IgG immunoassay. (B) The emission of dye-labeled antirabbit IgG on Ag + C60-coated 96-well plate showed ~10 times enhancement relative to the uncoated well plate. The slope of the emission intensity vs analyte concentration for Ag + C60 well plate was an order of magnitude higher than the uncoated plate, leading to an order of magnitude lower limit of detection.

References

    1. Vasan AS, Mahadeo DM, Doraiswami R, Huang Y, Pecht M. Point-of-care biosensor system. Front Biosci. 2013;5(1):39–71. - PubMed
    1. Roda A, Michelini E, Zangheri M, di Fusco M, Calabria D, Simoni P. Smartphone-based biosensors: a critical review and perspectives. TrAC Trends Analyt Chem. 2016;79:317–325.
    1. Tokel O, Inci F, Demirci U. Advances in plasmonic technologies for point of care applications. Chem Rev. 2014;114(11):5728–5752. - PMC - PubMed
    1. Hu J, Wang S, Wang L, et al. Advances in paper-based point-of-care diagnostics. Biosens Bioelectron. 2014;54:585–597. - PubMed
    1. World Health Organization World Health Statistics 2014. 2014. [AccessedSeptember 6, 2018]. p. 175. Available from: https://www.who.int/gho/publications/world_health_statistics/2014/en/