Clinical Trial
. 2018 Dec 5:9:2783.
doi: 10.3389/fimmu.2018.02783. eCollection 2018.

Multivariate Computational Analysis of Gamma Delta T Cell Inhibitory Receptor Signatures Reveals the Divergence of Healthy and ART-Suppressed HIV+ Aging

Affiliations
Clinical Trial

Multivariate Computational Analysis of Gamma Delta T Cell Inhibitory Receptor Signatures Reveals the Divergence of Healthy and ART-Suppressed HIV+ Aging

Anna C Belkina et al. Front Immunol. .

Abstract

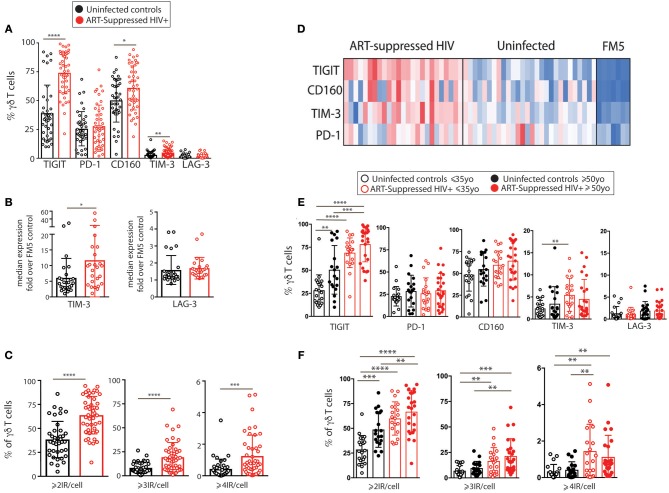
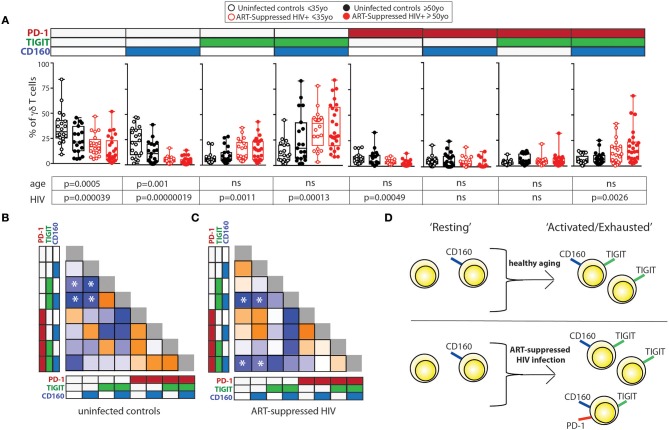
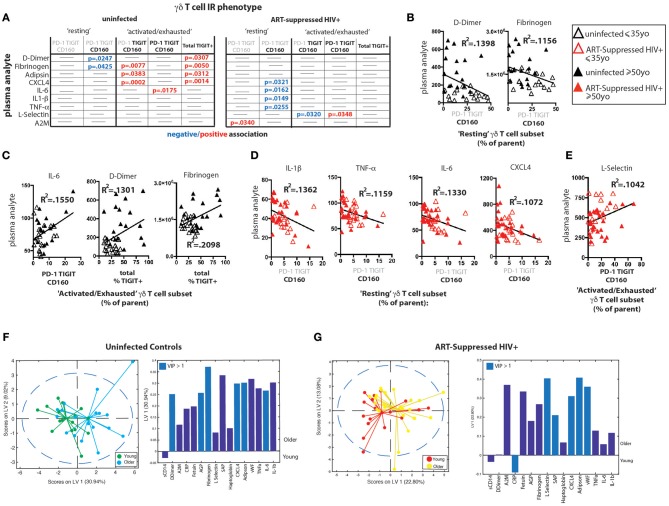
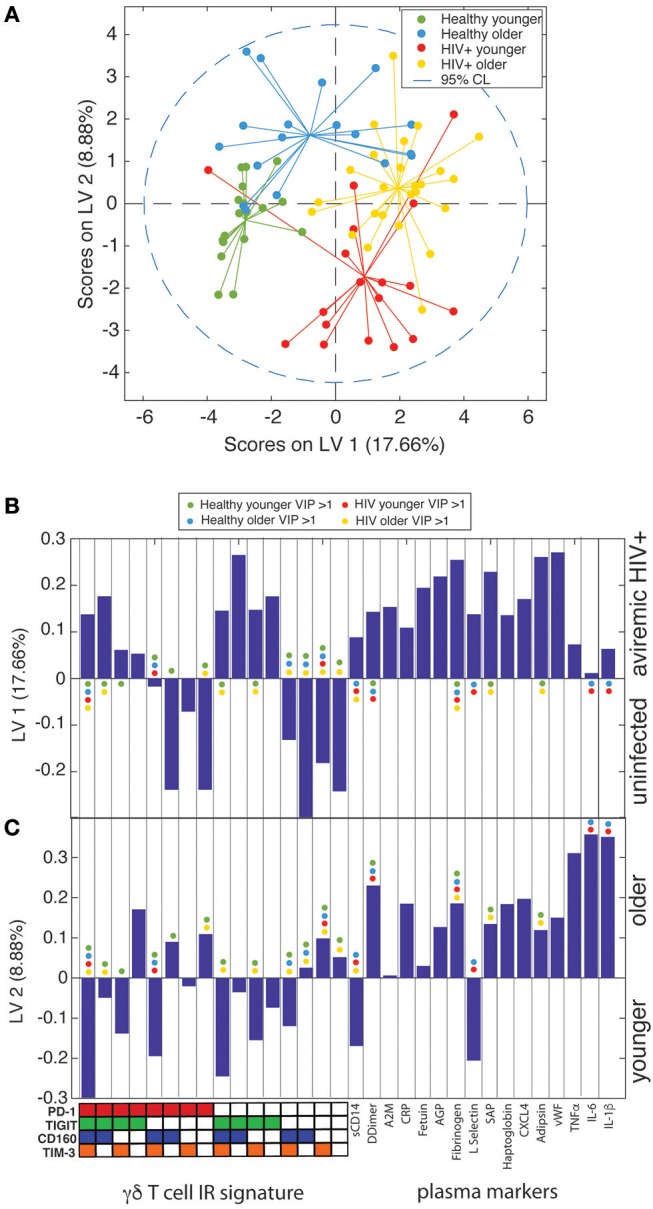
Even with effective viral control, HIV-infected individuals are at a higher risk for morbidities associated with older age than the general population, and these serious non-AIDS events (SNAEs) track with plasma inflammatory and coagulation markers. The cell subsets driving inflammation in aviremic HIV infection are not yet elucidated. Also, whether ART-suppressed HIV infection causes premature induction of the inflammatory events found in uninfected elderly or if a novel inflammatory network ensues when HIV and older age co-exist is unclear. In this study we measured combinational expression of five inhibitory receptors (IRs) on seven immune cell subsets and 16 plasma markers from peripheral blood mononuclear cells (PBMC) and plasma samples, respectively, from a HIV and Aging cohort comprised of ART-suppressed HIV-infected and uninfected controls stratified by age (≤35 or ≥50 years old). For data analysis, multiple multivariate computational algorithms [cluster identification, characterization, and regression (CITRUS), partial least squares regression (PLSR), and partial least squares-discriminant analysis (PLS-DA)] were used to determine if immune parameter disparities can distinguish the subject groups and to investigate if there is a cross-impact of aviremic HIV and age on immune signatures. IR expression on gamma delta (γδ) T cells exclusively separated HIV+ subjects from controls in CITRUS analyses and secretion of inflammatory cytokines and cytotoxic mediators from γδ T cells tracked with TIGIT expression among HIV+ subjects. Also, plasma markers predicted the percentages of TIGIT+ γδ T cells in subjects with and without HIV in PSLR models, and a PLS-DA model of γδ T cell IR signatures and plasma markers significantly stratified all four of the subject groups (uninfected younger, uninfected older, HIV+ younger, and HIV+ older). These data implicate γδ T cells as an inflammatory driver in ART-suppressed HIV infection and provide evidence of distinct "inflamm-aging" processes with and without ART-suppressed HIV infection.

Keywords: HIV; TIGIT; aging; checkpoint inhibition; citrus; immune exhaustion; inflammation; γδ T cell.


Figures

Figure 1
Figure 1
TIGIT, CD160, and TIM-3 on γδ T cells distinguish ART-suppressed HIV+ subjects from uninfected controls. CITRUS analysis of a 16-parameter flow cytometry dataset from PBMC of ART-suppressed HIV+ subjects and uninfected controls. (A) Model selected by minimum cross-validated error rate yielded four clusters necessary to differentiate the groups, numbered 1–4 and highlighted in red. (B) TIGIT expression of cells in clusters 1–4 in the ART-suppressed HIV+ (red) and uninfected control (blue) groups, log-transformed Mean Fluorescence Intensity (MFI) is shown, and each dot represents one subject, (C) expression of other measured antigens on cells from clusters 1–4 as compared to all other (background) cells; (D) Model constrained to include all significant clusters below a FDR threshold of 1% reveals seven clusters with significantly different expression of TIGIT, CD160, and/or TIM-3 between the groups, (E) log-transformed MFI of CD160, TIM-3, and TIGIT expression per subject for clusters 3, 4, and 5–7, respectively, and (F) expression of other measured antigens on cells from clusters 5, 6, and 7. All scales in (B,C,E,F) are log-transformed. CITRUS clustering data per lineage channel are shown in Supplementary Figure 1.
Figure 2
Figure 2
IR expression on γδ T cells from ART-suppressed HIV+ subjects and uninfected controls stratified into younger and older groups. (A) The total percentages of IR+ γδ T cells in ART-suppressed HIV+ subjects and uninfected control groups; (B) the average fluorescence intensity of γδ T cell TIM-3 and LAG-3 expression for HIV+ and uninfected subjects, determined by median intensity divided by FM5 control results; (C) the percentage of γδ T cells expressing ≥2, ≥3, or ≥4 IRs, in any combination, of CD160, TIGIT, TIM-3, LAG-3, and PD-1 in HIV+ subjects and controls, (D) median intensity of IR expression on SPADE-identified γδ T cells per individual (one subject per column), including FM5 uninfected control samples from each batch run; (E) total percentages of IR+ γδ T cells and (F) percentages of γδ T cells expressing ≥2, ≥3, or ≥4 IRs, in any combination, of TIGIT, PD-1, CD160, TIM-3, and LAG-3, with subjects stratified by both HIV status and age. For (A–C), two-tailed t-tests were performed for each comparison. For graphs with multiple comparisons (E,F) only significant results after Bonferroni correction (p < 0.008) are shown. *p > 0.05, **p > 0.01, ***p > 0.001, ****p > 0.0001.
Figure 3
Figure 3
Inhibitory receptor signatures of γδ T cells vary with aging, ART-suppressed HIV infection. (A) γδ T cell IR signature analysis of TIGIT, CD160, and PD-1 comparing younger and older subjects and ART-suppressed HIV+ and matched uninfected control groups. Positivity of PD-1, TIGIT, and CD160 is noted above each graph, with the white and colored boxes representing negative and positive expression, respectively. Abundance for each subset of γδ T cells expressing specific IRs was compared across the four groups using beta regression of abundance on HIV status and age group. Significance of age and HIV infection was determined after correcting for multiple hypotheses testing as described in the Materials and Methods section. (B) Correlation analysis of the abundances of each IR expressing subset of γδ T cells in uninfected controls and (C) ART-suppressed HIV+ subjects. Heatmaps are colored based on strength of the Pearson correlation coefficient between each IR subset (orange: positive, blue: negative). Both age groups are included in each heatmap. The Pearson correlation coefficients and p-values for these analyses are shown in Supplementary Figure 3. Asterisks indicate biologically interesting correlations used to inform (D) diagram depicting the hypothesized differential progression of IR expression due to healthy aging vs. ART-suppressed HIV infection.
Figure 4
Figure 4
γδ T cell ex vivo spontaneous cytokine secretion profiles reveal differential associations with IR expression and age in ART-suppressed HIV infection and uninfected controls. (A) sCD137 (pg) secreted per cultured γδ T cell from all HIV+ subjects compared with uninfected controls, and with data also stratified into younger and older sub-groups. (B) Tables showing the linear regression analysis results for the 10 analytes that significantly correlated with an IR signature-expressing γδ T cell subset in either subject group as defined in Figure 3D. Positive and negative expression of each IR is depicted with black bold and gray lettering, respectively, at the top of each table. (C) Linear regression plots of the percentage of TIGIT+ γδ T cells and cytokine concentration (average per cell) for uninfected controls and ART-suppressed HIV+ subjects for the 8 analytes that highlight the opposite trends between the subject groups (results from the other 3 analytes with >45% subject cells responding are shown in Supplementary Figure 3). Subjects within the younger and older groups are noted with open and solid triangles, respectively. Units for secreted analytes are as follows: sCD137, Granzyme A, Granzyme B, perforin, MIP-1β; pg/cell; TNF-α, IFN-γ, CCL20/MIP-3 α; pg × 104/cell. Scores plot and LV1 derived from a PLSR model of supernatant cytokines regressed against the percentage of TIGIT+ γδ T cells for each donor for uninfected controls (D) and ART-suppressed HIV+ subjects (E). Dotted lines in (D) and (E) show the 95% confidence interval. *p > 0.05, **p > 0.01, ***p > 0.001, ****p > 0.0001.
Figure 5
Figure 5
γδ T cell IR signatures correlate with inflammatory plasma markers in both healthy aging and ART-suppressed HIV infection. Sixteen plasma analytes were measured and linear regression analysis was performed with the percentages of IR expressing γδ T cell subsets defined in Figure 3D (positive and negative expression of each IR is depicted with black bold and gray lettering, respectively, at the top of each table) and total percent TIGIT+; all statistically significant results (p < 0.05) are shown in the tables in (A) for uninfected controls and ART-suppressed HIV+ subjects. Examples of correlation plots with a fitted linear regression line comparing “Resting” or “Activated/Exhausted” γδ T cell subsets from uninfected controls with plasma inflammatory/coagulation markers (B,C) and analogous graphs for the ART-suppressed HIV+ subjects (D,E). Subjects within the younger and older groups are noted with open and solid triangles, respectively, in (B–E). Units for plasma analytes are as follows: D-Dimer, fibrinogen, CXCL4, L-selectin; ng/ml; IL-6, IL-1β, TNF-α; pg/ml. Scores plot and loadings on LV1 derived from a PLSR model of plasma markers vs. the percentage of TIGIT+ γδ T cells for uninfected controls (F) and ART-suppressed HIV+ subjects (G).
Figure 6
Figure 6
γδ T cell IR signatures and plasma inflammatory cytokines define the divergent aging processes in ART-suppressed HIV+ individuals and uninfected controls. (A) A two-dimensional PLS-DA model constructed using the percentages of all possible combinations of the IRs PD-1, TIGIT, CD160, and TIM-3 and 16 markers of inflammation and coagulation in plasma. Each data point represents scores generated by the model, composed of all measurements for a given subject mapped onto the two-dimensional latent variable space. The percentages on the axes show the percent variance in the dataset captured by a particular LV. Dotted line shows the 95% confidence interval. (B) Bar plot showing the loadings on LV1 of all parameters used to train the PLS-DA model, which included all possible combinations of the IRs PD-1, TIGIT, CD160, and TIM-3 and the concentrations of all 16 plasma markers measured. LV1 is the latent variable that separated the scores predominantly based on presence or absence of HIV infection. The Y-axis quantifies the positive or negative contribution of a particular parameter to the indicated LV. (C) Bar plot as in (B), showing the loadings on LV2, the latent variable that separates the scores affected by patient age, of all parameters used to train the model. The colored dots in (B,C) mark the parameters (IR signatures of γδ T cells and plasma markers) with a VIP score >1 (statistically significant) for each subject group in the model.

References

    1. Wada N, Jacobson LP, Cohen M, French A, Phair J, Muñoz A. Cause-specific life expectancies after 35 years of age for human immunodeficiency syndrome-infected and human immunodeficiency syndrome-negative individuals followed simultaneously in long-term cohort studies, 1984-2008. Am J Epidemiol. (2013) 177:116–25. 10.1093/aje/kws321 - DOI - PMC - PubMed
    1. Marcus JL, Chao CR, Leyden WA, Xu L, Quesenberry CP, Klein DB, et al. . Narrowing the gap in life expectancy between HIV-infected and HIV-uninfected individuals with access to care. J Acquir Immune Defic Syndr. (2016) 73:39–46. 10.1097/QAI.0000000000001014 - DOI - PMC - PubMed
    1. Antiretroviral Therapy Cohort Collaboration. Life expectancy of individuals on combination antiretroviral therapy in high-income countries: a collaborative analysis of 14 cohort studies. Lancet (2008) 372:293–9. 10.1016/S0140-6736(08)61113-7 - DOI - PMC - PubMed
    1. Hasse B, Ledergerber B, Furrer H, Battegay M, Hirschel B, Cavassini M, et al. . Morbidity and aging in HIV-infected persons: the Swiss HIV cohort study. Clin Infect Dis. (2011) 53:1130–9. 10.1093/cid/cir626 - DOI - PubMed
    1. Schouten J, Wit FW, Stolte IG, Kootstra NA, van der Valk M, Geerlings SE, et al. . Cross-sectional comparison of the prevalence of age-associated comorbidities and their risk factors between HIV-infected and uninfected individuals: the AGEhIV cohort study. Clin Infect Dis. (2014) 59:1787–97. 10.1093/cid/ciu701 - DOI - PubMed

Publication types

MeSH terms

Substances