

Detecting the QTL-Allele System of Seed Oil Traits Using Multi-Locus Genome-Wide Association Analysis for Population Characterization and Optimal Cross Prediction in Soybean
- PMID: 30568668
- PMCID: PMC6290252
- DOI: 10.3389/fpls.2018.01793
Detecting the QTL-Allele System of Seed Oil Traits Using Multi-Locus Genome-Wide Association Analysis for Population Characterization and Optimal Cross Prediction in Soybean
Abstract
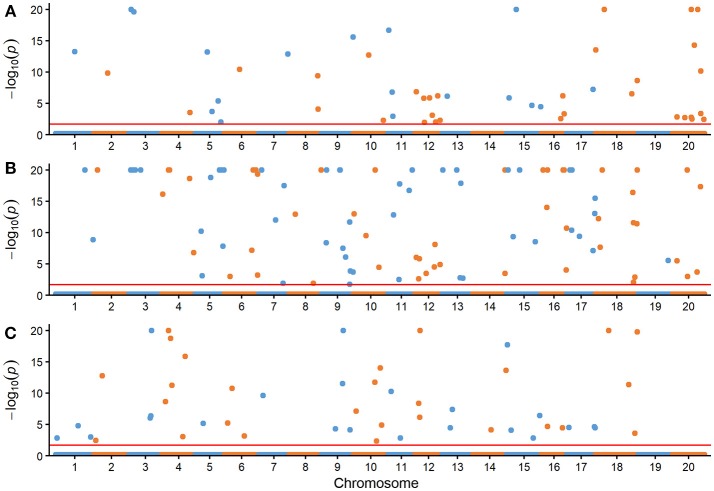
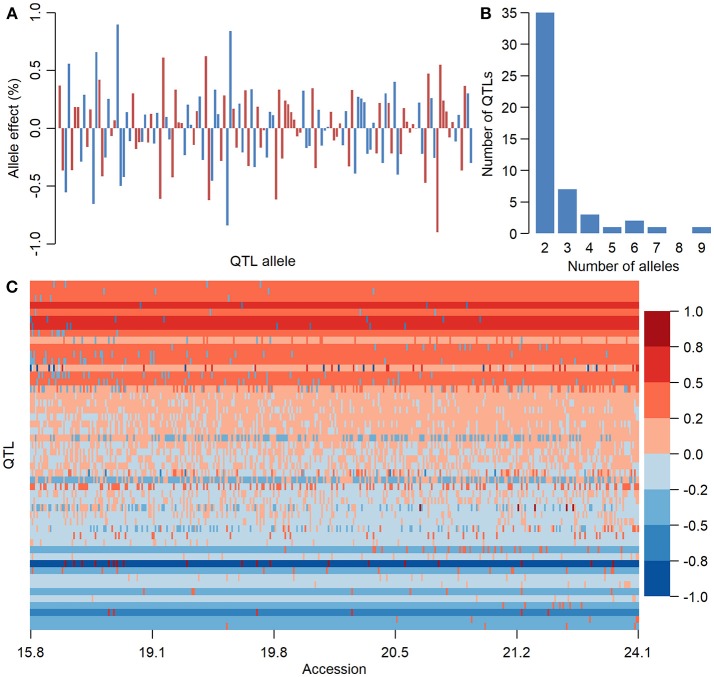
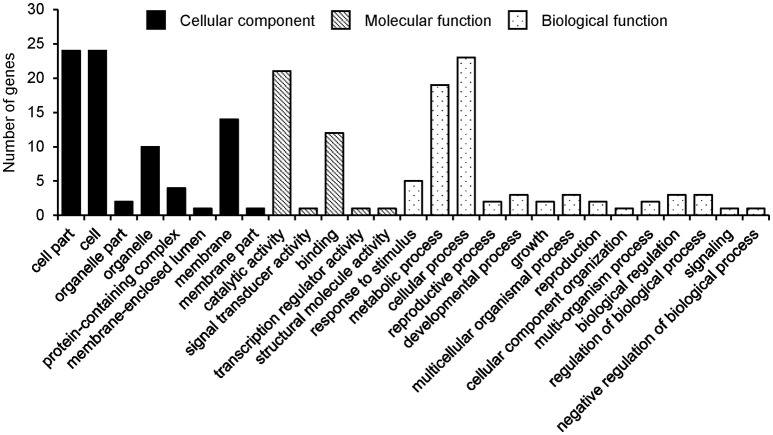
Soybean is one of the world's major vegetative oil sources, while oleic acid and linolenic acid content are the major quality traits of soybean oil. The restricted two-stage multi-locus genome-wide association analysis (RTM-GWAS), characterized with error and false-positive control, has provided a potential approach for a relatively thorough detection of whole-genome QTL-alleles. The Chinese soybean landrace population (CSLRP) composed of 366 accessions was tested under four environments to identify the QTL-allele constitution of seed oil, oleic acid and linolenic acid content (SOC, OAC, and LAC). Using RTM-GWAS with 29,119 SNPLDBs (SNP linkage disequilibrium blocks) as genomic markers, 50, 98, and 50 QTLs with 136, 283, and 154 alleles (2-9 per locus) were detected, with their contribution 82.52, 90.31, and 83.86% to phenotypic variance, corresponding to their heritability 91.29, 90.97, and 90.24% for SOC, OAC, and LAC, respectively. The RTM-GWAS was shown to be more powerful and efficient than previous single-locus model GWAS procedures. For each trait, the detected QTL-alleles were organized into a QTL-allele matrix as the population genetic constitution. From which the genetic differentiation among 6 eco-populations was characterized as significant allele frequency differentiation on 28, 56, and 30 loci for the three traits, respectively. The QTL-allele matrices were also used for genomic selection for optimal crosses, which predicted transgressive potential up to 24.76, 40.30, and 2.37% for the respective traits, respectively. From the detected major QTLs, 38, 27, and 25 candidate genes were annotated for the respective traits, and two common QTL covering eight genes were identified for further study.
Keywords: SNP linkage disequilibrium block (SNPLDB); genetic differentiation; genomic selection for optimal cross; linolenic acid content; oleic acid content; restricted two-stage multi-locus genome-wide association study (RTM-GWAS); seed oil content; soybean.
Figures
References
-
- Bahrami G. (2010). Trans and other fatty acids: effects on endothelial functions, in Fatty Acids in Health Promotion and Disease Causation, ed Watson R. R. (Urbana: AOCS Press; ), 3–43.
LinkOut - more resources
Full Text Sources