. 2018 Dec 7:6:e5998.
doi: 10.7717/peerj.5998. eCollection 2018.

RIP-MD: a tool to study residue interaction networks in protein molecular dynamics

Affiliations

RIP-MD: a tool to study residue interaction networks in protein molecular dynamics

Sebastián Contreras-Riquelme et al. PeerJ. .

Abstract

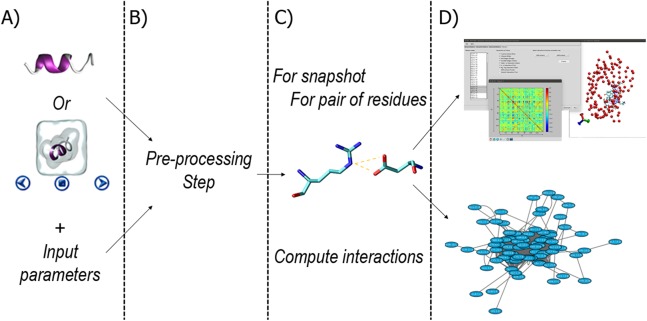
Protein structure is not static; residues undergo conformational rearrangements and, in doing so, create, stabilize or break non-covalent interactions. Molecular dynamics (MD) is a technique used to simulate these movements with atomic resolution. However, given the data-intensive nature of the technique, gathering relevant information from MD simulations is a complex and time consuming process requiring several computational tools to perform these analyses. Among different approaches, the study of residue interaction networks (RINs) has proven to facilitate the study of protein structures. In a RIN, nodes represent amino-acid residues and the connections between them depict non-covalent interactions. Here, we describe residue interaction networks in protein molecular dynamics (RIP-MD), a visual molecular dynamics (VMD) plugin to facilitate the study of RINs using trajectories obtained from MD simulations of proteins. Our software generates RINs from MD trajectory files. The non-covalent interactions defined by RIP-MD include H-bonds, salt bridges, VdWs, cation-π, π-π, Arginine-Arginine, and Coulomb interactions. In addition, RIP-MD also computes interactions based on distances between Cαs and disulfide bridges. The results of the analysis are shown in an user friendly interface. Moreover, the user can take advantage of the VMD visualization capacities, whereby through some effortless steps, it is possible to select and visualize interactions described for a single, several or all residues in a MD trajectory. Network and descriptive table files are also generated, allowing their further study in other specialized platforms. Our method was written in python in a parallelized fashion. This characteristic allows the analysis of large systems impossible to handle otherwise. RIP-MD is available at http://www.dlab.cl/ripmd.

Keywords: Molecular dynamics; Residue interaction networks; Trajectory analysis; VMD plugin.


Conflict of interest statement

Tomas Perez-Acle is an Academic Editor for PeerJ.

Figures

Figure 1
Figure 1. Workflow in RIP-MD.
(A) input of structural information and analyses parameters. (B) Pre-processing step. (C) Definition of interactions (Cα contacts, H-bonds, Salt bridges, disulfide bonds, cation-π, π–π, Arginine–Arginine, Coulomb, and van der Waals contacts) according to the input parameters. (D) Generation of RIN and output files.
Figure 2
Figure 2. Protein structures used as case of study.
First and last snapshots of the MD2 trajectory simulation (top) and molecular structure of the human CX26 hemichannel and gap-junction channel (bottom). (A) First snapshot of the MD showing the hydrophobic pocket in an open conformation. (B) Last snapshot of the MD where MD2 exhibit a closed conformation. (C) Secondary structure representation of a gap junction channels (GJC) formed by the extracellular docking of two HCs (blue and green). The position of the plasmatic membrane appears rendered in orange. The extracellular space is denoted with an “i”, while the intracellular space is denoted with an “e”. (D) Secondary structure representation of a HC from the intracellular view. Each CX26 monomer is represented using different colors.
Figure 3
Figure 3. Time series of the collective variable D0 (Eq. (1)).
The graphic shows three distinct phases of the pocket closure, as marked by the vertical dashed lines. From 0 to 1,250 ps, the pocket is in an open conformation. From 1,250 to 12,500 ps, the closing process begins and is followed by a small opening of the pocket. From 12,500 ps until the end of the simulation, the pocket remains in a closed state.
Figure 4
Figure 4. Graphic representation of changes occurring in the RIN of MD2 during the three windows of its closing process.
All edges represent Pearson absolute correlation values where |r| ≥ 0.5 in the open (A), closing (B), and closed conformation (C). Pink edges connect those AA interacting through vdW contacts while blue edges connect those AAs forming H-bonds. Red nodes indicate residues with no |r| ≥ 0.5, nodes outside the circle, Pro50, Met85, Lys125, and Pro142, do not form any interaction |r| ≥ 0.5 in any of the three conformational states. Images were created after loading the resulting networks in Cytoscape with circular layout sorted according to AA numbering, first AA is indicated by the gray arrow.
Figure 5
Figure 5. Representation of the RIN formed for the static and the dynamic structure of GJC.
(A) shows the network for the static structure and (B) shows the network for the MD simulation. Each circle represents a CX subunit using a color code for subunit in each of them: red for chain A (segments P1 and P11); purple for chain (segments P2 and P10); light blue for chain C (segments P3 and P9); green for chain D (segments P4 and P8); blue for chain E (segments P5 and P7); and gray for chain F (segments P6 and P12). Interactions thickness represent the quantity of interactions, colored with the following color code: red for Arg–Arg interactions; blue for HBs; gold for SBs; and green for π–π interactions. No self-interactions are represented.

References

    1. Araya-Secchi R, Perez-Acle T, Gu Kang S, Huynh T, Bernardin A, Escalona Y, Garate J-A, Martínez AD, García IE, Sáez JC, Zhou R. Characterization of a novel water pocket inside the human cx26 hemichannel structure. Biophysical Journal. 2014;107(3):599–612. doi: 10.1016/j.bpj.2014.05.037. - DOI - PMC - PubMed
    1. Berman HM, Westbrook J, Feng Z, Gilliland G, Bhat TN, Weissig H, Shindyalov IN, Bourne PE. The protein data bank. Nucleic Acids Research. 2000;28(1):235–242. - PMC - PubMed
    1. Bhattacharyya M, Bhat CR, Vishveshwara S. An automated approach to network features of protein structure ensembles. Protein Science. 2013;22(10):1399–1416. doi: 10.1002/pro.2333. - DOI - PMC - PubMed
    1. Brandes U. On variants of shortest-path betweenness centrality and their generic computation. Social Networks. 2008;30(2):136–145. doi: 10.1016/j.socnet.2007.11.001. - DOI
    1. Brinda KV, Vishveshwara S. A network representation of protein structures: implications for protein stability. Biophysical Journal. 2005;89(6):4159–4170. doi: 10.1529/biophysj.105.064485. - DOI - PMC - PubMed