. 2019 Apr;62(4):655-664.
doi: 10.1007/s00125-018-4786-9. Epub 2018 Dec 19.

Treatment of type 1 diabetes with teplizumab: clinical and immunological follow-up after 7 years from diagnosis

Affiliations

Treatment of type 1 diabetes with teplizumab: clinical and immunological follow-up after 7 years from diagnosis

Ana Luisa Perdigoto et al. Diabetologia. 2019 Apr.

Abstract

Aims/hypothesis: The long-term effects of successful immune therapies for treatment of type 1 diabetes have not been well studied. The Autoimmunity-Blocking Antibody for Tolerance (AbATE) trial evaluated teplizumab, an Fc receptor non-binding humanised anti-CD3 monoclonal antibody in individuals with new-onset type 1 diabetes, and ended in 2011. Clinical drug-treated responders showed an increased frequency of 'partially exhausted' CD8+ T cells. We studied the clinical, immunological and metabolic status of participants after an average follow-up of 7 years.

Methods: Participants with detectable C-peptide at year 2 of AbATE returned for follow-up. C-peptide responses were assessed by 4 h mixed-meal tolerance test. Autoantibodies and HbA1c levels were measured and average daily insulin use was obtained from patient logs. Peripheral blood mononuclear cells were analysed by flow cytometry and cytokine release.

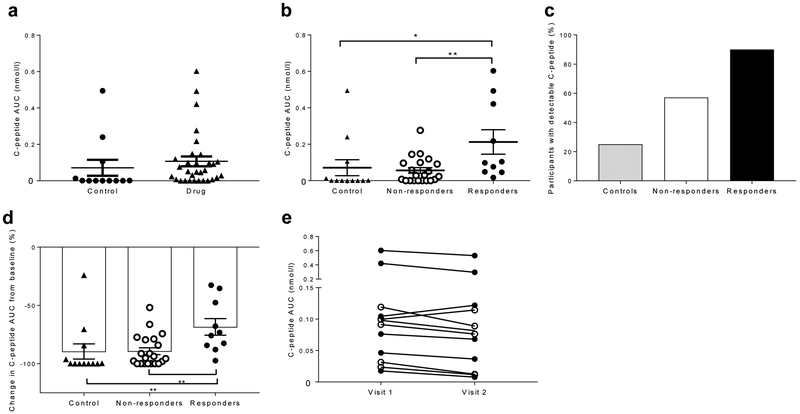
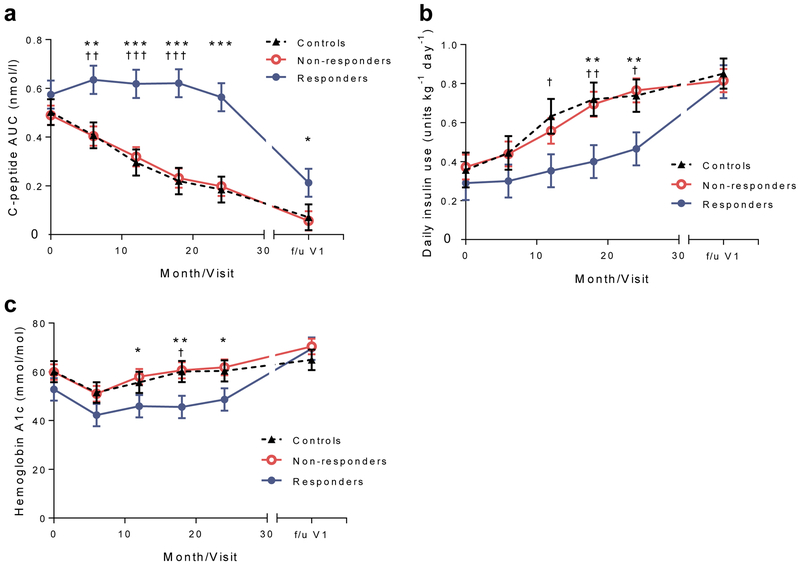
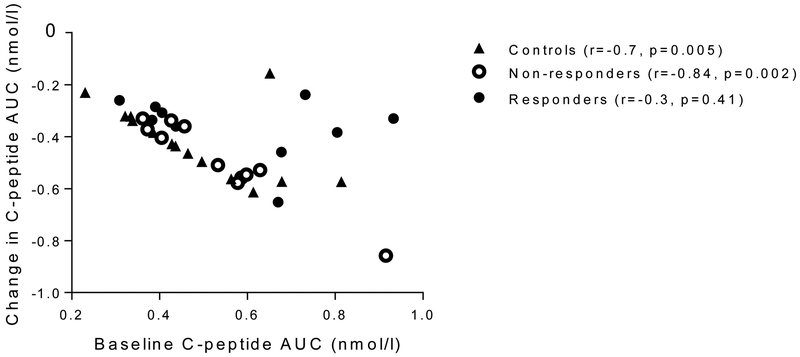
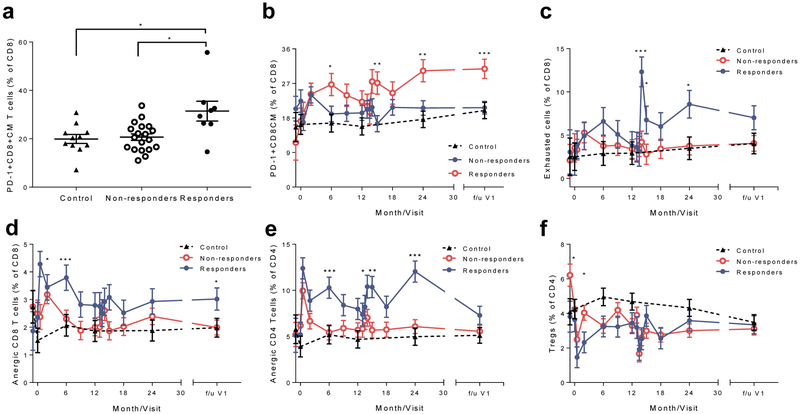
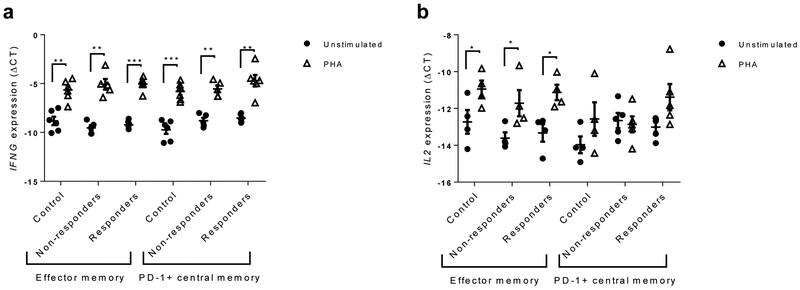
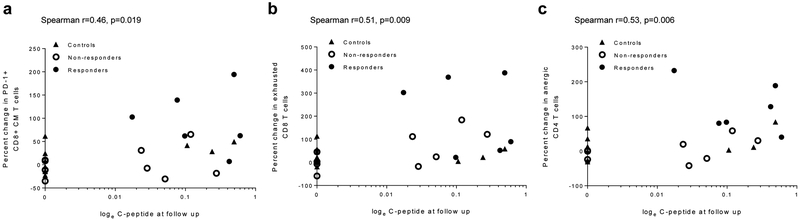
Results: Fifty-six per cent of the original participants returned. Three of the original control group who did not return had lost all detectable C-peptide by the end of the 2 year trial. The C-peptide responses to a mixed-meal tolerance test were similar overall in the drug vs control group of participants but were significantly improved, with less loss of C-peptide, in drug-treated responders identified at 1 year. However, the improvements in C-peptide response were not associated with lower HbA1c levels or insulin use. Drug-treated responders showed a significantly increased frequency of programmed cell death protein 1-positive central memory and anergic CD8+ T cells at follow-up.

Conclusions/interpretation: These findings suggest there is reduced decline in C-peptide and persistent immunological responses up to 7 years after diagnosis of diabetes in individuals who respond to teplizumab.

Trial registration: ClinicalTrials.gov NCT02067923; the protocol is available at www.immunetolerance.org (ITN027AI).

Keywords: Anergy; Anti-CD3; C-peptide; Exhaustion; T cells; Teplizumab; Type 1 diabetes.


Figures

Fig. 1
Fig. 1
C-peptide responses following an MMTT after mean follow-up of 7 years, (a) C-peptide response (loge [(AUC/240)+l]) of the control (n=12) and drug-treated participants (n=31) at follow-up visit 1, presented as nmol/l. Each symbol represents a participant. For comparison, the values were adjusted for duration of diabetes (difference not statistically significant, mixed model). (b) The C-peptide response AUC was examined in drug-treated responders, drug-treated non-responders and control participants at follow-up visit 1. (c) The percentage of participants with detectable levels of C-peptide at follow-up was higher in the drug-treated responders (n=10) vs control participants (n=12) and drug-treated non-responders (n=21) (p=0.009, χ2 test). (d) The decrease in C-peptide response AUC, as a percentage of the response at baseline, at the follow-up visit adjusted for the duration of diabetes. (e) The C-peptide response AUC did not decline significantly between follow-up visit 1 and follow-up visit 2 (mean 0.144±0.052 vs 0.120±0.043). White circles, non-responders (n=5); black circles, responders (n=7). All data are means ± SEM; *p<0.05, **p<0.01, ***p<0.001
Fig. 2
Fig. 2
Metabolic responses to teplizumab treatment, (a) C-peptide response (loge [(AUC/240)+1], in nmol/l), (b) daily insulin use and (c) HbA1c levels during the AbATE trial period (in months) and at follow-up visit 1 (f/u V1) were compared in a mixed model. Means ± SEM from the mixed model are shown; *p<0.05, **p<0.01, ***p<0.001 for comparison of drug-treated responders vs drug-treated non-responders at each time point shown; p<0.05, ††p<0.001, ††† p<0.001 for comparison of drug-treated responders and control participants at each time point shown
Fig. 3
Fig. 3
Relationship between the baseline C-peptide and the C-peptide at follow-up. The baseline C-peptide and change in C-peptide are shown for the three groups (loge[(AUC/240)+1], in nmol/l). There was a significant relationship between the baseline C-peptide and the change for the control participants (Spearman r=−0.704, p=0.005) and drug-treated non-responders (r=−0.836, p=0.002) but not the drug-treated responders (r=−0.297, p=0.41)
Fig. 4
Fig. 4
CD8+ T cell subsets during the AbATE trial period (in months) and at follow-up visit 1 (f/u V1). (a) The frequency of PD-1+ CD8+ central memory (CM) T cells was compared between the groups at the f/u V1 (p=0.018, Kruskal–Wallis test, *p<0.05 for post hoc comparisons; n=11, 19 and 8 for control participants, drug-treated non-responders and drug-treated responders, respectively). The values represent the percentage of the total CD8+ T cells, (b-f) Cell subsets: (b) PD-1+CD8+ T cells, (c) exhausted CD8+ T cells, (d) anergic CD8+ T cells, (e) anergic CD4+ T cells and (f) CD4+ Tregs were compared between the three groups using a mixed model with repeated measures. There was an increased frequency of anergic CD8+ T cells (CD8+PD-1+KLRG1CD57) (d) at follow-up visit 1, but not anergic CD4+ T cells (e) or exhausted CD8+ T cells (CD8+PD-1+KLRG1+CD57) (c) in the drug-treated responders vs drug-treated non-responders. We did not find a difference in the frequency of CD4+ Tregs between the groups except for a decline in the drug-treated responders vs drug-treated non-responders at 2 months (f). Means ± SEM from the mixed model are shown; for (b-f), n= 9–11 for controls, 8–19 for drug treated non-responders, 5–8 for drug treated responders; *p<0.05, **p<0,01, ***p<0.001 for comparison of drug-treated responders vs drug-treated non-responders at each time point shown
Fig. 5
Fig. 5
Cytokine responses of T cell subsets. IFNG (a) and IL2 mRNA expression (b) after 24 h was measured in CD8+ effector memory and PD-1+CD8+ central memory T cells stimulated with PHA, or unstimulated (expressed as ΔCt compared with actin). Data are means ± SEM; *p<0.05, **p<0,01, ***p<0.001, paired Student’s t test. For IFNG, n=6 for control and drug-treated responder groups and n=5 for drug-treated non-responder group; for IL2, due to very low expression of IL2 in some samples, n=4 for control group and n=4 for effector memory and n=5 for PD-1+CD8+ central memory T cells for the drug-treated responder and non-responder groups
Fig. 6
Fig. 6
Predictive value of changes in T cell subsets at the end of the trial (at 2 years) and C-peptide responses at follow-up. A direct relationship was observed between (a) frequency of PD-1+CD8+ central memory (CM) T cells (Spearman’s r=0.46, p=0.019), (b) exhausted CD8+ T cells (Spearman’s r=0.51, p=0.009) and (c) anergic CD4+ T cells (Spearman’s r=0.53, p=0.006) at the end of the treatment period (year 2) and the C-peptide responses at the follow-up among all participants

Comment in

References

    1. Herold KC, Vignali DA, Cooke A, Bluestone JA (2013) Type 1 diabetes: translating mechanistic observations into effective clinical outcomes. Nat Rev Immunol 13: 243–256 - PMC - PubMed
    1. Reed JC, Herold KC (2015) Thinking bedside at the bench: the NOD mouse model of T1DM. Nat Rev Endocrinol 11: 308–314 - PMC - PubMed
    1. Naushad N, Perdigoto AL, Rui J, Herold KC (2017) Have we pushed the needle for treatment of Type 1 diabetes? Curr Opin Immunol 49: 44–50 - PMC - PubMed
    1. Pescovitz MD, Greenbaum CJ, Krause-Steinrauf H, et al. (2009) Rituximab, B-lymphocyte depletion, and preservation of beta-cell function. N Engl J Med 361: 2143–2152 - PMC - PubMed
    1. Pescovitz MD, Greenbaum CJ, Bundy B, et al. (2014) B-lymphocyte depletion with rituximab and beta-cell function: two-year results. Diabetes Care 37: 453–459 - PMC - PubMed

Publication types

MeSH terms

Associated data