. 2019 Mar;597(6):1677-1690.
doi: 10.1113/JP276901. Epub 2019 Jan 21.

Ionotropic and metabotropic kainate receptor signalling regulates Cl- homeostasis and GABAergic inhibition

Affiliations

Ionotropic and metabotropic kainate receptor signalling regulates Cl- homeostasis and GABAergic inhibition

Danielle Garand et al. J Physiol. 2019 Mar.

Abstract

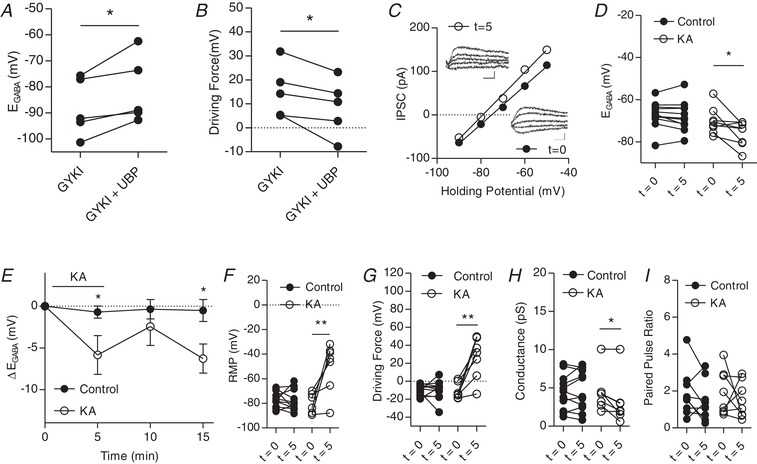
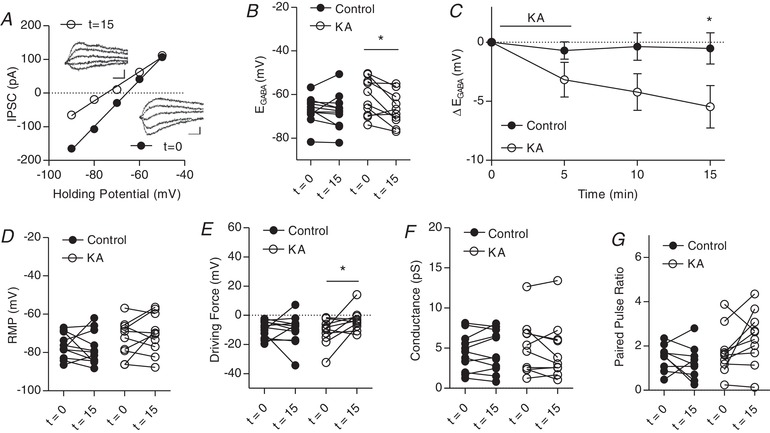
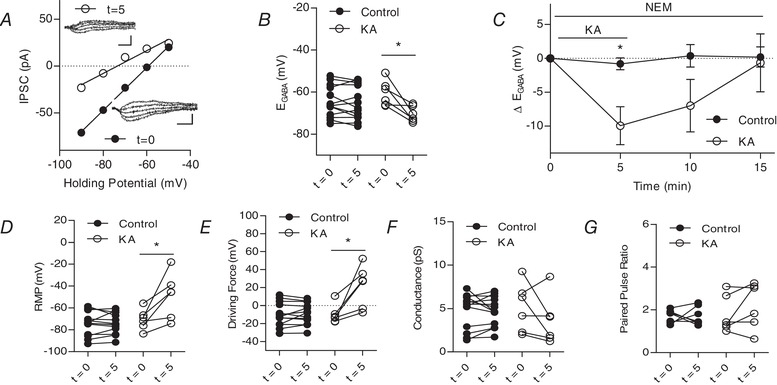
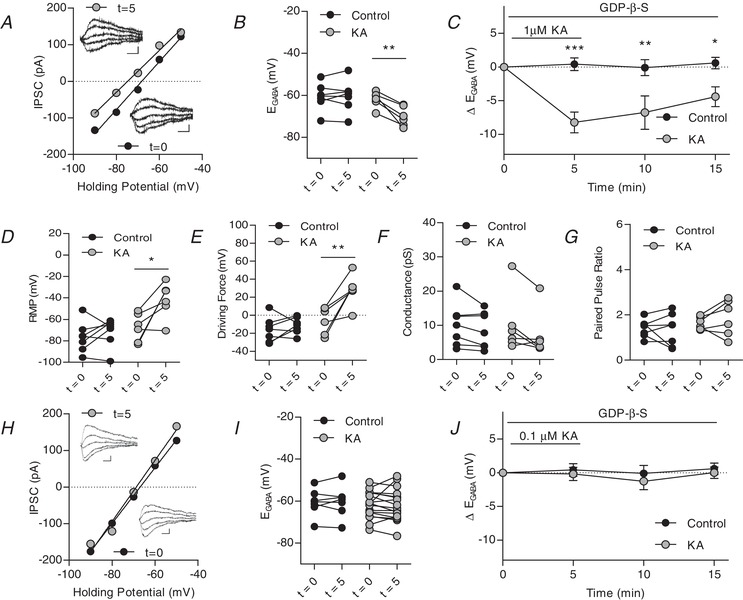
Key points: Potassium-chloride co-transporter 2 (KCC2) plays a critical role in regulating chloride homeostasis, which is essential for hyperpolarizing inhibition in the mature nervous system. KCC2 interacts with many proteins involved in excitatory neurotransmission, including the GluK2 subunit of the kainate receptor (KAR). We show that activation of KARs hyperpolarizes the reversal potential for GABA (EGABA ) via both ionotropic and metabotropic signalling mechanisms. KCC2 is required for the metabotropic KAR-mediated regulation of EGABA , although ionotropic KAR signalling can hyperpolarize EGABA independent of KCC2 transporter function. The KAR-mediated hyperpolarization of EGABA is absent in the GluK1/2-/- mouse and is independent of zinc release from mossy fibre terminals. The ability of KARs to regulate KCC2 function may have implications in diseases with disrupted excitation: inhibition balance, such as epilepsy, neuropathic pain, autism spectrum disorders and Down's syndrome.

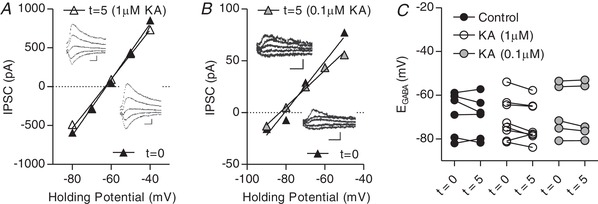
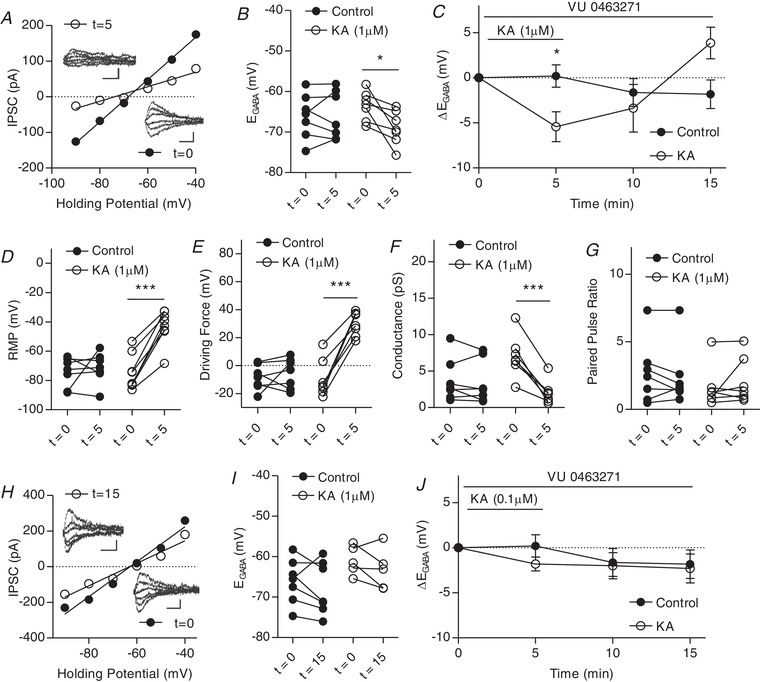
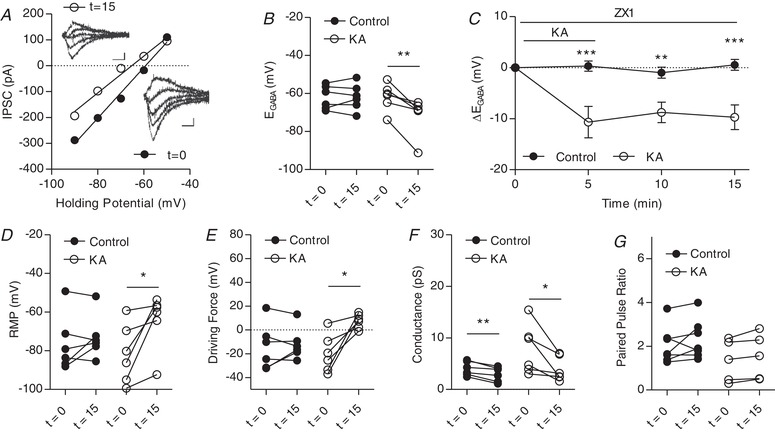
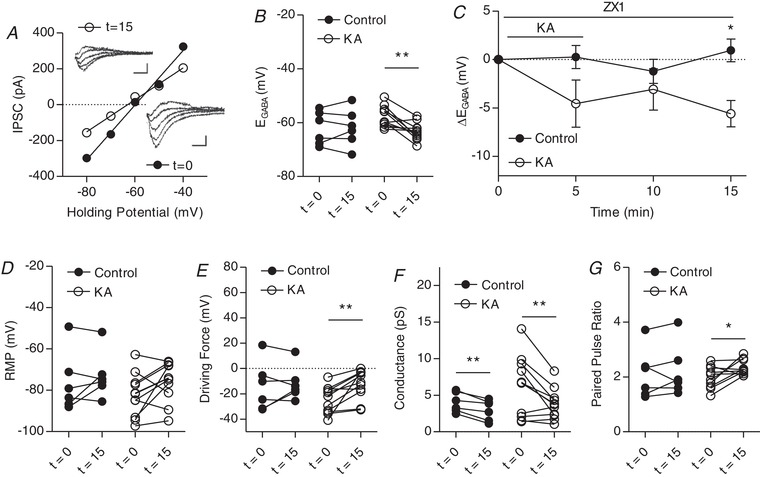
Abstract: Potassium-chloride co-transporter 2 (KCC2) plays a critical role in the regulation of chloride (Cl- ) homeostasis within mature neurons. KCC2 is a secondarily active transporter that extrudes Cl- from the neuron, which maintains a low intracellular Cl- concentration [Cl- ]. This results in a hyperpolarized reversal potential of GABA (EGABA ), which is required for fast synaptic inhibition in the mature central nervous system. KCC2 also plays a structural role in dendritic spines and at excitatory synapses, and interacts with 'excitatory' proteins, including the GluK2 subunit of kainate receptors (KARs). KARs are glutamate receptors that display both ionotropic and metabotropic signalling. We show that activating KARs in the hippocampus hyperpolarizes EGABA , thus strengthening inhibition. This hyperpolarization occurs via both ionotropic and metabotropic KAR signalling in the CA3 region, whereas it is absent in the GluK1/2-/- mouse, and is independent of zinc release from mossy fibre terminals. The metabotropic signalling mechanism is dependent on KCC2, although the ionotropic signalling mechanism produces a hyperpolarization of EGABA even in the absence of KCC2 transporter function. These results demonstrate a novel functional interaction between a glutamate receptor and KCC2, a transporter critical for maintaining inhibition, suggesting that the KAR:KCC2 complex may play an important role in excitatory:inhibitory balance in the hippocampus. Additionally, the ability of KARs to regulate chloride homeostasis independently of KCC2 suggests that KAR signalling can regulate inhibition via multiple mechanisms. Activation of kainate-type glutamate receptors could serve as an important mechanism for increasing the strength of inhibition during periods of strong glutamatergic activity.

Keywords: Chloride transport; GABA; KCC2; Kainate receptor; electrophysiology; hippocampus; ionotropic; metabotropic.


Figures

Figure 1
Figure 1
Kainate receptors modulate IPSCs in CA3 pyramidal cells A, group data showing E GABA before and after KAR blockade with UBP310 (n = 5). B, group data showing driving force for Cl before and after KAR blockade with UBP310 (n = 5). C, plot of voltage–current curve for a cell at t = 0 (E GABA = −75.1 mV) and t = 5(E GABA = −79.1 mV). Inset: examples of evoked IPSCs (scale bar = 60 pA, 10 ms). D, group data showing E GABA at t = 0 and t = 5 (n = 11 control, 8 KA). E, plot of group data showing the effect of 1 μm KA application on E GABA over time (n = 11 control, 8 KA) F, group data showing resting membrane potential at t = 0 and t = 5 (n = 11 control, 8 KA). G, group data showing driving force for Cl at t = 0 and t = 5 (n = 11 control, 8 KA). H, group data showing C conductance at t = 0 and t = 5 (n = 11 control, 8 KA). I, group data showing paired pulse ratio at t = 0 and t = 5 (n = 9 control, 8 KA) (* P < 0.05, ** P < 0.01).
Figure 2
Figure 2
Kainate receptors activated by 0.1 μm KA modulate IPSCs A, plot of voltage–current curve for a cell at t = 0 (E GABA = −65.6 mV) and t = 15 (E GABA = −74.6 mV). Inset: examples of evoked IPSCs (scale bar = 60 pA, 10 ms). B, group data showing E GABA at t = 0 and t = 15. C, plot of group data showing the effect of 0.1 μm KA on E GABA over time. D, group data showing resting membrane potential at t = 0 and t = 15. E, group data showing driving force for Cl at t = 0 and t = 15. F, group data showing Cl conductance at t = 0 and t = 15. G, group data showing paired pulse ratio at t = 0 and t = 15 (n = 9 control, n = 10 KA, all experiments) (* P < 0.05).
Figure 3
Figure 3
Kainate receptors activated by 1 μM kainic acid modulate IPSCs in the presence of metabotropic signalling blocker NEM A, plot of voltage–current curve for a cell at t = 0 (E GABA = −59.2 mV) and t = 5 (E GABA = −73.5 mV). Inset, examples of evoked IPSCs (scale bar: 60 pA, 10 ms). B, group data showing E GABA at t = 0 and t = 5 (n = 13 control, n = 6 KA). C, plot of group data showing the effect of 1 μm KA on E GABA over time (n = 13 control, n = 6 KA). D, group data showing resting membrane potential at t = 0 and t = 5 (n = 13 control, n = 6 KA). E, group data showing driving force for Cl at t = 0 and t = 5 (n = 13 control, n = 6 KA). F, group data showing Cl conductance at t = 0 and t = 5 (n = 11 control, 8 KA). G, group data showing paired pulse ratio at t = 0 and t = 5 (n = 7 control, 8 KA) (* P < 0.05) [Correction made on 9 February 2019, after first online publication: Figure 3 was replaced with the current version].
Figure 4
Figure 4
Kainate receptors activated by 1 μM kainic acid modulate IPSCs in the presence of metabotropic signalling blocker GDP‐β‐S A, plot of voltage–current curve for a cell at t = 0 (E GABA = −68.6 mV) and t = 5 (E GABA = −74.2 mV). Inset, examples of evoked IPSCs (scale bar: 60 pA, 10 ms). B, group data showing E GABA at t = 0 and t = 5. C, plot of group data showing the effect of 1 μM KA on E GABA over time. D, group data showing resting membrane potential at t = 0 and t = 5. with 1 μM KA application E, group data showing driving force for Cl at t = 0 and t = 5 (n = 13 control, n = 6 KA). F, group data showing Cl conductance at t = 0 and t = 5 with 1 μM KA application. G, group data showing paired pulse ratio at t = 0 and t = 5 with 1 μM KA application (n = 7 control, n = 6 KA, all 1 μM KA experiments). H, plot of voltage‐current curve for a cell at t = 0 (E GABA = −67.3 mV) and t = 15 (E GABA = −69.1 mV) with 0.1 μM KA application. Inset, examples of evoked IPSCs (scale bar: 60 pA, 10 ms). I, group data showing E GABA at t = 0 and t = 5 with 0.1 μM KA. J, plot of group data showing the effect of 0.1 μM KA on E GABA over time. (n = 7 control, n = 17 KA, all 0.1 μM KA, experiments) (* P < 0.05, ** P < 0.01, *** P < 0.001) [Correction made on 9 February 2019, after first online publication: Figure 4 was replaced with the current version].
Figure 5
Figure 5
1 μm or 0.1 μm KA does modulate IPSCs in GluK1/2–/– CA3 pyramidal cells A, plot of voltage–current curve for a GluK1/2–/– neuron at t = 0 (E GABA = −64.4 mV) and t = 5 with 1 μm KA applied (E GABA = −65.1 mV). Inset: examples of evoked IPSCs (scale bar = 200 pA, 10 ms). B, plot of voltage–current curve for a GluK1/2–/– neuron at t = 0 (E GABA = −80.7 mV) and t = 5 with 0.1 μm KA applied (E GABA = −83.1 mV). Inset: examples of evoked IPSCs (scale bar = 60 pA, 10 ms). C, group data showing E GABA at t = 0 and t = 5 (n = 6 control, 7 KA 1 μm, 5 KA 0.1 μm).
Figure 6
Figure 6
Kainate receptor mediated modulation of IPSCs activated by 0.1 μm but not 1 μm KA is dependent on KCC2 transporter function A, plot of voltage–current curve for a cell at t = 0 (E GABA = −68.6 mV) and t = 5 (E GABA = −71.9 mV). Inset: examples of evoked IPSCs (scale bar = 100 pA, 20 ms). B, group data showing E GABA at t = 0 and t = 5. C, plot of group data showing the effect of 1 μm KA on E GABA over time in the presence of specific KCC2 antagonist VU0463271. D, group data showing resting membrane potential at t = 0 and t = 5. E, group data showing driving force for Cl at t = 0 and t = 5. F, group data showing Cl conductance at t = 0 and t = 5. G, group data showing paired pulse ratio at t = 0 and t = 15. H, plot of voltage‐current curve for a cell at t = 0 (E GABA = −62.8 mV) and t = 15 (E GABA = −63.1 mV). Inset, examples of evoked IPSCs (scale bar: 100 pA, 20 ms). I, group data showing E GABA at t = 0 and t = 15. J, plot of group data showing the effect of 0.1 μM KA on E GABA over time in the presence VU0463271. (n = 7 control, n = 7 1 μm KA, n = 5 1 μm KA, all experiments) (* P < 0.05, *** P < 0.001).
Figure 7
Figure 7
Kainate receptors activated by 1 μm KA modulate IPSCs in CA3 pyramidal cells in the presence of zinc chelator ZX1 A, plot of voltage–current curve for a cell at t = 0 (E GABA = −59.3 mV) and t = 15 ( = −65.2 mV). Inset: examples of evoked IPSCs (scale bar = 60 pA, 10 ms). B, group data showing E GABA at t = 0 and t = 5 (n = 6 control, n = 6 KA). C, plot of group data showing the effect of 1 μm KA on E GABA over time (n = 6 control, n = 6 KA). D, group data showing resting membrane potential at t = 0 and t = 15 (n = 6 control, n = 6 KA). E, group data showing driving force for Cl at t = 0 and t = 5 (n = 6 control, n = 6 KA). F, group data showing Cl at t = 0 and t = 15. G, group data showing paired pulse ratio at t = 0 and t = 15 (n = 6 control, n = 5 KA) (* P < 0.05, ** P < 0.01).
Figure 8
Figure 8
Kainate receptors activated by 0.1 μm KA modulate IPSCs in CA3 pyramidal cells in the presence of zinc chelator ZX1 A, plot of voltage–current curve for a cell at t = 0 (E GABA = −59.7 mV) and t = 15 (E GABA = −63.0 mV). Inset: examples of evoked IPSCs (scale bar = 60 pA, 10 ms). B, group data showing E GABA at t = 0 and t = 5. C, plot of group data showing the effect of 1 μm KA on E GABA over time. D, group data showing resting membrane potential at t = 0 and t = 15. E, group data showing driving force for Cl at t = 0 and t = 5. F, group data showing Cl at t = 0 and t = 15. G, group data showing paired pulse ratio at t = 0 and t = 15 (n = 6 control, 10 KA, experiments) (* P < 0.05, ** P < 0.01).

Comment in

  • Inhibition Gets a New KAR Smell.
    Courtney CD, Christian CA. Courtney CD, et al. Epilepsy Curr. 2019 May-Jun;19(3):187-189. doi: 10.1177/1535759719843277. Epub 2019 Apr 29. Epilepsy Curr. 2019. PMID: 31032637 Free PMC article.

References

    1. Acton BA, Mahadevan V, Mercado A, Uvarov P, Ding Y, Pressey J, Airaksinen MS, Mount DB & Woodin MA (2012). Hyperpolarizing GABAergic transmission requires the KCC2C‐terminal ISO domain. J Neurosci 32, 8746–8751. - PMC - PubMed
    1. Banke TG & Gegelashvili G (2008). Tonic activation of group I mGluRs modulates inhibitory synaptic strength by regulating KCC2 activity. J Physiol (Lond) 586, 4925–4934. - PMC - PubMed
    1. Blaesse P, Airaksinen MS, Rivera C & Kaila K (2009). Cation‐chloride cotransporters and neuronal function. Neuron 61, 820–838. - PubMed
    1. Castillo PE, Malenka RC & Nicoll RA (1997). Kainate receptors mediate a slow postsynaptic current in hippocampal CA3 neurons. Nature 388, 182–186. - PubMed
    1. Chorin E, Vinograd O, Fleidervish I, Gilad D, Herrmann S, Sekler I, Aizenman E & Hershfinkel M (2011). Upregulation of KCC2 activity by zinc‐mediated neurotransmission via the mZnR/GPR39 receptor. J Neurosci 31, 12916–12926. - PMC - PubMed

Publication types

MeSH terms

LinkOut - more resources