. 2018 Nov;11(11):e002345.
doi: 10.1161/CIRCGEN.118.002345.

High-Throughput Functional Evaluation of KCNQ1 Decrypts Variants of Unknown Significance

Affiliations

High-Throughput Functional Evaluation of KCNQ1 Decrypts Variants of Unknown Significance

Carlos G Vanoye et al. Circ Genom Precis Med. 2018 Nov.

Abstract

Background: The explosive growth in known human gene variation presents enormous challenges to current approaches for variant classification that have implications for diagnosis and treatment of many genetic diseases. For disorders caused by mutations in cardiac ion channels as in congenital arrhythmia syndromes, in vitro electrophysiological evidence has high value in discriminating pathogenic from benign variants, but these data are often lacking because assays are cost, time, and labor intensive.

Methods: We implemented a strategy for performing high-throughput functional evaluations of ion channel variants that repurposed an automated electrophysiological recording platform developed previously for drug discovery.

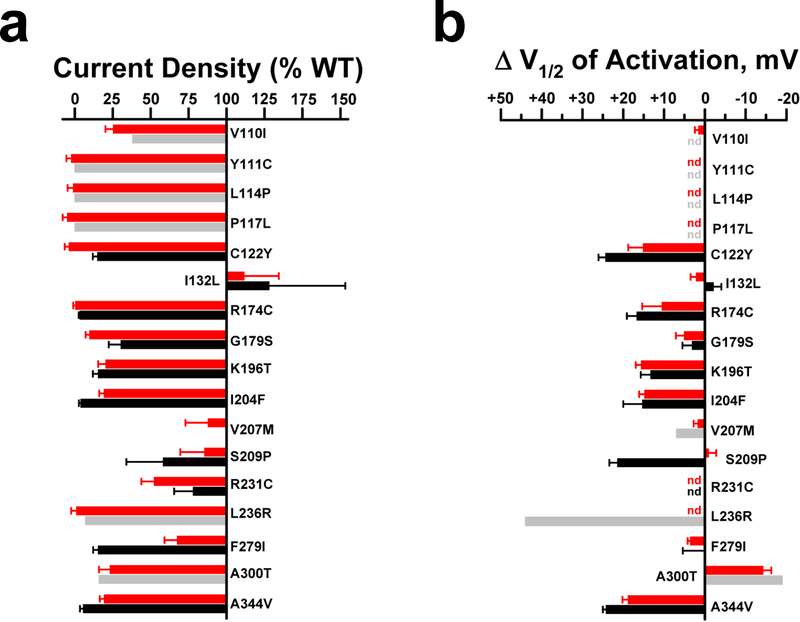
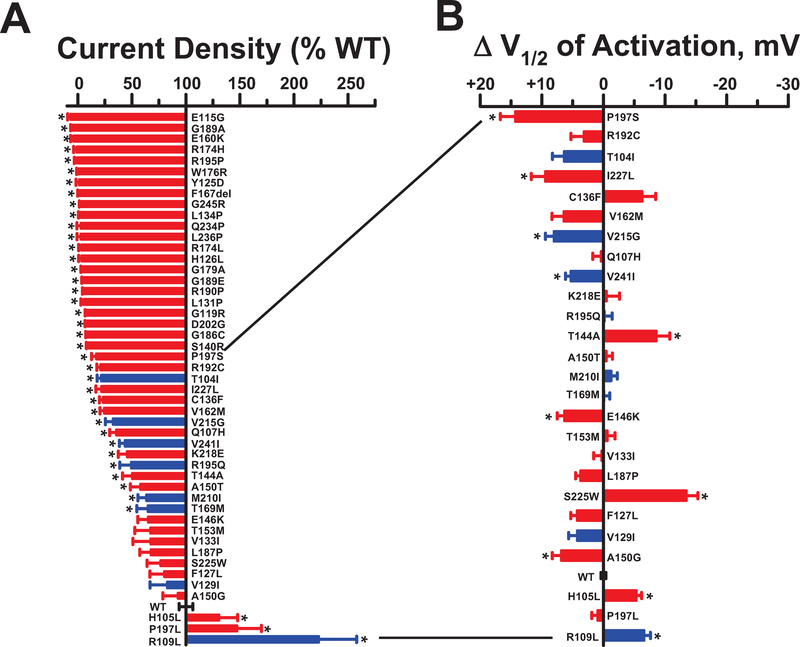
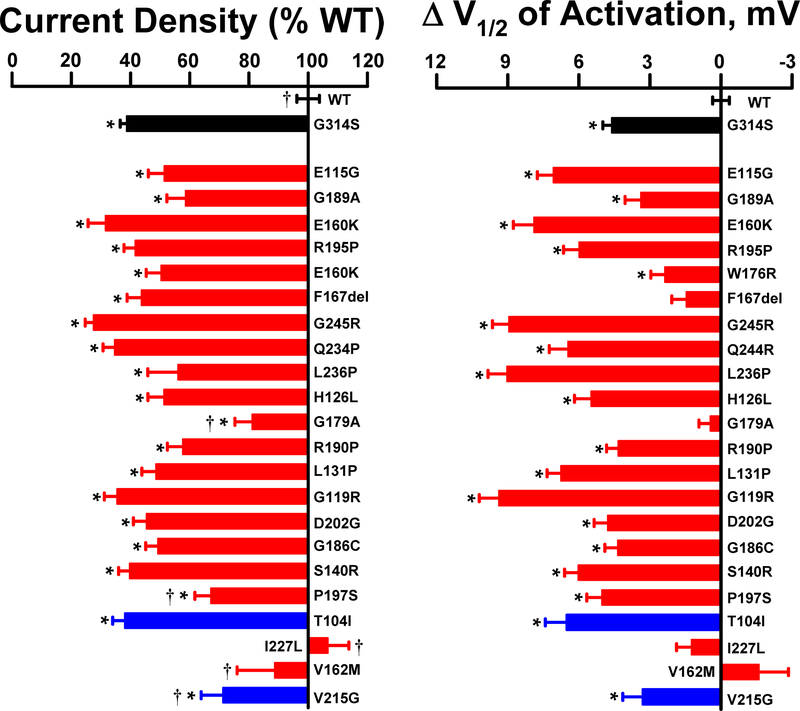
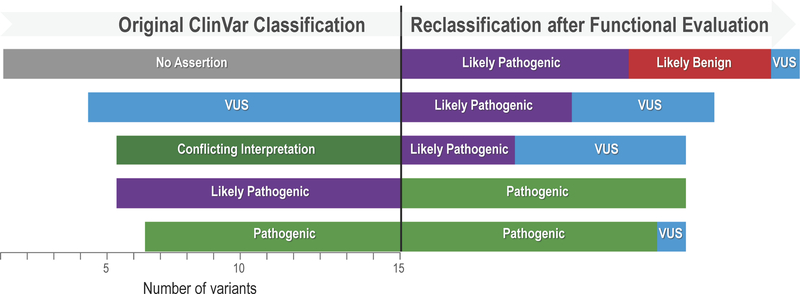
Results: We demonstrated the success of this approach by evaluating 78 variants in KCNQ1, a major gene involved in genetic disorders of cardiac arrhythmia susceptibility. We benchmarked our results with traditional electrophysiological approaches and observed a high level of concordance. This strategy also enabled studies of dominant-negative behavior of variants exhibiting severe loss-of-function. Overall, our results provided functional data useful for reclassifying >65% of the studied KCNQ1 variants.

Conclusions: Our results illustrate an efficient and high-throughput paradigm linking genotype to function for a human cardiac ion channel that will enable data-driven classification of large numbers of variants and create new opportunities for precision medicine.

Keywords: electrophysiology; ion channels; long QT syndrome; mutation; potassium channels.


Figures

Figure 1:
Figure 1:. Efficiency of KCNQ1 and KCNE1 electroporation.
Representative plots of fluorescence intensity vs cell counts measured by flow cytometry for CHO cells co-transfected with KCNQ1 (a, green fluorescence, FITC) and KCNE1 (b, red fluorescence, PE). The percentage of fluorescent cells is indicated within the panels. c) Plot of FITC vs PE intensity illustrating efficiency of KCNQ1 (Q1) and KCNE1 (E1) co-transfection (purple dots, upper right quadrant). d) Box plots illustrating the range of transfection efficiencies for KCNQ1, KCNE1 and co-expression for 32 separate electroporation experiments. Each box height represents the 25th to 75th percentile and the error bars represent the 5th to 95th percentile. Individual data points falling outside the 5–95th percentile range are plotted. Black and colored horizontal lines within each box indicate the median and mean values, respectfully.
Figure 2:
Figure 2:. Automated patch clamp recording of wild type KCNQ1.
A. Screen-shot of automated whole-cell current planar patch clamp recordings from CHO-K1 cells electroporated with plasmids encoding wild type (WT) KCNQ1 and KCNE1. The panels on the right highlight 16 out of the 384 wells that show whole-cell currents with IKs-like kinetics. B. Current density-voltage relationships obtained from CHO-K1 cells transfected with KCNQ1 and KCNE1 recorded by automated (⚫, n = 250) or manual (⚪, n = 19) patch clamp. Whole-cell currents are normalized by membrane capacitance (units are pA/pF). c) Average whole-cell currents recorded from cells electroporated with KCNQ1 and KCNE1 recorded using automated (top) or manual (bottom) patch clamp and normalized to the maximum peak current at +60 mV. d) Voltage-dependence of activation curves obtained from whole-cell currents recorded using automated (⚫) or manual (⚪) patch clamp.
Figure 3:
Figure 3:. Functional properties of training set KCNQ1 variants recorded by automated patch clamp.
A. Average whole-cell currents recorded at +60 mV from cells expressing training set KCNQ1 variants plotted as percent of WT (n = 23–137). B. Difference in activation V½ relative to WT determined for variants with current amplitude >10% of WT (n = 4–79). KCNQ1 variants are ordered by codon number with red bars indicating disease-associated variants and magenta bars representing non-disease variants. Bar height indicates mean value and error bars are SEM (* indicates p ≤0.01).
Figure 4:
Figure 4:. KCNQ1 variants with altered gating kinetics.
Average whole-cell currents recorded from cells expressing select KCNQ1 variants by automated and manual patch clamp recording. Traces were normalized to peak current measured at +60 mV to enable comparison of gating behaviors among variants with divergent current density. Horizontal bars represent 500 ms. Time constants of deactivation are presented in Supplemental Table S4a (automated patch clamp) and Supplemental Table S4c (manual patch clamp). Only I132L exhibited a significant difference in deactivation time constant between the two methods when expressed as a % of WT channels determined on the same platform (automated: 170 ± 15%, n = 21; vs manual: 280 ± 51%, n = 7; p ≤ 0.01).
Figure 5:
Figure 5:. Comparison of automated and manual patch clamp for KCNQ1 variants.
A. Average whole-cell current density for training set disease-associated KCNQ1 variants determined by automated (red bars) or manual (grey or black bars) patch clamp recording measured at +60 mV and expressed as percent of WT. For manual patch clamp, grey shaded bars are values derived from published reports (mean values only, see below for citations), and black shaded bars are data from this study (mean, SEM). Quantified functional parameters are provided in Supplemental Tables S4a and S4b, and the asterisk indicates p ≤ 0.01. B. Differences in activation V½ relative to WT for training set disease-associated KCNQ1 variants (nd = not determined). Functional data from the literature are for V100I, Y111C, L114P, P117L, V207M, L236R, and A300T.
Figure 6:
Figure 6:. Functional properties of KCNQ1 variants of unknown significance.
A. Plot of average whole-cell current density (measured at +60 mV) recorded from cells expressing test KCNQ1 variants and displayed as percent of WT (n = 23–94). KCNQ1 variants are ordered from lowest to greatest current density with red bars indicating disease-associated variants and blue bars representing ExAC variants. B. Difference in activation V½ relative to WT determined for variants with current amplitude >10% of WT (n = 6–55). Variants are listed in the same order as in panel a. Bar height indicates mean value and error bars are SEM (* indicates p ≤ 0.01). Quantified functional parameters are provided in Supplemental Table S4c.
Figure 7:
Figure 7:. Dominant-negative behavior of KCNQ1 variants.
A. Average whole-cell current density (measured at +60 mV) recorded from CHO-KCNE1 cells co-expressing WT KCNQ1 with select variants (n = 27–75). Values are expressed as percent of mean current density recorded from CHO-KCNE1 cells co-transfected with two different WT KCNQ1 plasmids (KCNQ1-mScarlet, KCNQ1-EGFP; n = 247). Red and blue bars represent disease-associated variants and population variants (ExAC), respectively. For comparison, current density recorded from cells co-expressing WT KCNQ1 with a known dominant-negative mutant (G314S; n = 206) is plotted (black bar). B. Difference in activation V½ relative to WT + WT determined for variants co-expressed with WT (n = 23–56). Bar height indicates mean value and error bars are SEM (* indicates p ≤ 0.01 for differences between variant + WT and WT + WT; † indicates p ≤ 0.01 for differences between variant + WT and G314S + WT). Quantified functional parameters are provided in Supplemental Table S4d.
Figure 8:
Figure 8:. Reclassification of KCNQ1 variants.
The original classification in ClinVar is represented on the left half of the display and the reclassification based upon functional data is illustrated by the right half. The horizontal bars represent the variants classified in different categories and the length of the bars is proportional to the number of variants. One variant reclassified from Likely Benign to Benign is not illustrated.

References

    1. Eilbeck K, et al. Settling the score: variant prioritization and Mendelian disease. Nat Rev Genet 2017;18:599–612. - PMC - PubMed
    1. Cooper GM, Shendure J. Needles in stacks of needles: finding disease-causal variants in a wealth of genomic data. Nat Rev Genet 2011;12:628–640. - PubMed
    1. Richards S, et al. Standards and guidelines for the interpretation of sequence variants: a joint consensus recommendation of the American College of Medical Genetics and Genomics and the Association for Molecular Pathology. Genet Med 2015;17:405–424. - PMC - PubMed
    1. Manolio TA, et al. Bedside back to bench: Building bridges between basic and clinical genomic research. Cell 2017;169:6–12. - PMC - PubMed
    1. Ptacek LJ. Episodic disorders: channelopathies and beyond. Annu Rev Physiol 2015;77:475–479. - PubMed

Publication types

MeSH terms

Substances