

Slowdown in the Decline of Tuberculosis Rates in California, 2000-2016
- PMID: 30571310
- PMCID: PMC6336046
- DOI: 10.2105/AJPH.2018.304816
Slowdown in the Decline of Tuberculosis Rates in California, 2000-2016
Abstract
Objectives: To determine the impact of the 2007-2009 economic crisis on tuberculosis (TB) trends among California residents.
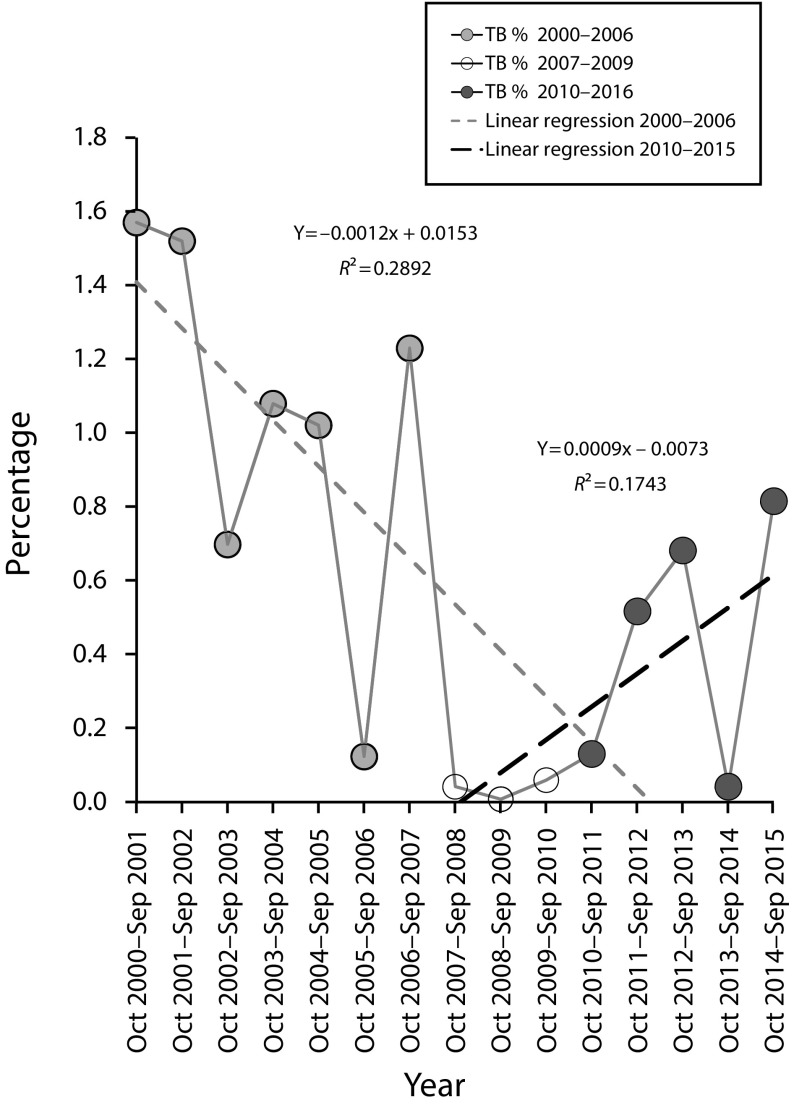
Methods: We analyzed available data from 4 different population-representative data sets. We used time charts, trend lines, and change-point detection tests during 2000 to 2016 to describe TB trends in California.
Results: We found statistically significant changes in California TB trends with the time of the onset of the economic downturn based on age-adjusted TB case rates and TB mortality rates, crude rate of TB hospitalizations, and self-reported TB. Change on TB incidence was especially apparent among racial/ethnic minority groups.
Conclusions: To our knowledge, changes in TB trends in the United States matching in time with the 2007-2009 economic crisis have not been previously reported. This study identified a slowdown in the decline of TB rates by 2007 to 2009 and provides new knowledge on TB trends that can be used to achieve California's goal of eliminating TB by 2040 and in the prevention and control of TB in the United States.
Figures


Comment in
-
Not So Fast: Slowing Tuberculosis Decline in California.Am J Public Health. 2019 Feb;109(2):187-189. doi: 10.2105/AJPH.2018.304886. Am J Public Health. 2019. PMID: 30649944 Free PMC article. No abstract available.
Similar articles
-
Trends in Tuberculosis Cases Among Nursing Home Residents, California, 2000 to 2009.J Am Geriatr Soc. 2015 Jun;63(6):1098-104. doi: 10.1111/jgs.13437. Epub 2015 Jun 11. J Am Geriatr Soc. 2015. PMID: 26096384
-
Trends in tuberculosis incidence--United States, 2006.MMWR Morb Mortal Wkly Rep. 2007 Mar 23;56(11):245-50. MMWR Morb Mortal Wkly Rep. 2007. PMID: 17380106
-
Trends in tuberculosis--United States, 1998-2003.MMWR Morb Mortal Wkly Rep. 2004 Mar 19;53(10):209-14. MMWR Morb Mortal Wkly Rep. 2004. PMID: 15029114
-
The growing burden of tuberculosis: global trends and interactions with the HIV epidemic.Arch Intern Med. 2003 May 12;163(9):1009-21. doi: 10.1001/archinte.163.9.1009. Arch Intern Med. 2003. PMID: 12742798 Review.
-
Global epidemiology of tuberculosis.Semin Respir Crit Care Med. 2013 Feb;34(1):3-16. doi: 10.1055/s-0032-1333467. Epub 2013 Mar 4. Semin Respir Crit Care Med. 2013. PMID: 23460002 Review.
References
-
- Global tuberculosis control: surveillance, planning, financing. Geneva, Switzerland: World Health Organization; 2008.
-
- Centers for Disease Control and Prevention. Reported tuberculosis in the United States, 2015. Atlanta, GA: US Department of Health and Human Services; 2016.
-
- Report on Tuberculosis in California, 2015. Richmond, CA: California Department of Public Health, Tuberculosis Control Branch; 2016.
-
- Medel-Herrero A, Martínez-López B, Silva-Del-Rio N, Pires AF, Edmondson A, Schenker M. Tuberculosis prevalence among US crop-workers, 2000–2012: trends and contributing factors. J Occup Environ Med. 2018;60(7):603–611. - PubMed
MeSH terms
LinkOut - more resources
Full Text Sources
Medical
